Post-Earnings Drift Across 16 Markets: A Global Event Study
PEAD event study on 16 exchanges with MOC entry and local benchmarks. Q5-Q1 positive on 15 of 16. India leads at +5.17pp. US beats don't drift post-entry (-0.40%). Emerging markets show real drift. Developed markets don't.

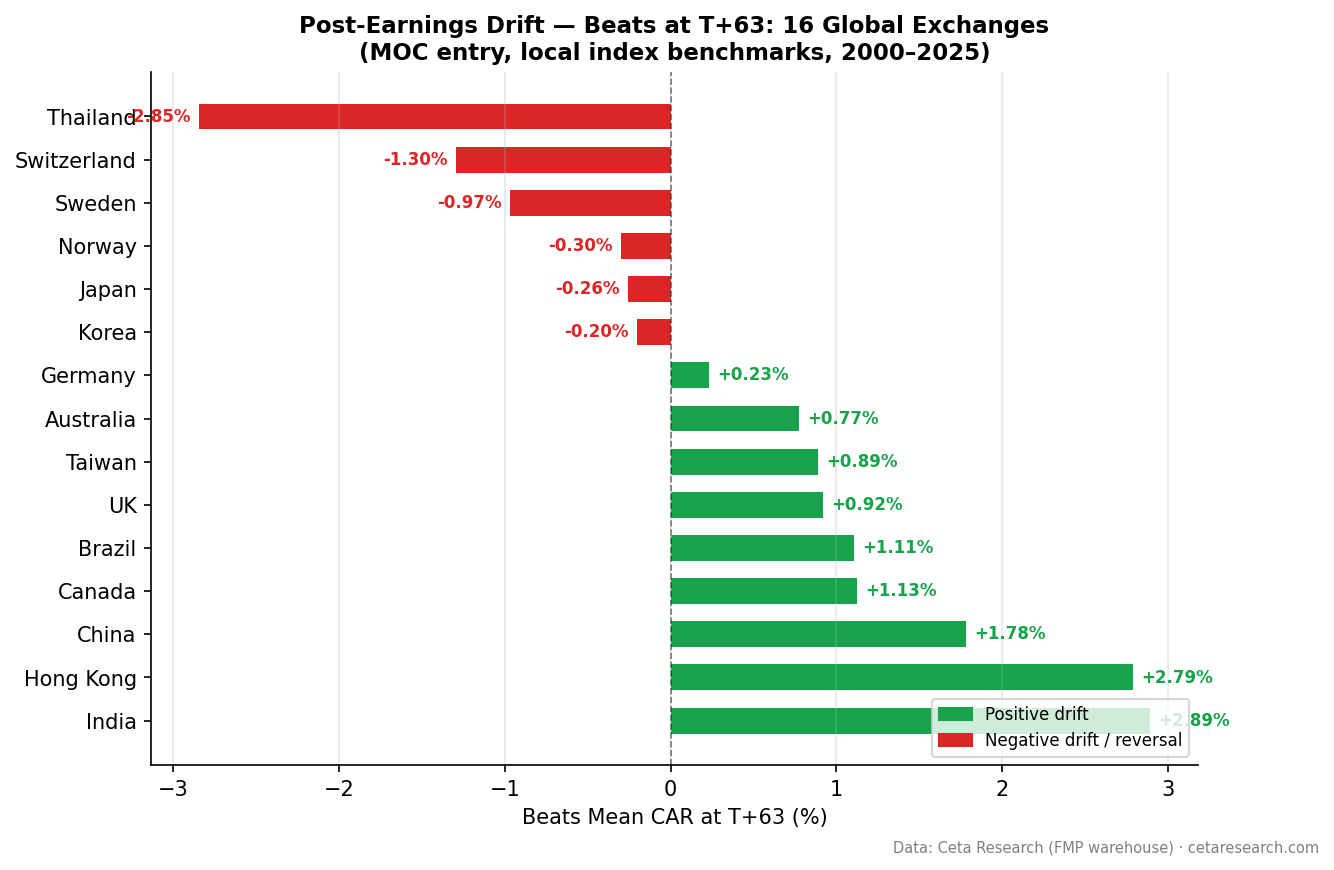
Post-Earnings Announcement Drift is a global phenomenon. We ran the same event study on 16 exchanges with next-day close entry (MOC execution) and local currency benchmarks. 15 of 16 show a positive Q5-Q1 quintile spread. The effect is nearly universal.
Contents
- Method
- Global Results
- What the Data Shows
- The Emerging vs Developed Split
- Taiwan: Strong Quintile Spread, Miss-Dominated Signal
- How We Handled Exchange Selection
- Screen for Global Earnings Surprises
- Limitations
- Takeaway
- References
The story splits cleanly: emerging markets (India, Hong Kong, China) show meaningful post-entry drift. Developed markets (US, Japan, Korea) show negligible or negative beat drift after entry. The announcement-day reaction, which you can't trade on, accounts for most of the "drift" in traditional PEAD studies.
Method
Same event study design applied to each exchange independently:
- Signal:
(epsActual - epsEstimated) / |epsEstimated| - Universe: Exchange-specific market cap filters (historical FY key_metrics)
- Period: Exchange-dependent start date, all through 2025
- Execution: Next-day close (MOC). Entry at the close of the first trading day after the announcement.
- Benchmark: Local currency index per exchange (Sensex for India, Nikkei for Japan, Bovespa for Brazil, SPY for US, etc.)
- Windows: T+1, T+5, T+21, T+63 trading days from entry
- Surprise cap: |surprise| <= 200%
- Winsorization: 1st/99th percentile
Global Results
All 16 exchanges, with next-day close entry and local currency benchmarks. Sorted by beats CAR at T+63:
| Exchange | Events | Benchmark | Beats T+63 | Misses T+63 | Q5-Q1 |
|---|---|---|---|---|---|
| India (BSE+NSE) | 15,055 | Sensex | +2.89% | -0.44% | +5.17% |
| Hong Kong (HKSE) | 4,579 | Hang Seng | +2.79% | +0.90% | +3.32% |
| China (SHZ+SHH) | 20,319 | SSE Composite | +1.78% | +0.74% | +2.03% |
| Canada (TSX) | 20,168 | TSX Composite | +1.13% | -0.34% | +2.44% |
| Brazil (SAO) | 4,792 | Bovespa | +1.11% | -0.38% | +1.78% |
| UK (LSE) | 12,327 | FTSE 100 | +0.92% | -0.56% | +2.31% |
| Taiwan (TAI) | 16,497 | TAIEX | +0.89% | -1.60% | +4.37% |
| Australia (ASX) | 2,582 | ASX 200 | +0.77% | -0.39% | +1.11% |
| Germany (XETRA) | 5,974 | DAX | +0.23% | -1.72% | +2.98% |
| Korea (KSC) | 6,620 | KOSPI | -0.20% | -0.97% | +1.36% |
| Japan (JPX) | 16,364 | Nikkei 225 | -0.26% | -0.86% | +1.20% |
| Norway (OSL) | 1,590 | SPY | -0.30% | -0.46% | -1.69% |
| US (NYSE+NASDAQ+AMEX) | 165,723 | SPY | -0.40% | -0.95% | +1.18% |
| Sweden (STO) | 5,320 | SPY | -0.97% | -1.24% | +0.19% |
| Switzerland (SIX) | 1,961 | SPY | -1.30% | -2.44% | +1.63% |
| Thailand (SET) | 4,200 | SPY | -2.85% | -5.06% | +3.22% |
What the Data Shows
Five findings stand out.
1. 15 of 16 exchanges have a positive Q5-Q1 spread. The exception is Norway (OSL, 1,590 events), which has too thin a dataset for reliable conclusions. The relative signal (sorting by surprise magnitude and taking the extremes) works almost everywhere, even in markets where beats don't drift positively in absolute terms.
2. Emerging markets show meaningful post-entry beat drift. India (+2.89%), Hong Kong (+2.79%), China (+1.78%). These markets produce positive abnormal returns for beats even after entering at the next-day close. Developed markets (US -0.40%, Japan -0.26%, Korea -0.20%) show no positive beat drift post-entry. The announcement-day reaction accounts for most of the "drift" in efficient markets.
3. The miss signal is more robust globally. In most developed markets, misses underperform more consistently than beats outperform. Germany (misses -1.72%), Taiwan (misses -1.60%), Korea (misses -0.97%). The miss-avoidance signal survives MOC execution better than the beat-chasing signal.
4. China and Hong Kong misses drift positive. China misses at T+63: +0.74% (t=+4.67, significant). Hong Kong misses: +0.90% (t=+2.46). In these markets, even miss stocks outperform the local index. This likely reflects strong market-wide momentum that lifts all stocks, with beats lifted more than misses. The Q5-Q1 spread still distinguishes them.
5. Thailand remains a counter-finding. Both beats (-2.85%) and misses (-5.06%) show negative T+63 drift vs SPY. The Thai market shows reversal rather than continuation after earnings surprises.
The Emerging vs Developed Split
The pattern is clear when you group by market type:
Emerging markets (India, Hong Kong, China, Brazil): Average beats T+63 = +2.14%
Developed markets (US, Japan, Canada, UK, Korea, Germany): Average beats T+63 = +0.24%
A 9x difference in drift magnitude by market development stage. More importantly, developed market beats are essentially flat or negative post-entry, while emerging market beats show meaningful positive drift. This fits exactly what the academic literature predicts. Bernard and Thomas (1989, 1990) documented that PEAD is stronger for low-coverage stocks. Emerging markets have less analyst coverage per listed company, and the announcement-day reaction doesn't fully capture the information.
Taiwan: Strong Quintile Spread, Miss-Dominated Signal
Taiwan (TAI) is an interesting case. The Q5-Q1 spread is +4.37% (second highest after India), with beats at T+63 at +0.89% vs TAIEX and misses at -1.60%. The drift pattern is dominated by the miss side. Q1 at T+63 shows -2.89%, one of the largest miss-quintile penalties in the global study.
This suggests PEAD in Taiwan is primarily a "miss avoidance" signal rather than a "beat chasing" signal. Taiwan's semiconductor and electronics concentration may amplify the earnings disappointment reaction, as supply chain signals are tracked closely by institutional investors.
How We Handled Exchange Selection
No exchanges were excluded for data quality in this study. All 16 ran cleanly through the same methodology. We include Thailand despite reversal results, and Norway despite thin data. Honest reporting means including all results, not only the ones that confirm the hypothesis.
Three exchanges were borderline on data volume (ASX: 2,582 events; SIX: 1,961; OSL: 1,590). All showed interpretable patterns and are included with the caveat that confidence intervals are wider. Norway's Q5-Q1 spread of -1.69pp is the one outlier from the otherwise universal positive-spread finding, but given the thin sample it's not a reliable signal.
Screen for Global Earnings Surprises
SELECT e.symbol,
    p.exchange,
    p.country,
    CAST(e.date AS DATE) AS event_date,
    e.epsActual AS actual_eps,
    e.epsEstimated AS est_eps,
    ROUND((e.epsActual - e.epsEstimated)
        / ABS(NULLIF(e.epsEstimated, 0)) * 100, 1) AS surprise_pct
FROM earnings_surprises e
JOIN profile p ON e.symbol = p.symbol
WHERE CAST(e.date AS DATE) >= CURRENT_DATE - INTERVAL '30' DAY
  AND e.epsEstimated IS NOT NULL
  AND ABS(e.epsEstimated) > 0.01
  AND e.epsActual > e.epsEstimated
  AND p.exchange IN ('BSE', 'NSE', 'SAO', 'SHZ', 'SHH', 'JPX', 'TSX', 'HKSE')
ORDER BY surprise_pct DESC
LIMIT 50
Limitations
MOC execution. Entering at next-day close removes the announcement-day reaction. This is realistic (you can't trade before seeing the announcement) but produces smaller numbers than traditional event studies that include the initial price jump.
Different start dates. India and Canada data starts from 2000. China data has thinner coverage before 2014. Shorter history for some exchanges means the results are less stable across market cycles.
Local index benchmarks. Sensex for India, Nikkei for Japan, Bovespa for Brazil, FTSE for UK. These indices capture local market movement better than US-listed ETFs but may not perfectly match the universe composition. Exchanges without a local index in FMP's data (Sweden, Switzerland, Thailand, Norway) fall back to SPY, which introduces currency effects.
Event study vs portfolio backtest. These aren't portfolio returns. We don't account for position sizing, capacity constraints, or portfolio-level transaction costs. A real implementation would look different.
Currency. All returns are in local currency. Cross-border investors face additional FX risk not captured here.
Takeaway
PEAD is a global phenomenon with nearly universal structure (positive Q5-Q1 on 15 of 16 exchanges) but the tradeable signal depends heavily on where you're trading. With MOC execution and local benchmarks, emerging markets (India +2.89%, HKSE +2.79%, China +1.78%) show real post-entry beat drift. Developed markets (US -0.40%, Japan -0.26%) don't.
The announcement-day reaction accounts for most of what traditional PEAD studies measure. Once removed, the beat-side signal only survives in markets with slower information diffusion. The miss-avoidance signal is more robust globally.
Thailand is a genuine counter-finding. Sweden shows negligible drift in both directions. Norway's thin dataset produces an unreliable negative spread. These aren't data quality issues. They're market structure differences worth understanding.
Data: Ceta Research (FMP financial data warehouse). 16 exchanges, 2000-2025 (date ranges vary by exchange). Exchange-specific market cap filters. MOC execution (next-day close entry). Abnormal returns vs local currency index benchmarks (SPY fallback for exchanges without local index data). 1st/99th percentile winsorization. Surprise cap 200%. Past performance does not guarantee future results. Educational content only, not investment advice.
References
- Ball, R. & Brown, P. (1968). "An Empirical Evaluation of Accounting Income Numbers." Journal of Accounting Research, 6(2), 159-178.
- Bernard, V. & Thomas, J. (1989). "Post-Earnings-Announcement Drift: Delayed Price Response or Risk Premium?" Journal of Accounting Research, 27(Supplement), 1-36.
- Bernard, V. & Thomas, J. (1990). "Evidence that Stock Prices Do Not Fully Reflect the Implications of Current Earnings for Future Earnings." Journal of Accounting and Economics, 13(4), 305-340.