
Pairs Trading Backtest: 20 Years of Japan Results

Of every exchange tested in this study, Japan stayed invested the most. Only one cash year in twenty. The US had six. Germany had fourteen. The UK had thirteen. Japan's pairs kept forming, year after year, through the financial crisis, through Abenomics, through COVID.
Contents
- Method
- Japan Results Summary
- Why Japan Stays Invested: The Keiretsu Effect
- Year-by-Year
- The Sharpe Ratio Caveat
- Current Japan Pairs Screen
- Limitations
Whether that's a feature or just a quirk of Japanese market structure is the central question of this post.
Method
Correlation-based pair selection following Gatev et al. (2006). Annual reconstitution each January. Universe: all JPX-listed stocks with market cap above the Japan-specific threshold. Pairs selected within the same GICS sector, Pearson correlation of daily returns above 0.70 over the prior 252 trading days. OLS hedge ratio, z-score entry at |z| > 1.5, exit at convergence. Equal-dollar market-neutral position sizing. Next-day close (MOC) execution. Japan's local risk-free rate (0.1%) used for Sharpe calculation. Benchmark: Nikkei 225 (local currency).
Full methodology: Pairs Trading Backtest Series
Japan Results Summary
| Metric | Japan (JPX) | Nikkei 225 |
|---|---|---|
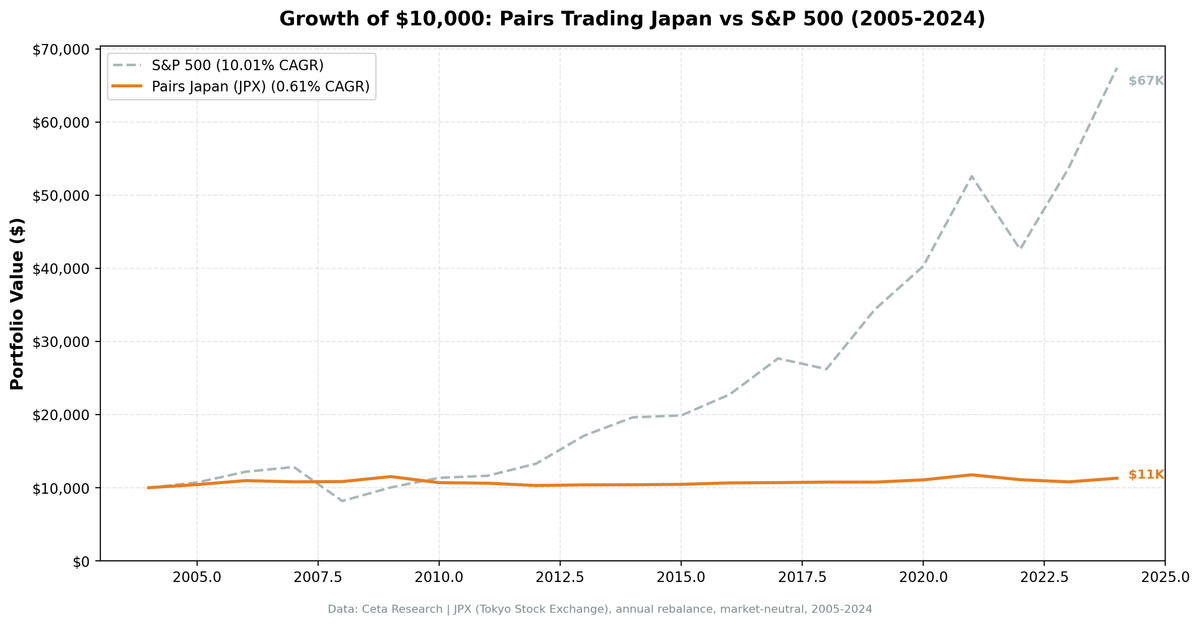
| CAGR (2005-2024) | 0.61% | 6.33% |
| Sharpe Ratio | +0.131 | - |
| Max Drawdown | -11.18% | -38.45% |
| Beta | 0.062 | 1.0 |
| Cash Years | 1 of 20 | - |
| Avg Active Pairs | 6.3 | - |
Low CAGR. Low beta. Low drawdown. The strategy is genuinely market-neutral on JPX, but it's not generating returns worth the complexity.
Why Japan Stays Invested: The Keiretsu Effect
Japan's corporate structure is unlike any major market. Keiretsu are interlocking networks of companies, banks, and suppliers that hold cross-shareholdings in each other, coordinate purchasing, and have done business together for decades. Toyota and Denso. Mitsubishi group companies. Sumitomo's manufacturing and financial arms.
These structural ties create persistent price correlations that don't decay the way they do in markets built on arms-length transactions. When Toyota sneezes, its suppliers catch a cold. That relationship held in 2005. It held in 2015. It still held in 2024.
The result: Japan finds qualifying pairs in 19 out of 20 years, averaging 6.3 active pairs when invested. The only cash year was 2019, when only 2 pairs met the minimum-3 threshold.
This isn't just a backtest artifact. Keiretsu relationships are publicly documented, widely studied, and structurally stable. The correlation patterns the strategy exploits reflect real economic relationships, not statistical noise from a short lookback window.
The tradeoff is that the same stability creates tight spreads. When correlations are very high, pairs diverge less, so z-score entries trigger less often. Lower signal frequency means fewer trades, which means less opportunity to compound returns. Japan runs 6.3 pairs on average. The US runs more than 20. Japan is always invested, but it's investing in a narrower set of opportunities with smaller moves.
Year-by-Year
| Year | Portfolio | Nikkei | Excess | Pairs Active |
|---|---|---|---|---|
| 2005 | +8.35% | +42.05% | -33.70% | 7 |
| 2006 | +1.72% | +6.06% | -4.34% | 8 |
| 2007 | -1.49% | -15.34% | +13.85% | 7 |
| 2008 | +0.32% | -38.45% | +38.77% | 8 |
| 2009 | +6.27% | +17.82% | -11.55% | 3 |
| 2010 | -7.21% | -2.41% | -4.80% | 5 |
| 2011 | -0.67% | -17.68% | +17.00% | 4 |
| 2012 | -3.64% | +24.86% | -28.50% | 9 |
| 2013 | +0.90% | +48.85% | -47.95% | 9 |
| 2014 | +0.10% | +9.43% | -9.33% | 4 |
| 2015 | +0.57% | +5.99% | -5.42% | 7 |
| 2016 | +1.88% | +6.20% | -4.32% | 7 |
| 2017 | +0.37% | +19.97% | -19.59% | 4 |
| 2018 | +0.66% | -16.78% | +17.44% | 8 |
| 2019 | 0.00% | +18.62% | -18.62% | 2 (cash) |
| 2020 | +2.83% | +17.47% | -14.63% | 4 |
| 2021 | +6.26% | +7.50% | -1.24% | 6 |
| 2022 | -5.68% | -12.23% | +6.55% | 6 |
| 2023 | -2.68% | +29.44% | -32.12% | 6 |
| 2024 | +4.65% | +18.08% | -13.43% | 8 |
2008: Japan's best year. The strategy returned +0.32% while the Nikkei fell -38.45%, a +38.77% excess return. Eight pairs were active going into the crisis. None had meaningful directional market exposure. The market-neutral structure held exactly as intended.
2010: Japan's worst year. -7.21%, the only year with a loss exceeding 5%. The post-crisis recovery in Japan was uneven. Different sectors and industrial groups recovered at different speeds, which means some historically correlated pairs diverged and stayed diverged rather than reverting. Five pairs active, and enough of them went the wrong way to post a -7.21% result.
2011: The Tohoku earthquake. March 2011 brought one of the largest earthquakes in recorded history, followed by a tsunami and the Fukushima nuclear crisis. Japan's broader market fell -17.68%. The pairs strategy lost -0.67% for the year, producing +17.00% excess return. Market-neutral positioning partially insulated it from the macro event.
2018 and 2022: Down-year outperformance. The strategy outperformed the Nikkei in both down years: +0.66% vs -16.78% in 2018 (+17.44% excess), and -5.68% vs -12.23% in 2022 (+6.55% excess). The crisis defense pattern is consistent.
2013: The cost of Abenomics. The Nikkei surged +48.85% as the Bank of Japan launched aggressive monetary easing. The strategy returned +0.90%. Pairs trading captures convergence, not directional rallies. When an entire market reprices upward, market-neutral strategies sit it out.
The overall pattern: Japan beats the Nikkei in crisis and down years (2007, 2008, 2011, 2018, 2022). It misses every bull year badly. That's the cost of market neutrality.
The Sharpe Ratio Caveat
Japan's reported Sharpe of +0.131 looks like a small positive. It's not.
The Bank of Japan held interest rates near zero or negative for most of 2001-2024. The risk-free rate used for Japan's Sharpe calculation is 0.1%. At that RFR, nearly any strategy with positive returns gets a positive Sharpe. The bar is on the floor.
Here's the math, approximately:
- Mean annual return: ~0.71% (implied from CAGR)
- Annual volatility: ~3.65%
- At RFR = 0.1%: Sharpe = (0.71 - 0.10) / 3.65 = +0.167 (consistent with reported 0.131)
- At RFR = 2.0% (as used for US Sharpe): Sharpe = (0.71 - 2.00) / 3.65 = -0.35
A Sharpe of -0.35 means the strategy returned less than what you'd earn from a risk-free instrument, adjusted for volatility. On a like-for-like basis with other exchanges in this study, Japan's risk-adjusted performance is poor.
This isn't a criticism of the backtest. Japan's near-zero rates are a real feature of the environment, and using the local RFR is methodologically correct. But when comparing across countries, the Sharpe ratio becomes apples-to-oranges. Context matters.
If you're evaluating Japan's pairs trading results, look at the MaxDD (-11.18%), the beta (0.062), and the year-by-year table. Those don't depend on the RFR assumption.
Current Japan Pairs Screen
The strategy runs an annual reconstitution each January. To see which JPX stock pairs currently meet the correlation and quality criteria:
WITH price_data AS (
  SELECT
    symbol,
    date,
    adjClose,
    exchange
  FROM stock_eod
  WHERE exchange = 'JPX'
    AND date >= CURRENT_DATE - INTERVAL '252 trading days'
),
correlation_pairs AS (
  SELECT
    a.symbol AS symbol_a,
    b.symbol AS symbol_b,
    CORR(a.adjClose, b.adjClose) AS correlation
  FROM price_data a
  JOIN price_data b ON a.date = b.date AND a.symbol < b.symbol
  GROUP BY a.symbol, b.symbol
  HAVING CORR(a.adjClose, b.adjClose) >= 0.70
)
SELECT *
FROM correlation_pairs
ORDER BY correlation DESC
LIMIT 50
Current screen: cetaresearch.com/data-explorer?q=aSKxRdhmZ1
Limitations
Thin pair count. Japan averages 6.3 active pairs when invested. That's a small portfolio. A single bad pair in a down year has an outsized effect. The -7.21% in 2010 came from roughly 5 pairs.
Correlation threshold. We use 0.70, lower than the 0.80 threshold in some academic implementations. This helps Japan stay invested (more qualifying pairs), but it also means some pairs are included with weaker statistical relationships.
Currency. Returns are computed in local currency (JPY). A USD-based investor holding these positions would also face yen exposure. Japan's currency has been volatile over the past decade. Currency-hedged and unhedged versions of this strategy would produce different results for foreign investors.
Data gaps. A few thinly-traded JPX companies may have adjClose discontinuities from corporate actions (mergers, spin-offs, delistings). These can create false divergences that look like z-score entries but don't actually reflect economic pair breakdown.
No short borrow costs. Transaction costs and short borrow fees are not modeled in these results. Adding realistic costs would lower the 0.61% CAGR further, likely into negative territory.
Data: FMP warehouse via Ceta Research (stock_eod + company_profile + financial_ratios, JPX). Results 2005-2024. Next-day close execution (MOC). Nikkei 225 used as local benchmark. This is educational content, not investment advice. Past performance does not guarantee future results.


