
Owner Earnings Yield on Chinese Stocks: 9.6% CAGR, +7.2% vs SSE Composite

Owner Earnings Yield on Chinese Stocks: 9.6% CAGR, +7.2% Over SSE Composite
We screened for stocks with high Owner Earnings yield, strong profitability, and reasonable size across Shanghai (SHH) and Shenzhen (SHZ) exchanges from 2000 to 2025. The strategy returned 9.61% annually vs 2.43% for the SSE Composite. That's +7.18% annual excess over the local benchmark. It was fully invested every single period, always finding 25+ qualifying stocks from China's deep A-share universe. The win rate is 72%, meaning the strategy beat the local index in 18 of 25 years.
Contents
- Method
- What is Owner Earnings?
- The Signal
- The Screen (SQL)
- What We Found
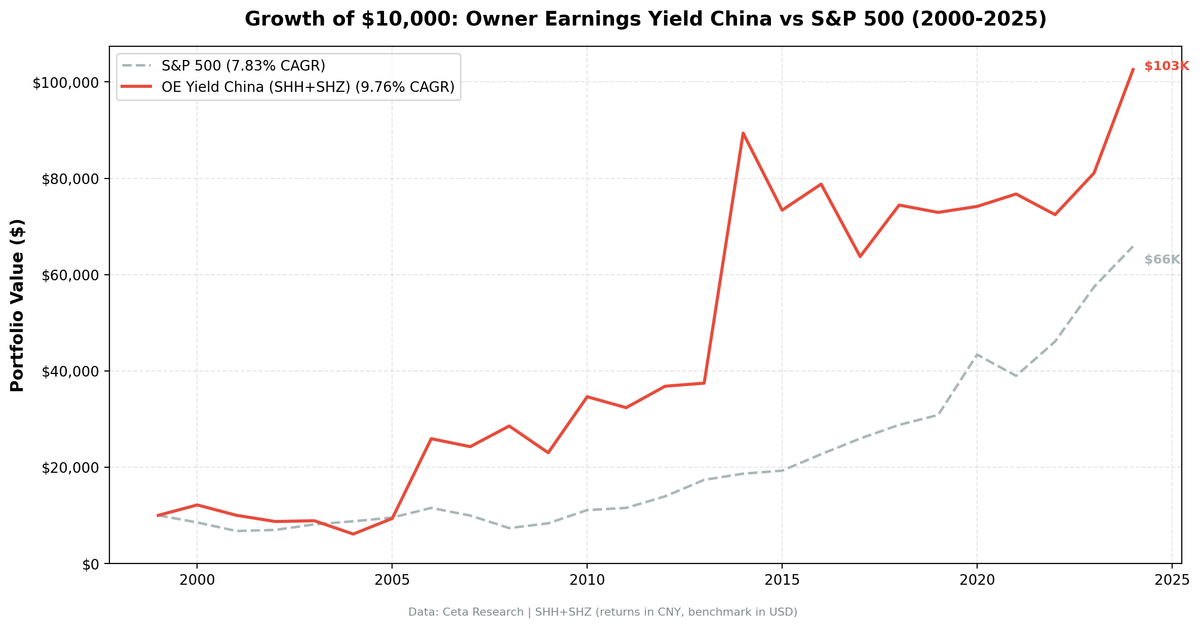
- 25 years of data. +7.18% annual excess over the SSE Composite.
- Year-by-year returns
- The bubble years: 2006 and 2014
- The difficult years: 2004 and 2020
- 72% win rate against the local index
- Amplified moves in both directions
- Backtest Methodology
- Limitations
- Takeaway
- Part of a Series
- References
- Run This Screen Yourself
If you want the US version of this analysis, start here.
Method
Data source: Ceta Research (FMP financial data warehouse) Universe: Shanghai (SHH) + Shenzhen (SHZ), market cap > CNY 2B (~$276M USD) Period: 2000-2025 (25 years, 25 annual periods) Rebalancing: Annual (July, after FY filings + 45-day lag), equal weight top 30 Benchmark: SSE Composite Index (000001.SS) Execution: Next-day close (market-on-close after signal date) Cash rule: Hold cash if fewer than 10 stocks qualify Transaction costs: Size-tiered model (0.1-0.5% one-way based on market cap) Currency: Returns in RMB (matching benchmark)
Owner Earnings computed from raw financial statements at each rebalance: Net Income + D&A - min(|Capex|, D&A). The min() function proxies maintenance capex. If a company spends less on capex than its depreciation, all capex is maintenance. If it spends more, the excess is treated as growth investment and excluded.
What is Owner Earnings?
Warren Buffett introduced Owner Earnings in his 1986 Berkshire Hathaway letter. He wanted a metric that answers one question: what does this business actually earn for its owners?
Owner Earnings = Net Income + D&A - Maintenance Capex
Standard free cash flow deducts all capital expenditure. Every dollar spent building a new factory gets the same treatment as a dollar replacing a broken machine. Owner Earnings only deducts the maintenance portion. It doesn't penalize companies for investing in growth.
OE Yield = Owner Earnings / Market Cap
Higher yield means you're paying less per dollar of owner earnings. We screen for the cheapest stocks on this metric.
For the full explanation of the metric and how it differs from FCF, see our US flagship post.
The Signal
| Filter | Threshold | Rationale |
|---|---|---|
| OE Yield | > 5% | Less than 20x owner earnings |
| OE Yield | < 50% | Removes data artifacts |
| ROE | > 10% | Solid returns on shareholder equity |
| Operating Margin | > 10% | Genuine pricing power |
| Market Cap | > CNY 2B | ~$276M USD. Liquidity filter for A-shares |
Top 30 by highest OE yield, equal weight. Annual rebalance in July (after FY filings become available, with a 45-day lag to prevent look-ahead bias).
The CNY 2B threshold is lower than the $1B USD gate we use for US stocks. Chinese A-shares have a deep mid-cap universe with strong fundamentals. A higher cutoff would exclude too many qualifying companies.
The Screen (SQL)
WITH income_latest AS (
    SELECT symbol, netIncome, depreciationAndAmortization,
        ROW_NUMBER() OVER (PARTITION BY symbol ORDER BY date DESC) AS rn
    FROM income_statement
    WHERE period = 'FY'
      AND netIncome IS NOT NULL
      AND depreciationAndAmortization IS NOT NULL
),
cashflow_latest AS (
    SELECT symbol, capitalExpenditure,
        ROW_NUMBER() OVER (PARTITION BY symbol ORDER BY date DESC) AS rn
    FROM cash_flow_statement
    WHERE period = 'FY'
      AND capitalExpenditure IS NOT NULL
),
calculated AS (
    SELECT
        i.symbol,
        i.netIncome + i.depreciationAndAmortization
            - LEAST(ABS(c.capitalExpenditure), i.depreciationAndAmortization)
            AS owner_earnings
    FROM income_latest i
    JOIN cashflow_latest c ON i.symbol = c.symbol AND c.rn = 1
    WHERE i.rn = 1
)
SELECT
    calc.symbol,
    p.companyName,
    ROUND(calc.owner_earnings / k.marketCap * 100, 2) AS oe_yield_pct,
    ROUND(k.returnOnEquityTTM * 100, 1) AS roe_pct,
    ROUND(f.operatingProfitMarginTTM * 100, 1) AS op_margin_pct,
    ROUND(k.marketCap / 1e9, 1) AS market_cap_billions_cny
FROM calculated calc
JOIN key_metrics_ttm k ON calc.symbol = k.symbol
JOIN financial_ratios_ttm f ON calc.symbol = f.symbol
JOIN profile p ON calc.symbol = p.symbol
WHERE calc.owner_earnings > 0
  AND calc.owner_earnings / k.marketCap > 0.05
  AND calc.owner_earnings / k.marketCap < 0.50
  AND k.returnOnEquityTTM > 0.10
  AND f.operatingProfitMarginTTM > 0.10
  AND k.marketCap > 2e9
  AND p.exchange IN ('SHH', 'SHZ')
ORDER BY calc.owner_earnings / k.marketCap DESC
LIMIT 30
Run this query on Ceta Research
What We Found
25 years of data. +7.18% annual excess over the SSE Composite.
| Metric | OE Yield (China) | SSE Composite |
|---|---|---|
| CAGR | 9.61% | 2.43% |
| Max Drawdown | -50.43% | -52.53% |
| Sharpe Ratio | 0.152 | -0.002 |
| Sortino Ratio | 0.605 | -0.005 |
| Win Rate (annual) | 72% | - |
| Alpha | 7.19% | - |
| Beta | 1.217 | - |
| Up Capture | 133.0% | - |
| Down Capture | 51.9% | - |
| Avg Stocks per Period | 25.7 | - |
| Cash Periods | 0 of 25 | - |
The SSE Composite returned just 2.43% annually over 25 years, with a -52.53% max drawdown. OE Yield's 9.61% CAGR is nearly four times the index return. The strategy was fully invested every single period, never once failing to find 25+ qualifying stocks from the SHH/SHZ universe.
The Sharpe ratio (0.152) is low in absolute terms. But it's measured against the SSE Composite's -0.002. On a risk-adjusted basis, the strategy is in a different category from the local index. The Sortino ratio tells the same story: 0.605 vs -0.005.
The beta of 1.217 means the portfolio moves directionally with the SSE Composite but with amplified swings. Up capture of 133% and down capture of 52% create the asymmetry that drives the excess return.
Year-by-year returns
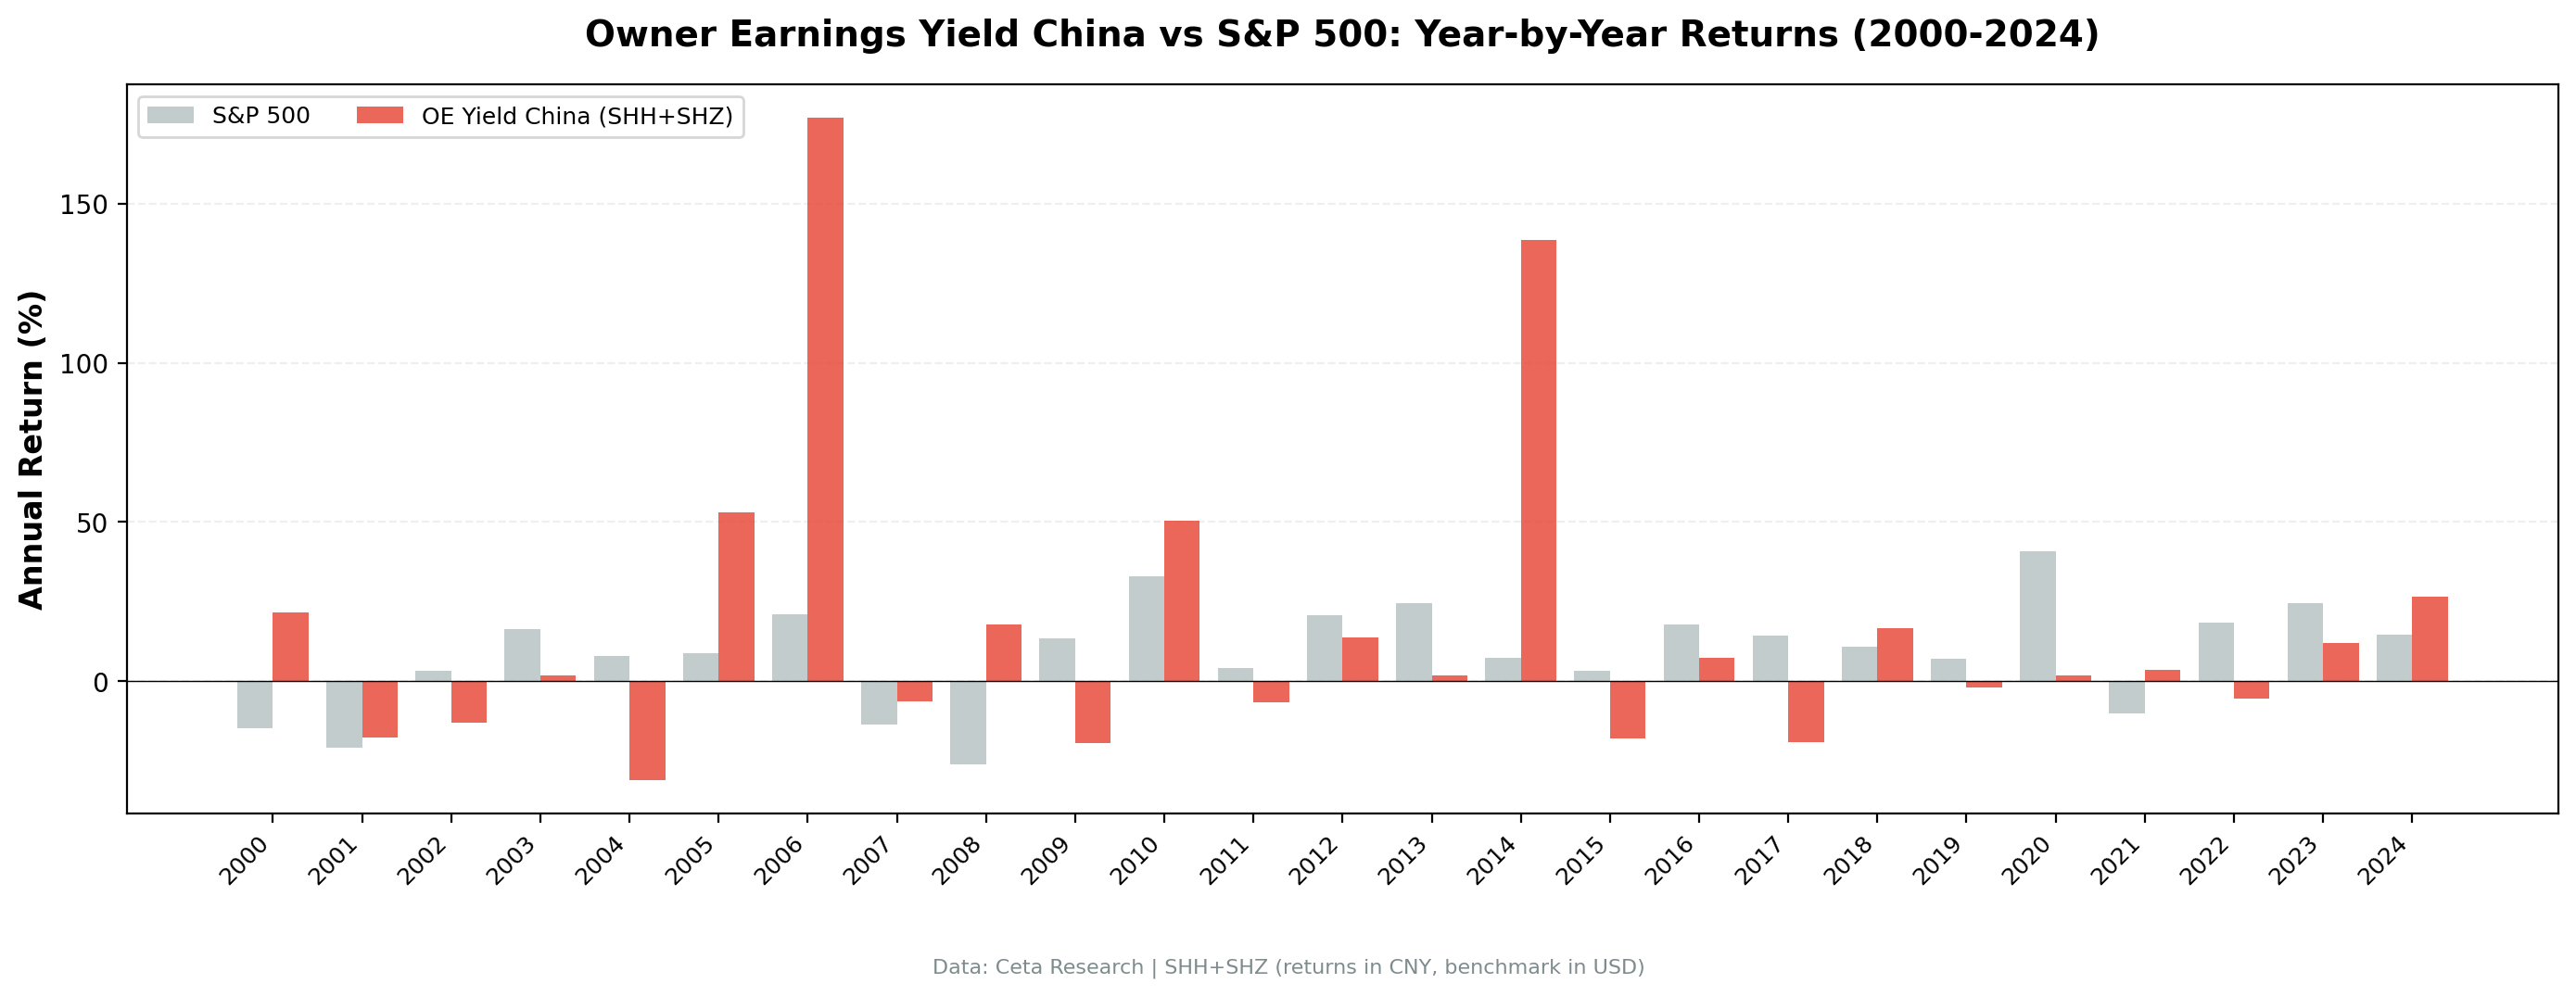
| Year | OE Yield | SSE Composite | Excess |
|---|---|---|---|
| 2000 | +21.6% | +16.4% | +5.2% |
| 2001 | -17.2% | -21.8% | +4.6% |
| 2002 | -12.9% | -13.1% | +0.2% |
| 2003 | +1.2% | -3.9% | +5.1% |
| 2004 | -32.1% | -27.3% | -4.8% |
| 2005 | +53.0% | +62.1% | -9.0% |
| 2006 | +177.0% | +126.0% | +51.0% |
| 2007 | -5.7% | -30.9% | +25.2% |
| 2008 | +17.3% | +15.4% | +1.9% |
| 2009 | -21.9% | -22.1% | +0.2% |
| 2010 | +55.0% | +18.0% | +37.0% |
| 2011 | -8.5% | -20.9% | +12.4% |
| 2012 | +13.0% | -9.9% | +22.9% |
| 2013 | +2.2% | +2.6% | -0.4% |
| 2014 | +128.6% | +90.0% | +38.7% |
| 2015 | -13.7% | -23.6% | +9.9% |
| 2016 | +8.9% | +6.9% | +2.0% |
| 2017 | -19.1% | -13.2% | -5.9% |
| 2018 | +13.7% | +9.7% | +4.0% |
| 2019 | +0.2% | +1.5% | -1.3% |
| 2020 | -2.1% | +13.9% | -15.9% |
| 2021 | +7.0% | -3.2% | +10.2% |
| 2022 | -7.2% | -4.7% | -2.4% |
| 2023 | +11.9% | -7.6% | +19.5% |
| 2024 | +26.8% | +15.3% | +11.5% |
The bubble years: 2006 and 2014
Two years dominate the cumulative return: 2006 (+177.0%) and 2014 (+128.6%). These aren't data artifacts. They correspond to two of the most well-documented bull runs in Chinese market history.
2006 was the pre-Olympic rally. The Shanghai Composite went from roughly 1,200 in mid-2005 to over 6,000 by late 2007. Our July-to-July rebalance captured most of 2006's explosive move. The SSE Composite returned +126.0% that year, but OE Yield added another 51 points on top. Cheap, profitable A-shares with high owner earnings yield were exactly the stocks domestic retail investors piled into during this era.
2014 was the start of the 2014-2015 leveraged bull market. Margin financing expanded rapidly, the government signaled support for equities through "People's Daily" editorials, and the Shanghai Composite doubled in under a year. The SSE Composite returned +90.0%, but OE Yield captured +128.6%, outpacing the index by 38.7 points. Value stocks with strong fundamentals led the charge before speculative names took over in early 2015.
These two years produced the largest absolute excess returns. But the strategy's edge isn't limited to bubble years. It beat the SSE Composite in 18 of 25 years, including many quiet ones. The two-year concentration matters for understanding the magnitude of total return, but the consistency is broader.
The difficult years: 2004 and 2020
2004 was the worst: -32.1% vs the SSE Composite's -27.3%. The A-share market was in a multi-year downturn between 2001 and 2005. Trading volumes collapsed, foreign capital hadn't arrived yet, and domestic investors were burned from the 2001 tech bubble. But the bounce was violent. 2005 returned +53.0% and 2006 returned +177.0%. If you could hold through the pain, the recovery more than compensated.
2020 was the widest single-year underperformance vs the local index: -2.1% while the SSE Composite gained +13.9%. This was a COVID-recovery year dominated by growth stocks and tech names. The OE Yield screen, tilted toward profitable industrials and value names, missed the rally entirely.
72% win rate against the local index
The strategy beat the SSE Composite in 18 of 25 years. That's a strong hit rate for any systematic screen. The losses against the benchmark were usually small (2-6 points), while the wins included several blowout years: +51.0% excess in 2006, +37.0% in 2010, +38.7% in 2014.
The pattern is consistent. In years where the A-share market sells off, OE Yield typically falls less. In years where the market rallies, OE Yield usually rallies more. That asymmetry, driven by the up capture/down capture ratio of 133%/52%, is the engine of the +7.18% annual excess.
Amplified moves in both directions
The beta of 1.217 against the SSE Composite means the portfolio amplifies the index's movements. When the market rallies, OE Yield rallies harder. When the market sells off, OE Yield typically sells off too, but with 52% down capture, the losses are muted relative to the gains.
The 2007 result is the clearest example: OE Yield lost just 5.7% while the SSE Composite dropped 30.9%. In 2011, OE Yield fell 8.5% vs the index's 20.9% decline. The screen's quality filters (ROE > 10%, operating margin > 10%) act as a buffer during sell-offs, steering the portfolio toward companies that are genuinely profitable rather than just cheap.
Backtest Methodology
| Parameter | Choice |
|---|---|
| Universe | SHH + SHZ (Shanghai + Shenzhen), Market Cap > CNY 2B |
| Signal | OE Yield 5-50%, ROE > 10%, OPM > 10% |
| Portfolio | Top 30 by OE Yield, equal weight |
| Rebalancing | Annual (July) |
| Execution | Next-day close (market-on-close after signal date) |
| Cash rule | Hold cash if < 10 qualify |
| Benchmark | SSE Composite Index (000001.SS) |
| Period | 2000-2025 (25 annual periods) |
| Data | Point-in-time (45-day lag for FY filings) |
| Transaction costs | Size-tiered (0.1-0.5% one-way by market cap) |
Full methodology details: backtests/METHODOLOGY.md
Limitations
Max drawdown of -50.43%. Only slightly better than the SSE Composite's -52.53%. The strategy doesn't protect you in a crash. A-share sell-offs are violent, and OE Yield participates in them. The Sharpe ratio of 0.152 is low in absolute terms, even if it dwarfs the index.
Two-year concentration. 2006 and 2014 account for a disproportionate share of the total return. If future A-share bubbles are smaller or less frequent, the long-term CAGR will be lower. The strategy benefits from periodic episodes of market euphoria, where it outpaces the index by the widest margins.
Survivorship bias. Exchange membership uses current company profiles. Delisted companies, which are less common in China due to regulatory barriers, aren't fully captured in the historical universe.
Annual rebalancing only. A-share momentum can shift rapidly. Annual rebalancing misses intra-year reversals and may not capture the timing of bubble formations optimally.
Regulatory risk. China's equity markets are subject to trading halts, short-selling restrictions, and policy interventions that don't exist in US markets. These structural features can amplify drawdowns and create liquidity traps.
Takeaway
OE Yield works on Chinese A-shares. 9.61% CAGR vs 2.43% for the SSE Composite, +7.18% annual excess, 72% win rate. The strategy never ran to cash, always finding 25+ qualifying stocks from the deep SHH/SHZ universe.
The edge here is structural. China's A-share market is retail-driven, sentiment-heavy, and prone to dramatic boom-bust cycles. A systematic value screen benefits from that pattern because cheap stocks with strong fundamentals get swept up in every rally and hold up better in downturns. The 133% up capture and 52% down capture tell the story.
The cost is clear: drawdowns approach 50%, and the absolute Sharpe of 0.152 is still low. But the SSE Composite's own max drawdown was -52.53% with a Sharpe of -0.002. The choice isn't between OE Yield and a smooth ride. It's between OE Yield and a local index that returned 2.43% annually over 25 years. On that basis, the screen adds substantial value.
Part of a Series
This analysis is part of our Owner Earnings Yield global exchange comparison. We tested the same screen on 13 exchanges worldwide: - OE Yield on US Stocks (NYSE + NASDAQ + AMEX) - 12.3% CAGR, the flagship analysis - OE Yield on Indian Stocks (BSE + NSE) - 17.2% CAGR, +5.1% vs Sensex - OE Yield on Hong Kong Stocks (HKSE) - 10.4% CAGR, +8.8% vs Hang Seng - OE Yield on Swedish Stocks (STO) - 9.6% CAGR, +7.0% vs OMX Stockholm 30 - OE Yield: 13-Exchange Global Comparison - full comparison table
References
- Buffett, W. (1986). "Berkshire Hathaway Annual Letter to Shareholders."
- Greenwald, B., Kahn, J., Sonkin, P. & van Biema, M. (2001). Value Investing: From Graham to Buffett and Beyond. John Wiley & Sons.
- Greenblatt, J. (2006). The Little Book That Beats the Market. John Wiley & Sons.
Run This Screen Yourself
Via web UI: Run the Owner Earnings Yield screen on Ceta Research. The query is pre-loaded. Hit "Run" and see what passes today.
Via Python:
import requests, time

API_KEY = "your_api_key"  # get one at cetaresearch.com
BASE = "https://tradingstudio.finance/api/v1"

resp = requests.post(f"{BASE}/data-explorer/execute", headers={
    "X-API-Key": API_KEY, "Content-Type": "application/json"
}, json={
    "query": """
        WITH income_latest AS (
            SELECT symbol, netIncome, depreciationAndAmortization,
                ROW_NUMBER() OVER (PARTITION BY symbol ORDER BY date DESC) AS rn
            FROM income_statement WHERE period = 'FY'
              AND netIncome IS NOT NULL AND depreciationAndAmortization IS NOT NULL
        ),
        cashflow_latest AS (
            SELECT symbol, capitalExpenditure,
                ROW_NUMBER() OVER (PARTITION BY symbol ORDER BY date DESC) AS rn
            FROM cash_flow_statement WHERE period = 'FY' AND capitalExpenditure IS NOT NULL
        ),
        calculated AS (
            SELECT i.symbol,
                i.netIncome + i.depreciationAndAmortization
                    - LEAST(ABS(c.capitalExpenditure), i.depreciationAndAmortization) AS owner_earnings
            FROM income_latest i JOIN cashflow_latest c ON i.symbol = c.symbol AND c.rn = 1
            WHERE i.rn = 1
        )
        SELECT calc.symbol, p.companyName,
            ROUND(calc.owner_earnings / k.marketCap * 100, 2) AS oe_yield_pct,
            ROUND(k.returnOnEquityTTM * 100, 1) AS roe_pct,
            ROUND(f.operatingProfitMarginTTM * 100, 1) AS op_margin_pct,
            ROUND(k.marketCap / 1e9, 1) AS market_cap_billions_cny
        FROM calculated calc
        JOIN key_metrics_ttm k ON calc.symbol = k.symbol
        JOIN financial_ratios_ttm f ON calc.symbol = f.symbol
        JOIN profile p ON calc.symbol = p.symbol
        WHERE calc.owner_earnings > 0
          AND calc.owner_earnings / k.marketCap > 0.05
          AND calc.owner_earnings / k.marketCap < 0.50
          AND k.returnOnEquityTTM > 0.10
          AND f.operatingProfitMarginTTM > 0.10
          AND k.marketCap > 2e9
          AND p.exchange IN ('SHH', 'SHZ')
        ORDER BY calc.owner_earnings / k.marketCap DESC
        LIMIT 30
    """,
    "options": {"format": "json", "limit": 100}
})
task_id = resp.json()["taskId"]

while True:
    result = requests.get(f"{BASE}/tasks/data-query/{task_id}",
                          headers={"X-API-Key": API_KEY}).json()
    if result["status"] in ("completed", "failed"):
        break
    time.sleep(2)

for r in result["result"]["rows"][:10]:
    print(f"{r['symbol']:8s} OE Yield={r['oe_yield_pct']}% ROE={r['roe_pct']}% MCap=CNY{r['market_cap_billions_cny']}B")
Get your API key at cetaresearch.com. The full backtest code (Python + DuckDB) is on GitHub.
Data: Ceta Research, FMP financial data warehouse. Universe: SHH + SHZ (Shanghai + Shenzhen). Benchmark: SSE Composite Index. Annual rebalance (July), equal weight top 30, 2000-2025. Next-day close execution. Transaction costs included. Returns in RMB.


