
Oversold Quality Germany: Beats DAX with the Best Risk-Adjusted Returns in the Series (2000-2025)
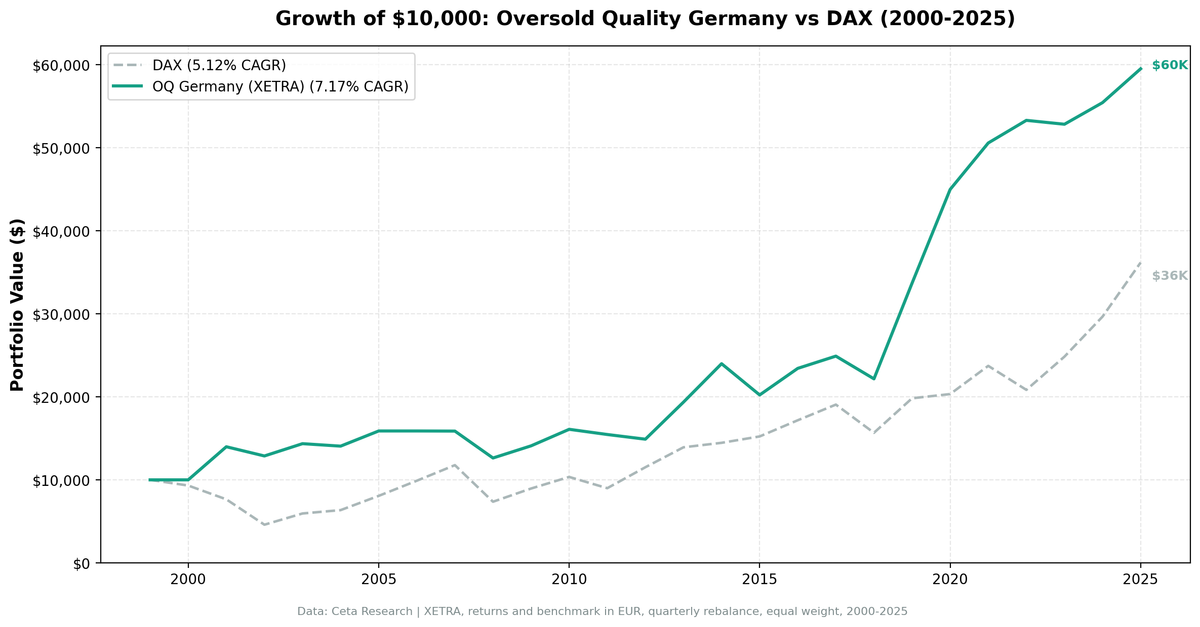
Oversold Quality on German XETRA stocks: 7.17% CAGR, +2.05% above the DAX, Sharpe 0.308, and a 29% down-capture. The best risk-adjusted result in our 18-exchange series, with a max drawdown less than half the DAX's. The 39% cash rate is the honest caveat.

title: "Oversold Quality Germany: Beats DAX with the Best Risk-Adjusted Returns in the Series (2000-2025)" slug: oversold-quality-germany-backtest publish_date: 2026-01-24 tags: [backtests, german-markets, quality-investing, RSI, XETRA, risk-adjusted-returns] post_access: public excerpt: "Oversold Quality on German XETRA stocks: 7.17% CAGR, +2.05% above the DAX, Sharpe 0.308, and a 29% down-capture. The best risk-adjusted result in our 18-exchange series, with a max drawdown less than half the DAX's. The 39% cash rate is the honest caveat." authors: [Swas] feature_image: 1_germany_cumulative_growth.png feature_image_alt: "Growth of 10,000: Oversold Quality Germany vs DAX (2000-2025)" meta_title: "Oversold Quality Germany Backtest: Piotroski + RSI < 30 on XETRA" meta_description: "25-year backtest on German XETRA stocks. 7.17% CAGR vs DAX 5.12%, Sharpe 0.308 (best in series), 29% down-capture, max drawdown -28% vs the DAX's -65%." canonical_url: https://blog.tradingstudio.finance/oversold-quality-germany-backtest og_title: "Oversold Quality Germany: +2.05% Above DAX, Sharpe 0.308 (2000-2025)" og_description: "German quality stocks + RSI oversold beats the DAX by +2.05% over 25 years. Best Sharpe in the series (0.308), 29% down-capture, half the drawdown. 39% cash rate is the caveat." twitter_title: "Oversold Quality Germany: Beats DAX, Best Sharpe in the Series (0.308)" twitter_description: "7.17% CAGR on XETRA vs DAX's 5.12%. +2.05% excess, Sharpe 0.308, 29% down-capture, -28% max drawdown vs the DAX's -65%."
Contents
- Portfolio Summary
- The Strategy
- The 39% Cash Rate: Feature or Bug?
- Annual Returns
- The Standout Years
- Why the Risk Profile is Different
- Screener: Current XETRA Quality Stocks
- Limitations
- Part of a Series
Data: FMP financial data warehouse, 2000–2025. Updated March 2026.
Germany produced the best risk-adjusted result in our 18-exchange series. The strategy returned 7.17% CAGR against the DAX's 5.12%, a +2.05% annual excess. Sharpe ratio of 0.308, down-capture of 29.1%, volatility of 16.79%, and a maximum drawdown of -28.0% against the DAX's -65.2%. On every metric that measures how well the portfolio managed risk, XETRA came out on top.
There's a caveat that belongs in the first paragraph, not buried at the end: in 40 of 103 quarters tested, this portfolio held cash. That's 39% of the time. If fewer than 5 XETRA stocks simultaneously had a Piotroski F-Score of 7 or higher and an RSI below 30, the portfolio didn't invest. It waited. That's a real cost, and we'll address it directly.

Portfolio Summary
| Metric | Value |
|---|---|
| Exchange | XETRA (Germany) |
| Period | Jan 2000 to Dec 2025 (25.8 years, 103 quarters) |
| CAGR | 7.17% |
| DAX CAGR | 5.12% |
| Excess CAGR vs DAX | +2.05% |
| Total Return | 495.0% |
| DAX Total Return | 261.8% |
| Max Drawdown | -28.0% |
| DAX Max Drawdown | -65.2% |
| Sharpe Ratio | 0.308 |
| Volatility | 16.79% |
| Up-Capture vs DAX | 57.8% |
| Down-Capture vs DAX | 29.1% |
| Win Rate vs DAX | 52.4% |
| Cash Periods | 40/103 (39%) |
| Avg Stocks When Invested | 13.6 |
The Strategy
Oversold Quality combines two independent filters. The first is the Piotroski F-Score, a nine-point accounting quality screen that evaluates profitability (positive ROA, positive operating cash flow, improving ROA, cash-based earnings), leverage (falling debt-to-assets, improving current ratio, no share dilution), and operating efficiency (improving gross margin, improving asset turnover). A score of 7 or higher means the company passes at least 7 of 9 criteria. These are financially healthy companies.
The second filter is the RSI-14 (Relative Strength Index over 14 periods). An RSI below 30 means the stock has dropped sharply and is in oversold territory. The combination targets companies that are fundamentally strong but have been beaten down in price, which is the classic setup for mean reversion.
Portfolios rebalance quarterly. Each quarter, we screen for XETRA stocks with Piotroski >= 7 and RSI < 30. If 5 or more qualify, we hold them in equal weight for the quarter. If fewer than 5 qualify, the portfolio holds cash until the next rebalance.
The benchmark for Germany is the DAX (Deutsche Aktienindex), Germany's primary blue-chip index. Using a local-currency benchmark rather than SPY gives a cleaner picture of whether the strategy adds value relative to what a German investor could otherwise hold passively.
For the full methodology, see our US flagship post.
The 39% Cash Rate: Feature or Bug?
This is the central question for any reader considering this strategy.
In 39% of quarters, the portfolio couldn't find 5 qualifying stocks and held cash instead. During long stretches of that 39%, German equities were rallying. Holding cash cost real returns.
But look at when the cash periods cluster. In 2000, the portfolio was fully in cash. XETRA, like most global markets, was in the tail end of a technology bubble where quality growth stocks had RSI readings well above 30. In 2006, another extended cash period, Germany was in a sustained bull market. Quality blue chips had rising RSIs. The strategy correctly identified that there were no genuine deep-value opportunities and stepped aside.
The 2019, 2020, and 2022 results reinforce the framing. In 2019, the portfolio returned +51.97% against the DAX's +26.52%, a 25.45% excess. In 2020, +33.52% vs the DAX's +2.55%, a 30.97% excess. In 2022, when the DAX fell -12.18%, the portfolio returned +5.39%, a 17.57% excess return in a down year. These are the quarters when fear drove quality German stocks to RSI < 30, and the strategy deployed into genuinely distressed but fundamentally sound companies.
The counterargument is honest. When the portfolio is in cash, you're earning near-zero returns while equities compound. From 2003 through 2007, Germany had a strong equity run, and extended cash periods in those years produced drag that shows up as a -17.92% excess in 2003 and -19.07% in 2007. Over a full cycle, the cost of selectivity is real.
The honest framing: the strategy is designed to fire only when two independent signals align. RSI < 30 doesn't happen to quality stocks in normal markets. It happens during European debt crises, global selloffs, sector rotations, and moments of genuine fear. In those moments, German quality companies have historically recovered. The 39% cash rate reflects how often those moments actually occurred.
Investors need to decide whether that selectivity appeals to them. Some find it disciplined. Others find it frustrating.
Annual Returns
| Year | Portfolio | DAX | Excess |
|---|---|---|---|
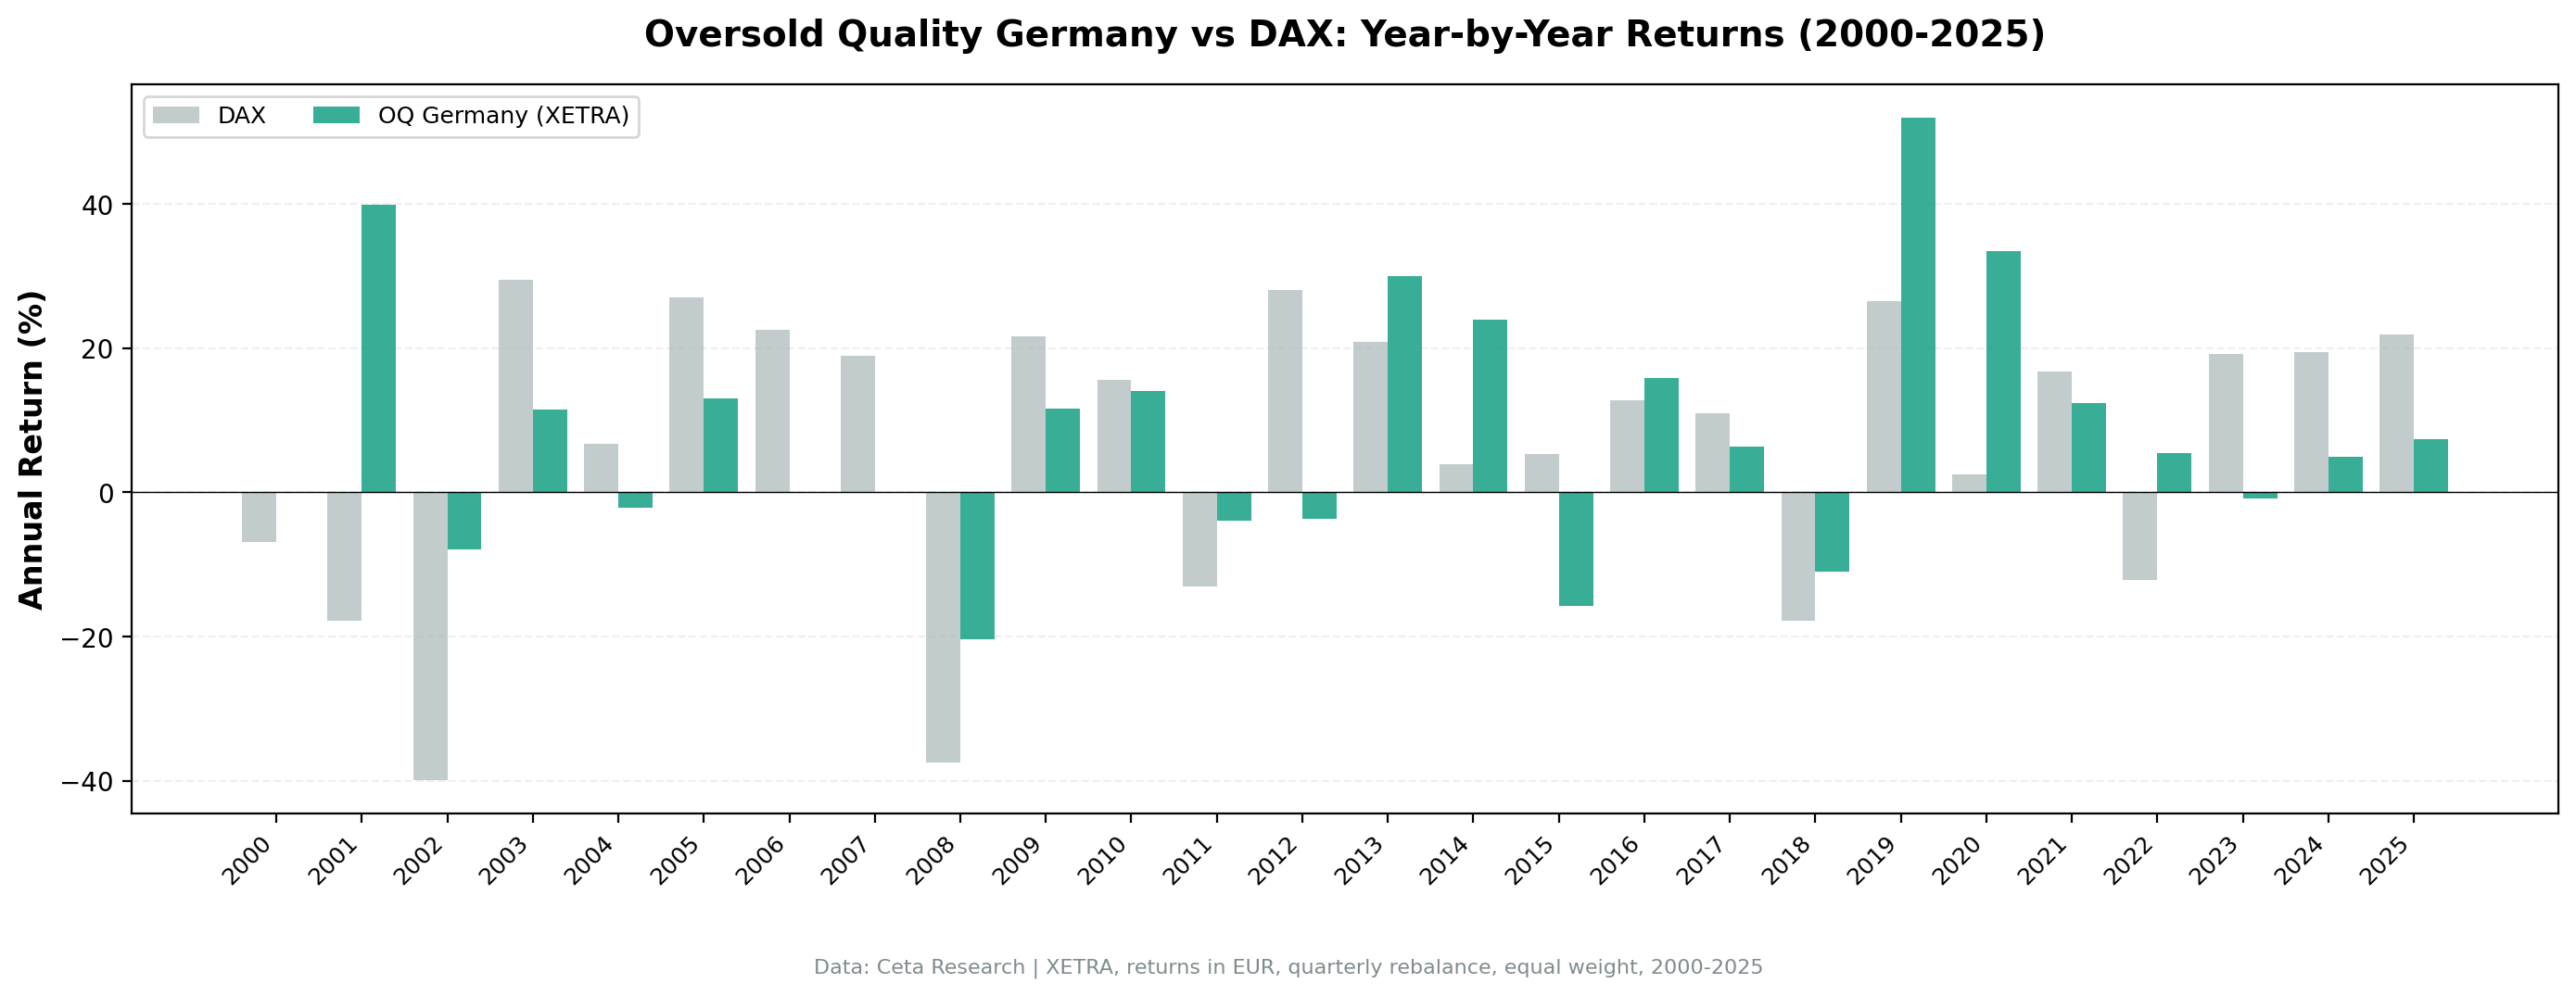
| 2000 | 0.00% | -6.83% | +6.83% |
| 2001 | +39.88% | -17.84% | +57.72% |
| 2002 | -7.94% | -39.92% | +31.98% |
| 2003 | +11.50% | +29.42% | -17.92% |
| 2004 | -2.07% | +6.79% | -8.87% |
| 2005 | +12.99% | +26.99% | -14.00% |
| 2006 | 0.00% | +22.59% | -22.59% |
| 2007 | -0.09% | +18.98% | -19.07% |
| 2008 | -20.42% | -37.44% | +17.01% |
| 2009 | +11.60% | +21.62% | -10.02% |
| 2010 | +14.12% | +15.57% | -1.45% |
| 2011 | -3.89% | -13.08% | +9.19% |
| 2012 | -3.65% | +28.03% | -31.69% |
| 2013 | +29.96% | +20.84% | +9.12% |
| 2014 | +23.90% | +3.88% | +20.02% |
| 2015 | -15.69% | +5.31% | -21.00% |
| 2016 | +15.84% | +12.79% | +3.05% |
| 2017 | +6.29% | +10.98% | -4.69% |
| 2018 | -10.99% | -17.80% | +6.81% |
| 2019 | +51.97% | +26.52% | +25.45% |
| 2020 | +33.52% | +2.55% | +30.97% |
| 2021 | +12.44% | +16.71% | -4.27% |
| 2022 | +5.39% | -12.18% | +17.57% |
| 2023 | -0.88% | +19.19% | -20.08% |
| 2024 | +4.93% | +19.41% | -14.49% |
| 2025 | +7.35% | +21.96% | -14.61% |
The Standout Years
2001 and 2002 are where the strategy earned its risk-adjusted edge. As the DAX fell -17.84% then -39.92% through the dotcom unwind, the portfolio returned +39.88% then -7.94%. That's a +57.72% and +31.98% excess in two consecutive crash years. Quality German industrials and exporters that had been sold off indiscriminately kept paying off while the index full of overvalued tech kept falling.
2019 and 2020 form a coherent pair. In late 2018 and early 2019, trade war fears and rate hike concerns pushed quality XETRA stocks to RSI < 30. The 2019 recovery was sharp: +51.97% vs the DAX's +26.52%, a 25.45% excess. Then in Q1 2020, COVID crashed markets globally and drove RSI readings below 30 on genuinely excellent German manufacturers and exporters. The 2020 result of +33.52% came from buying those companies at panic prices in March and holding through the recovery, against the DAX's +2.55%.
2022 shows the defensive character. The DAX fell -12.18%. The portfolio returned +5.39%, a 17.57% excess. The combination of quality companies and oversold entry conditions meant the portfolio was in names that had already corrected before the broader market declined, providing a natural cushion.
The cost shows up in calm bull years. 2012 (-31.69% excess), 2023 (-20.08%), and 2015 (-21.00%) were the worst relative years. In each, the DAX ground steadily higher while quality German stocks rarely touched RSI < 30, so the portfolio sat in cash or held a thin set of positions that lagged.
Why the Risk Profile is Different
The 16.79% annualized volatility is the lowest of any exchange where this strategy is worth discussing. That's not an accident. XETRA quality companies filtered at Piotroski >= 7 tend to be industrials, chemicals, and mid-cap manufacturers with stable cash flows. They're not momentum stocks. When they do get oversold, they don't move with the violent beta of tech or biotech.
The 29.1% down-capture means that when the DAX fell by 10%, this portfolio typically fell by about 2.9%. Over 25 years with multiple bear markets, that difference compounds. It's the single biggest reason a portfolio with a +2.05% CAGR edge produces a Sharpe ratio more than double the DAX's: the maximum drawdown was -28.0% against the index's -65.2%, so the portfolio never had to dig out of the same holes.
The up-capture of 57.8% is the honest cost. The portfolio captures about 58% of the DAX's gains in good years. That asymmetry (58% of upside, 29% of downside) is what the 39% cash rate buys. Over a full cycle, the selective deployment works, and on a risk-adjusted basis it works better here than anywhere else in the series.
Screener: Current XETRA Quality Stocks
The query below identifies XETRA stocks that pass the quality half of this screen right now. RSI filtering requires real-time price data and isn't included here.
SELECT
    k.symbol,
    p.companyName,
    ROUND(k.returnOnAssetsTTM * 100, 1) AS roa_pct,
    ROUND(k.returnOnEquityTTM * 100, 1) AS roe_pct,
    ROUND(k.incomeQualityTTM, 2) AS income_quality,
    ROUND(k.currentRatioTTM, 2) AS current_ratio,
    ROUND(k.netDebtToEBITDATTM, 2) AS net_debt_ebitda,
    ROUND(k.marketCap / 1e9, 2) AS mktcap_b
FROM key_metrics_ttm k
JOIN profile p ON k.symbol = p.symbol
WHERE k.returnOnAssetsTTM > 0
  AND k.returnOnEquityTTM > 0.10
  AND k.incomeQualityTTM > 1.0
  AND k.currentRatioTTM > 1.0
  AND k.netDebtToEBITDATTM BETWEEN -10 AND 3.0
  AND k.marketCap > 500000000  -- €500M+ for Germany
  AND p.exchange IN ('XETRA')
ORDER BY k.symbol
Run this on the Ceta Research Data Explorer.
Limitations
This backtest uses point-in-time Piotroski scoring based on the most recent annual filings available at each rebalance date, with a 45-day filing lag. Look-ahead bias is a risk in any backtest, and while we apply reasonable safeguards, results from the 2000-2005 period (when XETRA had fewer reporting standards in our database) should be interpreted with more caution than later periods.
The RSI threshold of 30 is strict. Looser thresholds (RSI < 40, RSI < 45) would increase invested periods and potentially improve absolute CAGR, but would capture stocks that aren't genuinely in stress territory. The 39% cash rate is a direct consequence of applying a disciplined threshold rather than a relaxed one.
Raw end-of-day price data carries occasional bad rows, single-day adjusted-close values that spike and revert. We filter these before computing returns. An earlier, uncorrected version of this backtest reported a +0.33% excess and a -47% drawdown for Germany; removing the price artifacts is what moved the result to +2.05% excess and a -28% drawdown. The corrected numbers are the ones above.
Transaction costs are estimated at 0.1% per trade each way. Quarterly rebalancing with an average of 13.6 stocks per period means moderate turnover. Actual costs depend on broker and position size.
Part of a Series
This is one post in our global Oversold Quality series:
- Oversold Quality US: Full Strategy Explanation and Results (flagship)
- Oversold Quality China: Beats SSE Composite by +3.02%
- Oversold Quality Global: 18 Exchanges Compared
Data: FMP warehouse, 2000-2025. Backtest framework: ceta-research/backtests. TTM metrics as of backtest run date.
Past performance does not guarantee future results. This is educational content, not investment advice.


