
Net Debt/EBITDA Below 2x: What 25 Years of US Data Actually Shows


Private equity firms live by the Net Debt/EBITDA ratio. Under 2x means a company can repay its debt in two years of operating earnings. It's the first filter PE analysts run when sizing up an acquisition. We tested whether that same logic translates to public equity alpha on the full US market, 25 years, 22,000+ companies, quarterly rebalancing. The result is honest, and worth understanding.
Contents
- Method
- What We Found
- Year-by-Year
- Why the Signal Fails on the Full US Market
- When It Works
- Run It Yourself
- Limitations
Method
Signal: Net Debt/EBITDA < 2x and > -5x (excludes extreme net-cash anomalies), ROE > 10%, Market Cap > $1B. Top 30 stocks by lowest ratio, equal weight. Universe: Full US market, NYSE, NASDAQ, AMEX (~22,000 symbols with financial data). Not S&P 500 constrained. Period: 2000-2025 (103 quarterly periods). Rebalancing: Quarterly (January, April, July, October). 45-day filing lag for point-in-time data. Execution: Market-on-close next trading day (signal generated at close, executed at next close). Transaction costs: Size-tiered model applied. Larger positions pay less per trade. Benchmark: S&P 500 (SPY). Data: Ceta Research (FMP financial data warehouse).
Net Debt = Total Debt minus Cash and Cash Equivalents. Negative values mean net-cash positions. We exclude below -5x to avoid companies where the ratio is distorted by extreme cash hoards or near-zero EBITDA.
What We Found
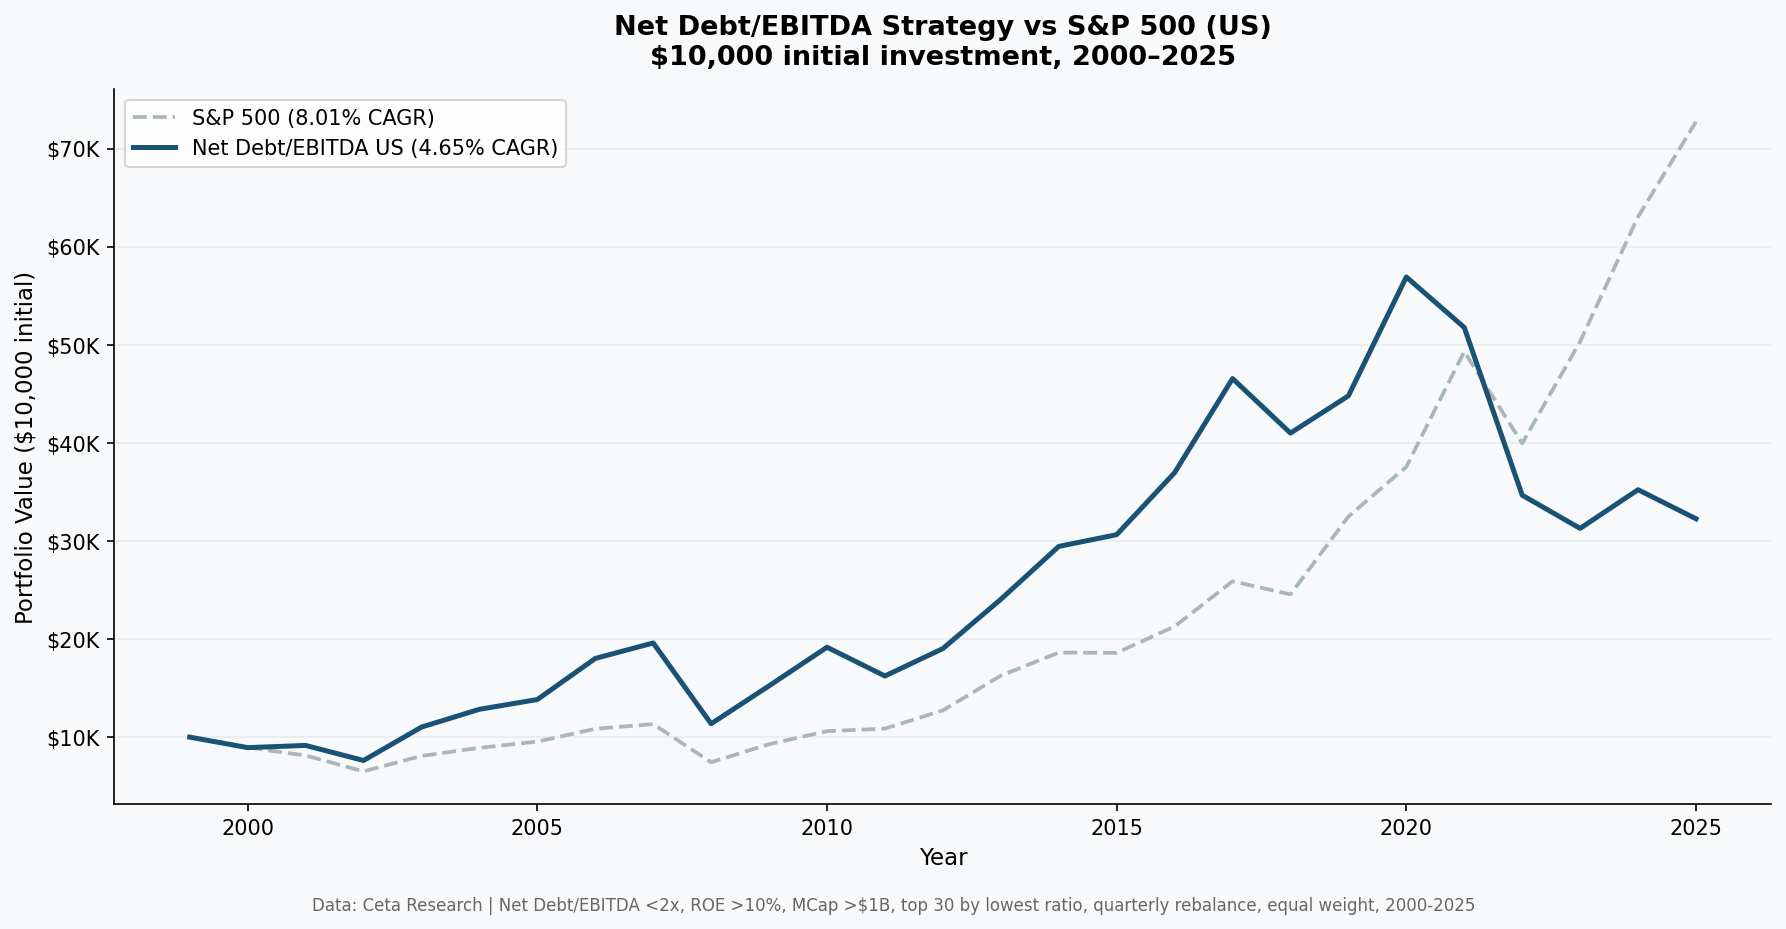
The low Net Debt/EBITDA strategy underperformed the S&P 500 on the full US market over 25 years.
Strategy: 5.13% CAGR. SPY: 8.02% CAGR. Excess return: -2.89% per year.
A $10,000 investment grew to $36,243. The same money in SPY grew to $72,829.
| Metric | Strategy | S&P 500 |
|---|---|---|
| CAGR | 5.13% | 8.02% |
| Total Return | 262.4% | 628.3% |
| Max Drawdown | -55.3% | -43.9% |
| Annualized Volatility | 25.4% | 16.7% |
| Sharpe Ratio | 0.123 | 0.361 |
| Beta | 1.244 | 1.0 |
| Alpha (annualized) | -4.36% | — |
| Up Capture | 120.0% | — |
| Down Capture | 149.6% | — |
The up/down capture is the key problem: this portfolio participated in 120% of SPY's gains but absorbed 150% of its losses. High beta with negative alpha. That combination is the worst risk profile a strategy can have.
Year-by-Year
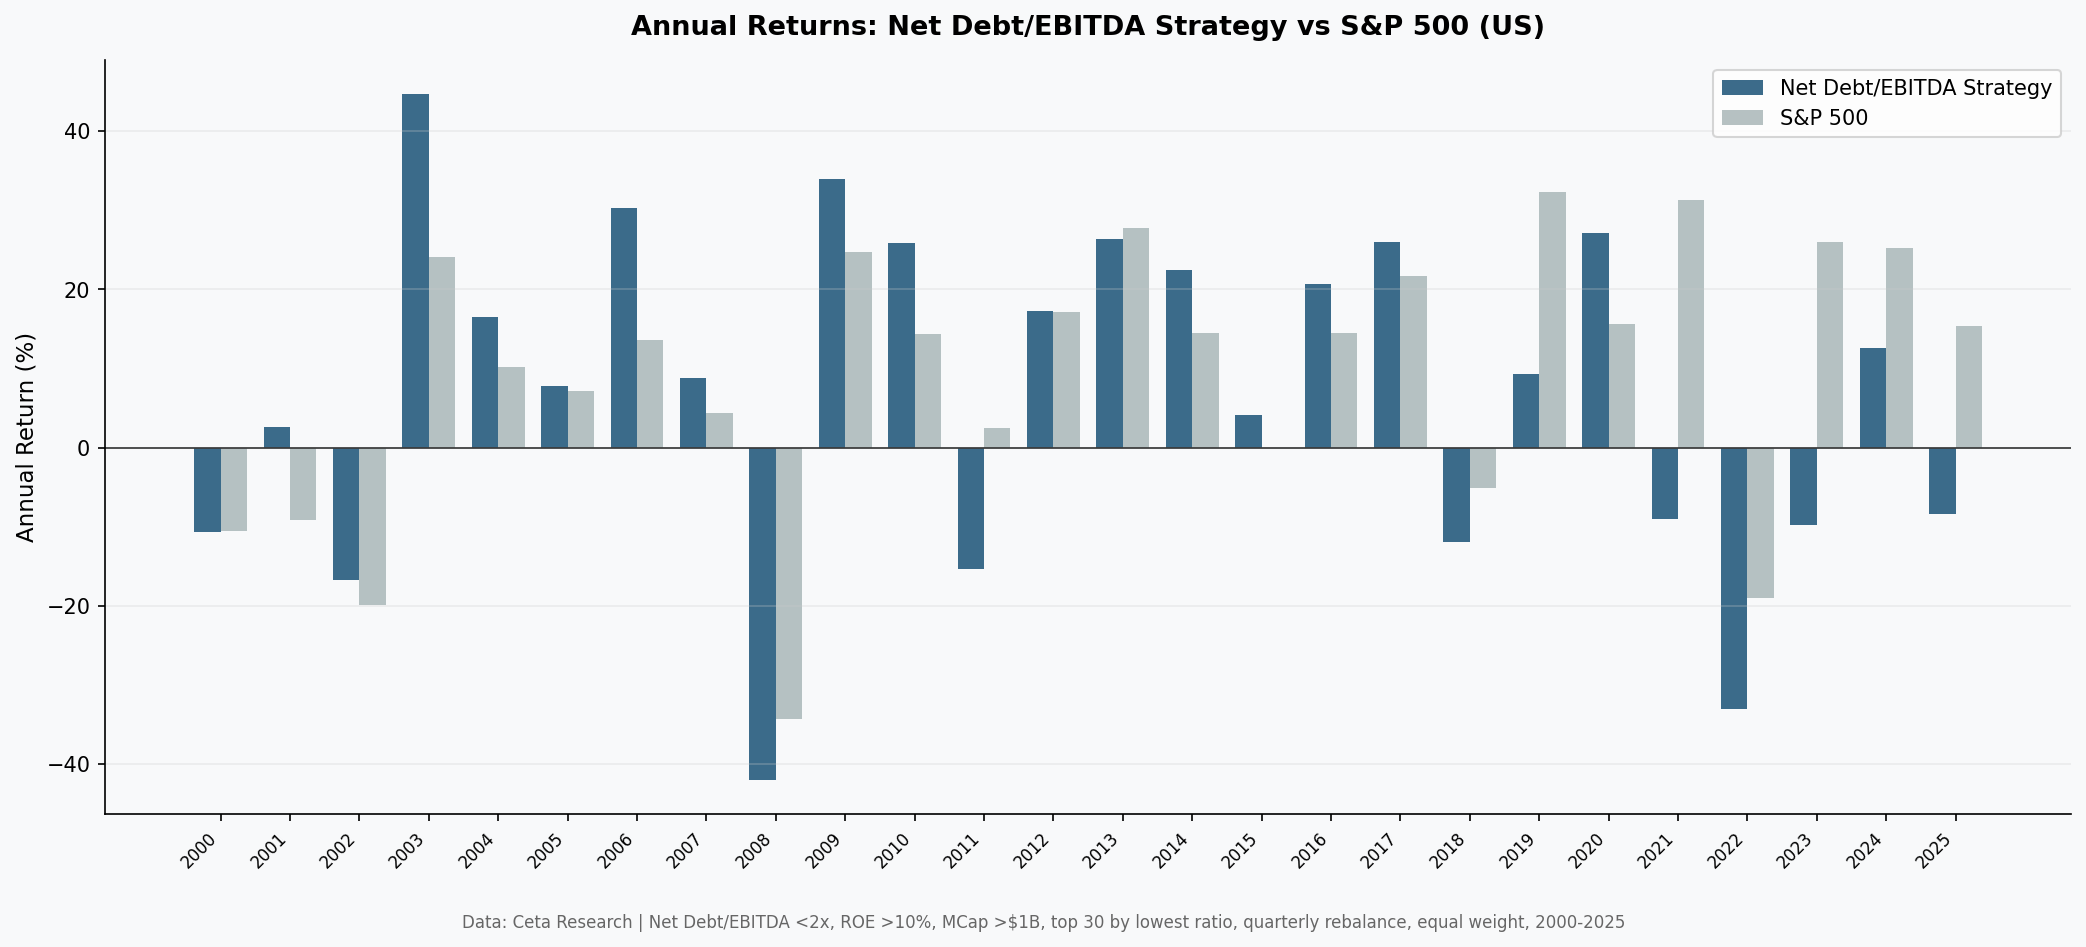
The early 2000s looked promising. The strategy outperformed during the dot-com bust (many of the surviving cash-heavy companies fit the screen well) and again in the 2009 recovery. Then the picture changed.
| Year | Strategy | SPY | Excess |
|---|---|---|---|
| 2000 | -10.7% | -10.5% | -0.2% |
| 2001 | +1.4% | -9.2% | +10.5% |
| 2002 | -16.3% | -19.9% | +3.6% |
| 2003 | +44.8% | +24.1% | +20.7% |
| 2006 | +30.2% | +13.7% | +16.6% |
| 2008 | -41.7% | -34.3% | -7.4% |
| 2009 | +33.5% | +24.7% | +8.8% |
| 2019 | +9.8% | +32.3% | -22.6% |
| 2021 | -6.9% | +31.3% | -38.1% |
| 2022 | -32.3% | -19.0% | -13.3% |
| 2023 | -8.0% | +26.0% | -34.0% |
The losses in 2019, 2021, and 2023 are what erased the early-period advantage. These are not market crashes: the broader market was positive in all three years. The strategy missed the FAANG/mega-cap tech rally that drove SPY's outperformance in the 2010s and early 2020s.
Why the Signal Fails on the Full US Market
The PE firm logic is sound. Low debt with strong earnings means financial resilience. So why doesn't it translate to alpha?
The S&P 500 is not the full market. When PE firms apply this filter to S&P 500-quality companies, they're already working inside a pre-screened universe of large, profitable businesses. The "low Net Debt/EBITDA" filter then picks the best among the already-good.
On the full US market with 22,000+ companies, "Net Debt/EBITDA < 2x, ROE > 10%, Market Cap > $1B" selects a different group entirely: profitable mid-cap companies with conservative capital structures. Many are in healthcare, consumer staples, and industrials. Few are in the high-growth tech sector that has driven US equity returns since 2015.
Amazon, Google, Meta, and Nvidia, the companies that dominated SPY returns in the 2010s and 2020s, don't score particularly well on this screen. They either carry significant debt relative to EBITDA (Meta, Amazon at various points) or have business models where the ratio is less meaningful (Nvidia's capex-light model pushes net debt to near zero, but the company's exceptional returns come from pricing power, not balance sheet conservatism).
The filter also selects for companies that don't need leverage to grow. In a prolonged low-interest-rate environment (2010-2021), the ability to access cheap debt was a feature, not a bug. Companies that avoided borrowing missed the tailwind of low-cost capital deployment.
Result: The strategy acts as a quality/value tilt. It tends to hold companies that look like textbook good businesses: moderate leverage, consistent earnings, stable sectors. Those companies have done fine, just not as well as SPY, which has been increasingly concentrated in high-growth technology.
When It Works
The early 2000s show what this strategy is designed for. In 2001 and 2002, when over-leveraged dot-com companies collapsed, low-debt companies held up. The strategy returned +1.4% in 2001 (SPY: -9.2%) and -16.3% in 2002 vs SPY's -19.9%.
It also showed up in 2008, but only relatively. The strategy fell 41.7% vs SPY's 34.3%. Leverage protects against credit events, but the 2008 crash hit equity prices broadly regardless of debt levels.
The clearest statement of the strategy's character: it's a defensive tilt that provides modest downside protection in pure credit crises, but lags significantly in momentum-driven bull markets dominated by growth names.
Run It Yourself
Current qualifying stocks (US, TTM data):
SELECT
    k.symbol,
    p.companyName,
    ROUND(k.netDebtToEBITDATTM, 2)      AS net_debt_ebitda,
    ROUND(k.returnOnEquityTTM * 100, 1) AS roe_pct,
    ROUND(k.marketCap / 1e9, 1)         AS mktcap_bn
FROM key_metrics_ttm k
JOIN profile p ON k.symbol = p.symbol
WHERE k.netDebtToEBITDATTM < 2.0
  AND k.netDebtToEBITDATTM > -5.0
  AND k.returnOnEquityTTM > 0.10
  AND k.marketCap > 1000000000
  AND p.exchange IN ('NYSE', 'NASDAQ', 'AMEX')
ORDER BY k.netDebtToEBITDATTM ASC
LIMIT 30
Run this query on Ceta Research
Full backtest code:
cd backtests
python3 net-debt-ebitda/backtest.py --preset us --verbose
Limitations
This is a single-factor screen. Net Debt/EBITDA in isolation doesn't capture growth rate, management quality, competitive positioning, or capital allocation skill. It screens for financial conservatism, not business quality.
The full-market universe is different from an institutional universe. Private equity applies this filter to deal-sized companies with operational due diligence. A public equity screen at the same threshold lands in a different segment of the market.
Transaction costs matter. Quarterly rebalancing of 30 equal-weight positions is not cheap. The results shown include realistic transaction costs. Without them, the picture would be slightly better, but the excess vs SPY would still be negative.
The benchmark is not comparable. SPY is increasingly a handful of mega-cap tech stocks. Comparing a broad 30-stock fundamentals screen to a market-cap-weighted index dominated by five companies is not apples-to-apples. If you want to use this strategy, the better question is whether it's a suitable replacement for a value or quality factor ETF, not whether it beats SPY.
Looking elsewhere. The same signal works better in markets where the index isn't dominated by capital-light tech. India and Sweden show positive excess returns. The comparison post covers all 22 exchanges we tested.
Data: Ceta Research (FMP financial data warehouse), 2000-2025. Full methodology: backtests/METHODOLOGY.md. Backtest code: backtests/net-debt-ebitda/.


