
Net Debt/EBITDA in Sweden: The Best Developed-Market Result in 20 Exchanges

Net Debt/EBITDA in Sweden: The Best Developed-Market Result in 22 Exchanges
Out of 22 exchanges we tested the Net Debt/EBITDA screen across, Sweden's Stockholm Stock Exchange produced the best result among developed markets: 10.29% CAGR, +2.28% above SPY annually, Sharpe ratio 0.412. The signal works in Sweden because the exchange has an unusually high concentration of mid-cap industrial companies that are naturally conservatively leveraged, and the Swedish market hasn't been dominated by the benchmark-concentration dynamic that hurt other developed exchanges.
Contents
Method
Signal: Net Debt/EBITDA < 2x and > -5x, ROE > 10%, Market Cap > SEK 5B (~$460M USD). Top 30 stocks by lowest ratio, equal weight. Universe: Stockholm Stock Exchange (STO). Full exchange, not index-constrained. Period: 2000-2025 (103 quarterly periods). Rebalancing: Quarterly (January, April, July, October). 45-day filing lag for point-in-time data. Execution: Market-on-close next trading day (signal generated at close, executed at next close). Transaction costs: Size-tiered model applied. Benchmark: S&P 500 (SPY). Consistent benchmark used across all 22 exchanges for comparability. Data: Ceta Research (FMP financial data warehouse).
What We Found
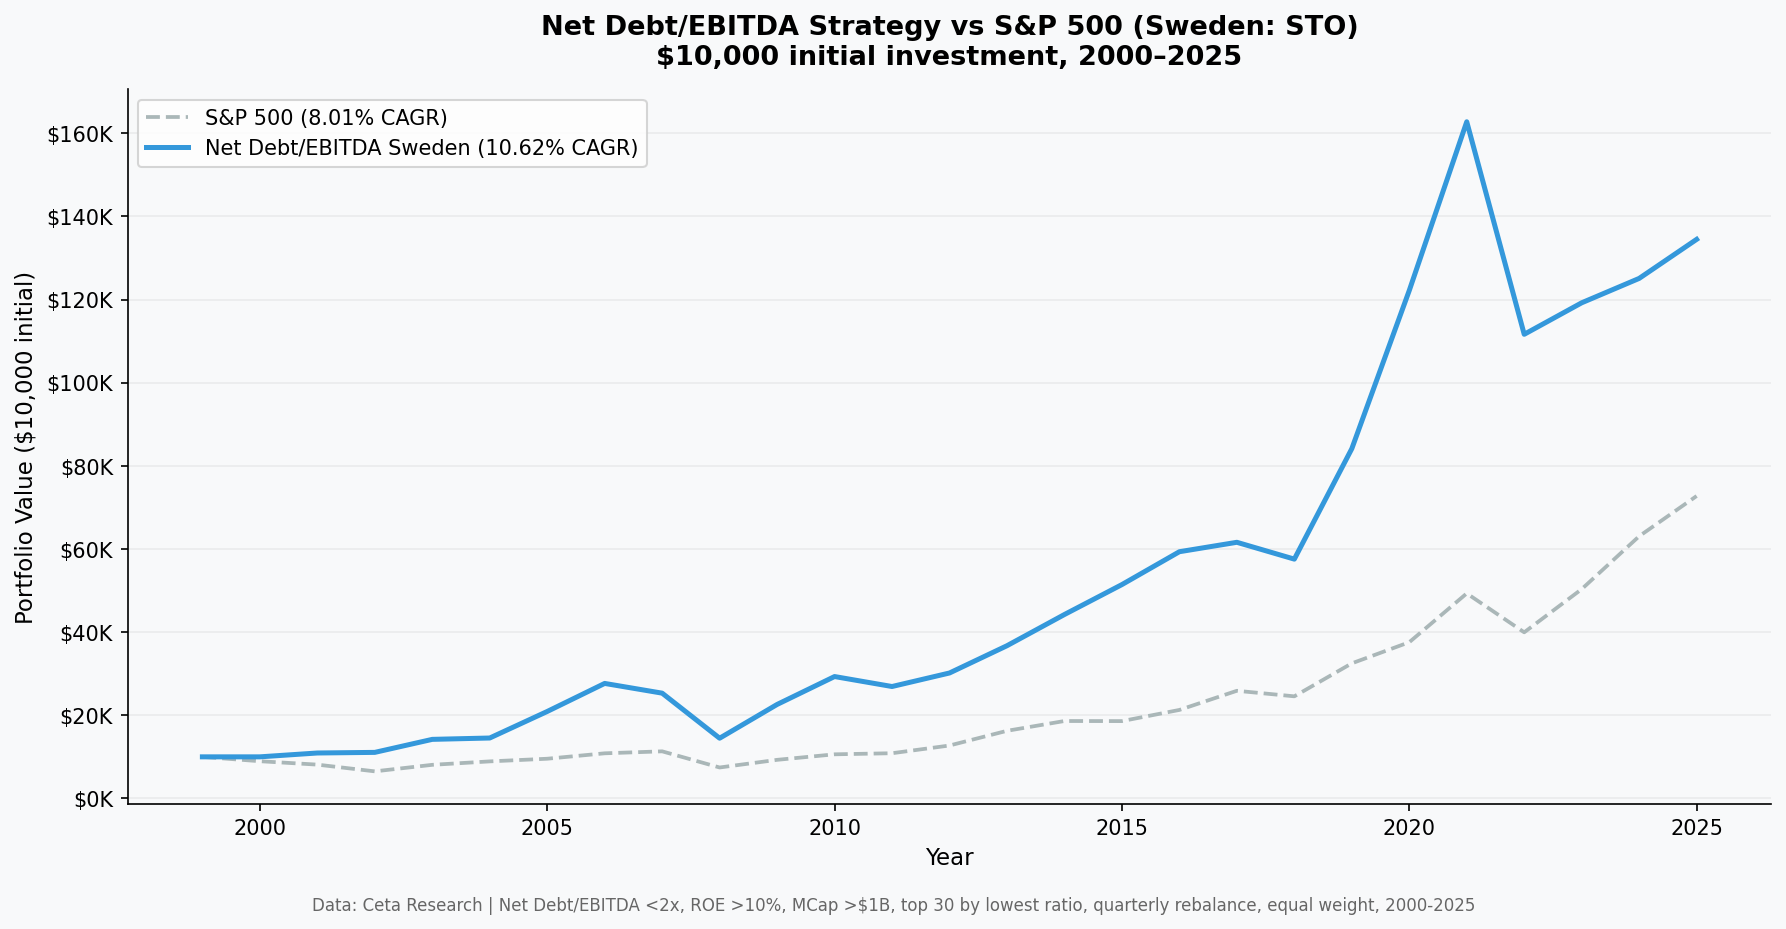
Strategy: 10.29% CAGR. SPY: 8.02% CAGR. Excess return: +2.28% per year over 25 years.
A $10,000 investment grew to $124,565. The same money in SPY grew to $72,829.
| Metric | Strategy | S&P 500 |
|---|---|---|
| CAGR | 10.29% | 8.02% |
| Total Return | 1,145.7% | 628.3% |
| Max Drawdown | -53.0% | -43.9% |
| Annualized Volatility | 20.1% | 16.7% |
| Sharpe Ratio | 0.412 | 0.361 |
| Sortino Ratio | 0.686 | 0.536 |
| Beta (vs SPY) | 0.920 | 1.0 |
| Alpha (annualized) | +2.76% | — |
| Up Capture | 107.0% | — |
| Down Capture | 85.3% | — |
The Sharpe ratio of 0.412 is the highest of any developed-market exchange we tested, above Germany (0.230), Switzerland (0.331), and the US (0.123). The signal is more consistent in Sweden than in other Western markets.
The up/down capture pattern shows moderate outperformance: the strategy captures 107% of SPY's upswings and 85.3% of its downswings. It provides genuine downside protection, losing less than SPY in falling markets, while still outperforming in bull markets.

Year-by-Year
| Year | Strategy | SPY | Excess |
|---|---|---|---|
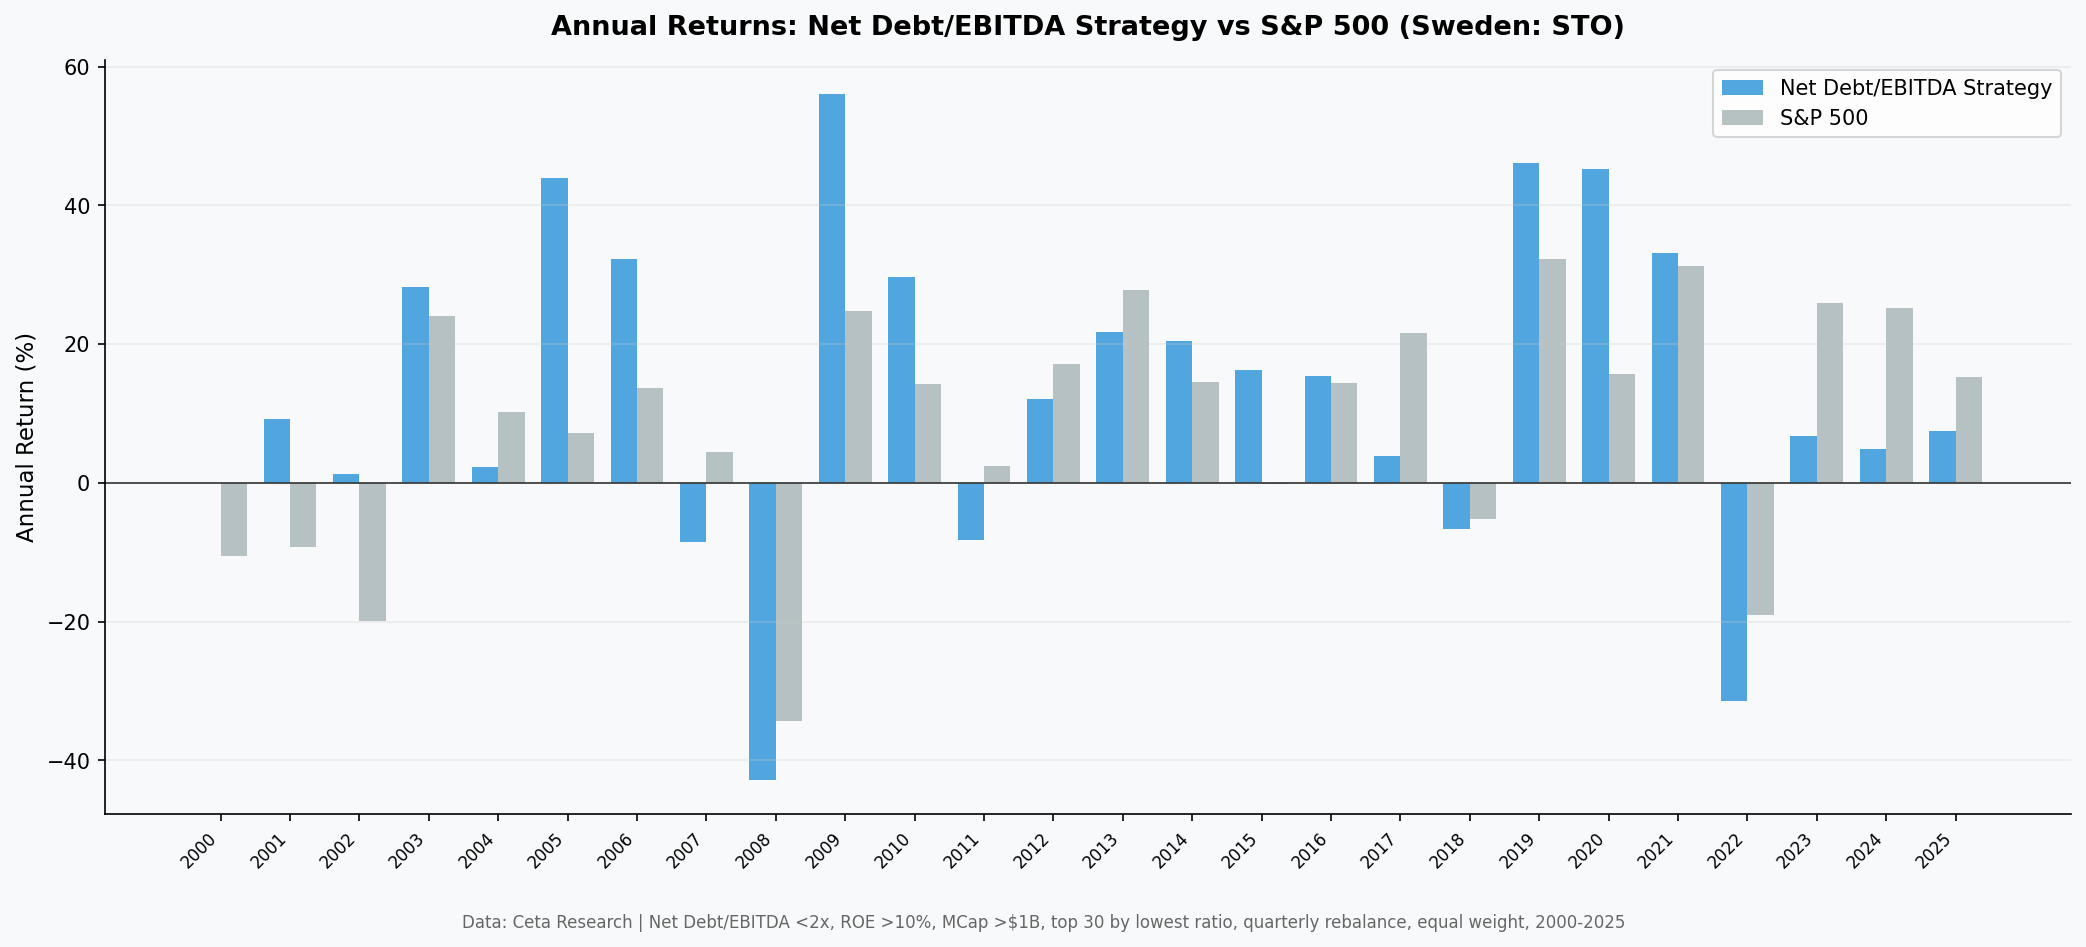
| 2000 | 0.0% | -10.5% | +10.5% |
| 2001 | +0.1% | -9.2% | +9.2% |
| 2002 | +6.3% | -19.9% | +26.2% |
| 2005 | +39.5% | +7.2% | +32.4% |
| 2006 | +32.2% | +13.7% | +18.6% |
| 2008 | -42.5% | -34.3% | -8.2% |
| 2009 | +56.4% | +24.7% | +31.7% |
| 2010 | +30.3% | +14.3% | +16.0% |
| 2015 | +16.5% | -0.1% | +16.6% |
| 2019 | +46.5% | +32.3% | +14.2% |
| 2020 | +42.1% | +15.6% | +26.4% |
| 2022 | -31.6% | -19.0% | -12.6% |
| 2023 | +6.8% | +26.0% | -19.2% |
| 2024 | +4.4% | +25.3% | -20.9% |
The dot-com period (2000-2002) was the clearest demonstration of the signal's protective quality: Sweden's low-leverage companies held flat to slightly positive while SPY fell 10%, 9%, and 20% in consecutive years. That three-year run of outperformance set the foundation for the long-run compounding advantage.
2005 (+39.5% vs SPY's +7.2%) stands out. Swedish small- and mid-cap industrials had an exceptional year driven by strong export earnings. The Net Debt/EBITDA filter concentrated the portfolio in the best-positioned companies in that run.
2019-2020 were strong consecutive years: +46.5% in 2019 and +42.1% in 2020. Swedish industrials and engineering companies performed well in both the pre-COVID bull market and the 2020 recovery.
The trailing years (2022-2024) show recent weakness: the strategy fell more than SPY in 2022 and underperformed by wide margins in 2023 and 2024. Swedish equities suffered from rate sensitivity and SEK weakness during the global tightening cycle.
Why Sweden?
Sweden produces an interesting combination: a developed-market equity culture with a relatively high proportion of mid-cap industrial and tech-adjacent companies that score well on balance sheet quality filters.
Key characteristics of the Swedish equity market:
Manufacturing and engineering base. Sweden has an unusually large concentration of exporters in engineering, automation, and specialty chemicals (Atlas Copco, Sandvik, ABB, Alfa Laval, Hexagon). These companies typically carry low debt relative to their earnings because their business models are capital-efficient rather than capital-intensive. The Net Debt/EBITDA screen naturally selects for them.
Strong corporate governance culture. Swedish corporate governance (ownership concentration, Wallenberg/Handelsbanken structures) tends toward financial conservatism. Swedish CFOs are not rewarded for financial engineering. They manage balance sheets conservatively as a matter of corporate culture.
Limited mega-cap tech concentration. Unlike the US, where 10 stocks now account for a third of the SPY index, Sweden's equity market is diversified enough that a fundamentals screen can actually differentiate winners from the index without constantly missing the handful of names doing all the work.
9% cash periods. The strategy was in cash 9 of 103 quarters (8.7%), periods where fewer than 10 qualifying stocks were available. These coincide with market stress periods where the balance sheet filter became very selective. The low cash rate confirms the screen had a functioning investable universe throughout the backtest.
Part of a Larger Picture
Sweden's result sits in context. This is the third blog in a series testing the Net Debt/EBITDA screen across 20 global exchanges. The flagship US post covers why the signal underperforms in the full US market. The India post covers the top result (+10.43% excess vs Sensex).
Sweden is the answer to a natural question: does the signal work anywhere in developed markets? Yes, but specifically in markets with the right sector composition and corporate culture.
The comparison across all 22 exchanges shows that markets with high weights to capital-efficient industrials and mid-caps tend to outperform on this screen. Markets with heavy financial sector or energy weights (where leverage is structural and EBITDA-relative debt is common) tend to underperform.
Run It Yourself
Current qualifying stocks (Sweden, TTM data):
SELECT
    k.symbol,
    p.companyName,
    ROUND(k.netDebtToEBITDATTM, 2)      AS net_debt_ebitda,
    ROUND(k.returnOnEquityTTM * 100, 1) AS roe_pct,
    ROUND(k.marketCap / 1e9, 1)         AS mktcap_bn
FROM key_metrics_ttm k
JOIN profile p ON k.symbol = p.symbol
WHERE k.netDebtToEBITDATTM < 2.0
  AND k.netDebtToEBITDATTM > -5.0
  AND k.returnOnEquityTTM > 0.10
  AND k.marketCap > 5000000000  -- SEK 5B (~$460M USD)
  AND p.exchange = 'STO'
ORDER BY k.netDebtToEBITDATTM ASC
LIMIT 30
Run this query on Ceta Research
Full backtest:
cd backtests
python3 net-debt-ebitda/backtest.py --preset sweden --verbose
Limitations
FX exposure. Swedish stocks report in SEK. Results are converted to USD at prevailing rates. The 2022-2024 underperformance partly reflects SEK depreciation vs USD, not purely equity returns.
Small universe. STO has fewer than 500 stocks meeting the market cap filter. Cash periods (9% of quarters) reflect genuine scarcity at times. A 30-stock portfolio from ~150-200 qualifying names is more concentrated than the US equivalent.
Sector tilts. The portfolio tends to concentrate in industrials and technology-adjacent engineering firms. This isn't a Sweden ETF replacement, it's a specific sector-tilted portfolio within Sweden.
Benchmark comparison. Comparing Swedish equities to SPY isn't a natural benchmark. A more relevant comparison would be OMX30 (Swedish blue-chip index) or MSCI Sweden. The SPY benchmark is used for consistency across all 22 exchanges, not as a fair Sweden-specific comparison. Against OMX30, the strategy's excess would likely be lower.
Data: Ceta Research (FMP financial data warehouse), 2000-2025. Full methodology: backtests/METHODOLOGY.md. Backtest code: backtests/net-debt-ebitda/.


