
12-Month Momentum on Indian Stocks: 22.74% CAGR Over 25 Years

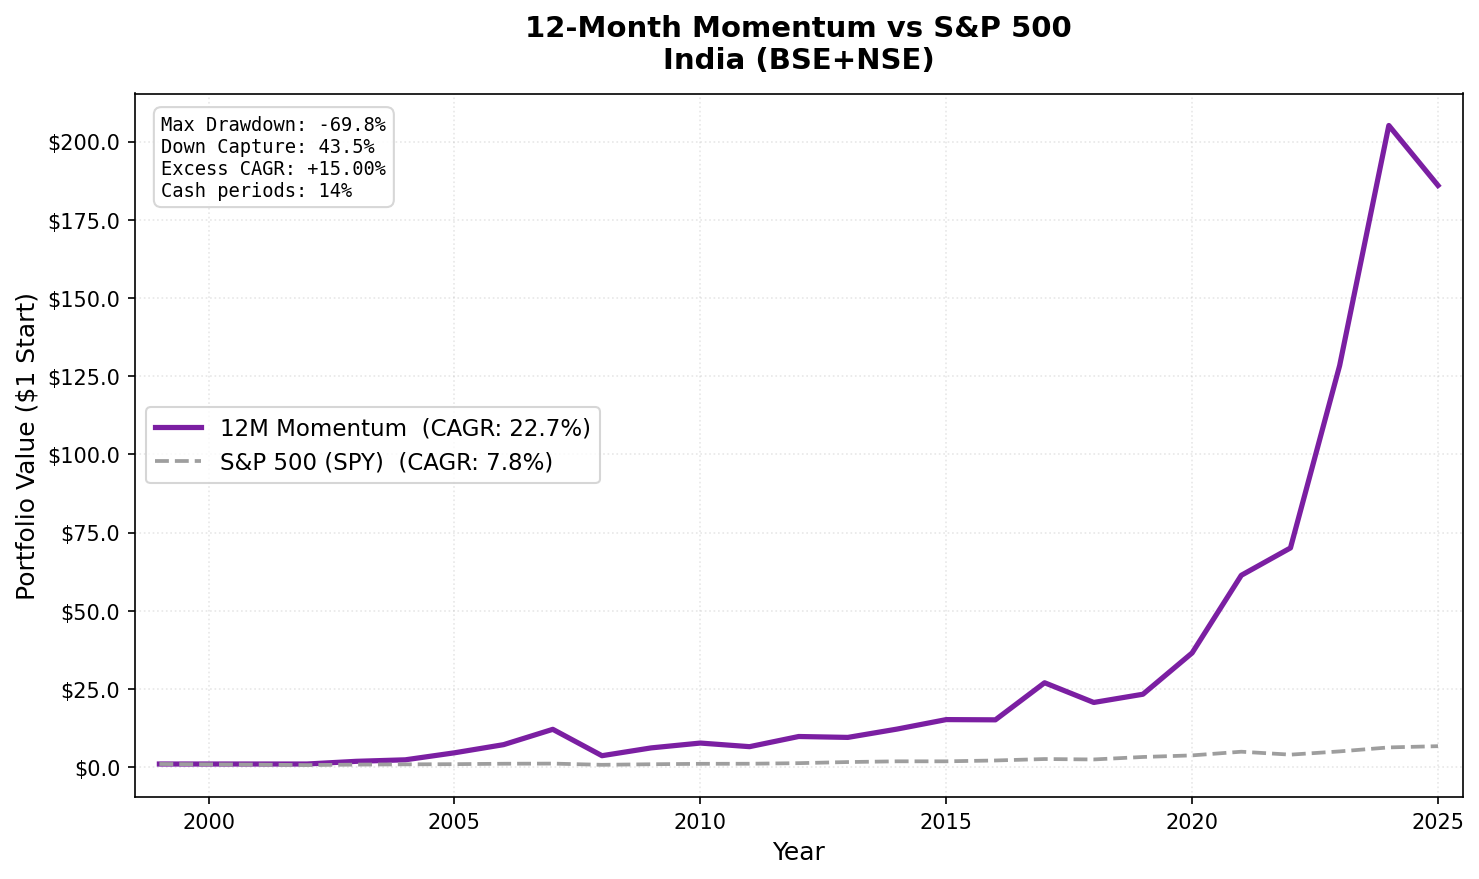
Pure price momentum is supposed to work in emerging markets. India confirms the theory. Buying the top 30 Indian stocks by 12-month trailing return, semi-annually, delivered 22.74% annually from 2001 to 2025. That's +15% per year over the S&P 500 benchmark, one of the largest factor premiums documented in this study. What makes India different is how it performs in downturns: down capture was 43.55%, meaning the portfolio fell less than half as much as SPY in bad markets.
Contents
- Method
- What We Found
- Backtest Methodology
- Limitations
- Takeaway
- Part of a Series
- References
- Run This Screen Yourself
Method
| Parameter | Value |
|---|---|
| Universe | BSE, NSE (combined) |
| Rebalancing | Semi-annual (January, July) |
| Signal | 12-month return, skip last month (12M-1M) |
| Selection | Top 30 by momentum, equal weight |
| Cash rule | Fewer than 10 qualifying stocks |
| Data source | FMP via Ceta Research warehouse |
| Benchmark | S&P 500 (SPY) |
| Period | 2001–2025 |
| Market cap filter | > ₹20B (~$240M USD, point-in-time, 45-day lag) |
India started with 0% invested in 2001 and 2002 due to insufficient qualifying stocks, the combination of market cap threshold and momentum data requirements excluded the full universe in those early periods. The live backtest ran from the first period with 10+ qualifying stocks.
What We Found
25-year summary (2001–2025):
| Metric | 12M Momentum | S&P 500 (SPY) |
|---|---|---|
| CAGR | 22.74% | 7.75% |
| Total Return | 18,494.6% | 570.3% |
| Sharpe Ratio | 0.450 | 0.382 |
| Max Drawdown | -69.75% | -36.65% |
| Down Capture | 43.55% | 100% |
| Up Capture | 215.95% | 100% |
| Cash Periods | 7 of 51 (14%) |
The total return difference is striking. $1 invested in the strategy in 2001 became $185.9 by 2025. The same dollar in SPY became $6.70. The 18,494% vs 570% comparison illustrates what compounding 15% annual excess return does over 25 years.
The down capture of 43.55% is the surprising part. In years when SPY fell, this portfolio typically fell far less. Momentum in Indian equities has, historically, been concentrated in domestic consumer, financial, and infrastructure sectors that are less correlated with global risk-off episodes than the SPY.
The 2008 exception. Momentum couldn't protect against the global financial crisis. The strategy fell -69.8% in 2008 vs SPY's -34.3%, the worst single-year performance in the dataset. This is also the only year where down capture was severely above 100%. Indian equities were caught in the same forced-selling wave as global risk assets. The subsequent recovery was fast: +68.2% in 2009.
Year-by-year standouts:
| Year | 12M Momentum | SPY | Notes |
|---|---|---|---|
| 2003 | +85.6% | +24.1% | Post-bear market surge |
| 2005 | +95.7% | +7.2% | India structural growth peak |
| 2007 | +68.1% | +4.4% | Pre-crisis momentum |
| 2008 | -69.8% | -34.3% | Global crisis — worst year |
| 2009 | +68.2% | +24.7% | Fast recovery |
| 2017 | +78.4% | +21.6% | Domestic consumption boom |
| 2021 | +68.0% | +31.3% | Post-COVID recovery |
| 2022 | +14.3% | -19.0% | Best relative year — protected |
| 2023 | +83.2% | +26.0% | Infrastructure/domestic rally |
2022 is the clearest demonstration of the down capture story. While SPY fell 19%, the India momentum portfolio gained 14.3%. The portfolio was concentrated in domestic-facing Indian sectors that were insulated from the global rate shock and Fed tightening that hurt US equities. The 34-point outperformance in a single year is real.
2022 vs 2008. These two crisis years tell different stories. In 2008, India had significant global exposure in IT and financial sectors with foreign institutional ownership, forced selling hit them. In 2022, the portfolio was concentrated in domestic sectors with limited global correlation. Momentum adapts to what's working. In 2022, domestic India was working.
The bull market magnification. Up capture of 215.95% means the portfolio amplified Indian bull markets. The years 2003, 2005, 2007, 2017, and 2023 all show the strategy running at 2-4x the magnitude of SPY. Indian equity bull markets have been concentrated in specific sectors, and momentum captures that concentration.
Backtest Methodology
- Data: FMP financial data via Ceta Research warehouse. Price data from
stock_eod(adjusted closes). - Point-in-time: Market cap filter uses annual
key_metricsfilings with 45-day lag. No look-ahead bias. Indian filings typically arrive April-May for fiscal year ending March. - Signal: Price at T-12M to T-1M. The 1-month skip avoids short-term reversal contamination.
- Data quality: Stocks with adjusted close < $1 at either lookback date excluded. Momentum capped at 500% per stock.
- Cash periods: 14% of semi-annual periods had fewer than 10 qualifying stocks. These periods contribute 0% return (no positions taken). This applies to early data periods when FMP coverage of Indian markets was thinner.
- Equal weight: 30 positions when invested. No intraperiod rebalancing.
- Transaction costs: Modeled as size-tiered. Indian liquidity is lower than US, so costs are higher in the model.
- Benchmark: SPY ETF total return. Note: SPY measures USD returns. India momentum CAGR is in USD terms (INR exposure). Currency effects are embedded in the return.
Limitations
Currency risk is embedded. Returns are in USD terms. A weakening INR reduces the USD CAGR. From 2001 to 2025, the INR depreciated roughly 50% against the USD. The local-currency returns are higher than the USD figures shown. This means real Indian investors capturing this strategy would see higher numbers in rupee terms.
2008 shows the tail risk. A -69.75% max drawdown is severe. The fast recovery is historically documented, but a drawdown that large requires patience most investors don't have.
14% cash periods in early data. Coverage of Indian markets in FMP's database is thinner before 2004. The strategy was in cash for several early periods. This partially explains the outsized early-year returns, the portfolio was concentrated in only the highest-quality momentum names when it did invest.
Emerging market structural risks. FPI limits, SEBI regulatory changes, and market access restrictions are real ongoing factors that can change the investability of this strategy. The historical backtest doesn't account for these.
No transaction costs in emerging market context. The model uses size-tiered costs, but Indian mid-cap liquidity can be thin. Actual execution costs for a large position would be higher than modeled.
Takeaway
12-month momentum on Indian stocks delivered 22.74% CAGR from 2001 to 2025. The +15% excess over SPY compounds to transformational differences in terminal wealth. The 43.55% down capture is unusual for a strategy this aggressive, it means India momentum has historically been a high-return, lower-downside combination.
The explanation likely involves market structure. Indian equities are driven by domestic growth cycles, consumer expansion, and infrastructure investment. Momentum in this environment captures real economic trends that persist for 6-12 months. The market is also less saturated with systematic momentum traders compared to US equities.
The 2008 risk remains the main caution. Any globally correlated crash will hit India momentum hard. But the evidence from 2022, 2011, and other non-global-crisis downturns suggests the strategy has genuine downside protection in the scenarios that matter most.
Part of a Series
This is part of a multi-exchange 12-month momentum study:
- 12M Momentum: Global 18-Exchange Comparison, published April 14
- 12M Momentum: Germany Best Sharpe in 18 Exchanges, published April 18
- 12M Momentum: UK Consistent Alpha, Low Down Capture, published April 20
- 12M Momentum: US Underperforms SPY by 3.69%/yr, published April 23
References
- Jegadeesh, N. & Titman, S. (1993). Returns to Buying Winners and Selling Losers. Journal of Finance, 48(1), 65-91.
- Asness, C., Moskowitz, T. & Pedersen, L. (2013). Value and Momentum Everywhere. Journal of Finance.
- Daniel, K. & Moskowitz, T. (2016). Momentum Crashes. Journal of Financial Economics.
Run This Screen Yourself
The current 12-month momentum screen for Indian stocks is live on Ceta Research:
cetaresearch.com/data-explorer?q=TDZ3OQ5hBA
-- 12-Month Momentum India Screen
-- Live at: cetaresearch.com/data-explorer?q=TDZ3OQ5hBA
WITH universe AS (
 SELECT p.symbol, p.companyName, p.exchange, k.marketCap / 1e9 AS market_cap_billions
 FROM profile p JOIN key_metrics_ttm k ON p.symbol = k.symbol
 WHERE k.marketCap > 20000000000 AND p.isActivelyTrading = true
 AND p.exchange IN ('BSE', 'NSE')
),
price_12m_ago AS (
 SELECT symbol, adjClose AS price_12m,
 ROW_NUMBER() OVER (PARTITION BY symbol ORDER BY ABS(CAST(dateEpoch AS BIGINT) -
 CAST(EXTRACT(EPOCH FROM (CURRENT_DATE - INTERVAL '365' DAY))::BIGINT AS BIGINT))) AS rn
 FROM stock_eod
 WHERE CAST(date AS DATE) BETWEEN CURRENT_DATE - INTERVAL '395' DAY
 AND CURRENT_DATE - INTERVAL '335' DAY
 AND adjClose > 0
),
price_1m_ago AS (
 SELECT symbol, adjClose AS price_1m,
 ROW_NUMBER() OVER (PARTITION BY symbol ORDER BY ABS(CAST(dateEpoch AS BIGINT) -
 CAST(EXTRACT(EPOCH FROM (CURRENT_DATE - INTERVAL '30' DAY))::BIGINT AS BIGINT))) AS rn
 FROM stock_eod
 WHERE CAST(date AS DATE) BETWEEN CURRENT_DATE - INTERVAL '45' DAY
 AND CURRENT_DATE - INTERVAL '15' DAY
 AND adjClose > 0
)
SELECT u.symbol, u.companyName, u.exchange,
 ROUND(u.market_cap_billions, 2) AS market_cap_billions,
 ROUND((p1m.price_1m - p12.price_12m) / p12.price_12m * 100, 1) AS return_12m_1m_pct
FROM universe u
JOIN price_12m_ago p12 ON u.symbol = p12.symbol AND p12.rn = 1
JOIN price_1m_ago p1m ON u.symbol = p1m.symbol AND p1m.rn = 1
WHERE p12.price_12m > 1.0 AND p1m.price_1m > 1.0
 AND (p1m.price_1m - p12.price_12m) / p12.price_12m <= 5.0
ORDER BY return_12m_1m_pct DESC NULLS LAST
LIMIT 30;


