
12-Month Price Momentum Across 18 Markets: Where the Factor Actually

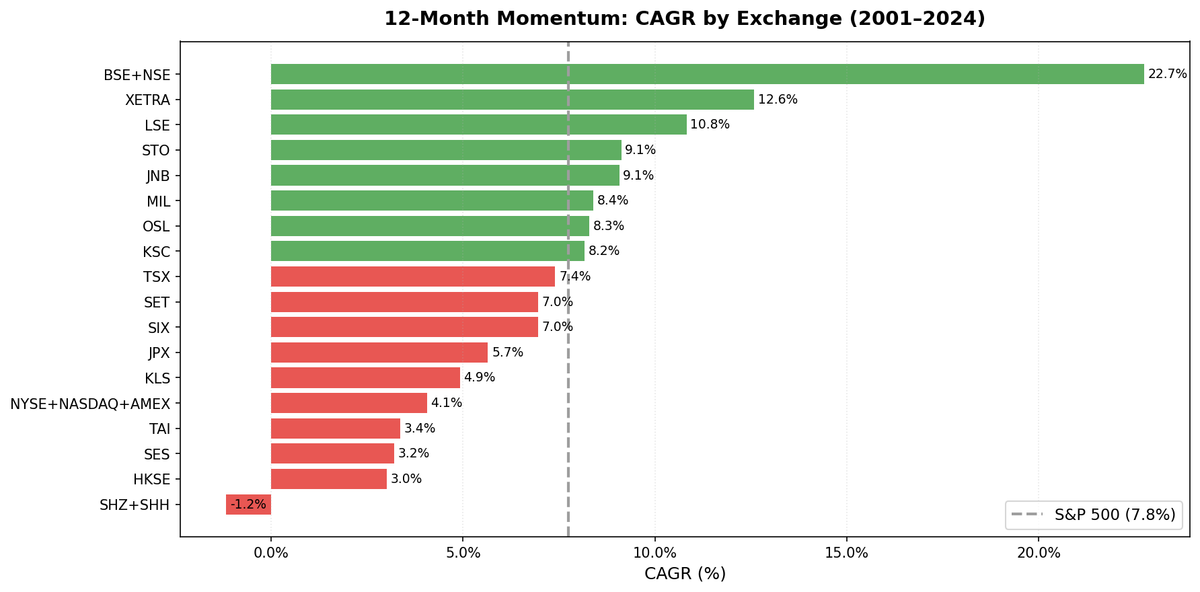
The academic literature says momentum works everywhere. The data from 18 exchanges says it's more complicated. Pure 12-month price momentum (top 30 by 12M-1M return, semi-annual, no quality filters) was backtested across 18 exchanges covering every major equity market from 2000 to 2025. 8 exchanges outperform the S&P 500. 10 underperform. The pattern is geographic: India and Europe deliver genuine alpha; US, China, and most of developed Asia don't.
Contents
- Method
- What We Found
- The Geographic Pattern
- Down Capture: The Risk Dimension
- The 2008 Test
- What the Academic Literature Predicts
- Backtest Methodology
- Limitations
- Takeaway
- References
- Run This Screen Yourself
Method
| Parameter | Value |
|---|---|
| Signal | 12-month return, skip last month (12M-1M) |
| Selection | Top 30 by momentum, equal weight |
| Rebalancing | Semi-annual (January, July) |
| Cash rule | Fewer than 10 qualifying stocks |
| Data source | FMP via Ceta Research warehouse |
| Benchmark | S&P 500 (SPY) |
| Period | 2000–2025 (varies by exchange) |
| Market cap filter | Exchange-specific thresholds (point-in-time, 45-day lag) |
| Exchanges | 18: NYSE+NASDAQ+AMEX, BSE+NSE, XETRA, LSE, JPX, SHZ+SHH, HKSE, KSC, TAI, TSX, SIX, STO, SET, JNB, OSL, MIL, KLS, SES |
The signal is the canonical Jegadeesh-Titman (1993) implementation: price return from 12 months ago to 1 month ago, skipping the most recent month to avoid short-term reversal noise. This study uses no financial quality filters, pure price signal only. Market cap thresholds are exchange-specific (e.g., $1B USD for US, ₹20B for India, ¥100B for Japan) to maintain consistent universe quality across different market sizes.
What We Found
Full 18-exchange results:
| Exchange | CAGR | Excess vs SPY | Sharpe | Max DD | Down Capture | Cash% |
|---|---|---|---|---|---|---|
| India (BSE+NSE) | 22.74% | +15.00% | 0.450 | -69.75% | 43.55% | 14% |
| Germany (XETRA) | 12.58% | +4.84% | 0.561 | -43.56% | 75.29% | 0% |
| UK (LSE) | 10.82% | +3.08% | 0.350 | -57.24% | 58.29% | 0% |
| Sweden (STO) | 9.12% | +1.38% | 0.307 | -53.36% | 137.23% | 4% |
| South Africa (JNB) | 9.07% | +1.33% | 0.002* | -53.42% | 29.44% | 12% |
| Italy (MIL) | 8.40% | +0.65% | 0.277 | -54.57% | 116.17% | 14% |
| Norway (OSL) | 8.28% | +0.53% | 0.272 | -54.80% | 93.06% | 25% |
| Korea (KSC) | 8.17% | +0.43% | 0.213 | -49.54% | 66.84% | 22% |
| S&P 500 (SPY) | 7.75% | — | 0.382 | -36.65% | 100% | |
| Canada (TSX) | 7.40% | -0.34% | 0.262 | -42.32% | 52.42% | 0% |
| Thailand (SET) | 6.96% | -0.79% | 0.197 | -44.74% | 50.57% | 16% |
| Switzerland (SIX) | 6.95% | -0.80% | 0.349 | -41.86% | 115.71% | 0% |
| Japan (JPX) | 5.65% | -2.10% | 0.236 | -58.09% | 123.45% | 4% |
| Malaysia (KLS) | 4.92% | -2.82% | 0.217 | -37.76% | 46.29% | 24% |
| US (NYSE+NASDAQ+AMEX) | 4.06% | -3.69% | 0.079 | -64.50% | 154.33% | 0% |
| Taiwan (TAI) | 3.36% | -4.38% | 0.112 | -50.62% | 129.29% | 22% |
| Singapore (SES) | 3.20% | -4.54% | 0.041 | -50.83% | 101.14% | 16% |
| Hong Kong (HKSE) | 3.01% | -4.74% | 0.000 | -72.34% | 140.18% | 4% |
| China (SHZ+SHH) | -1.17% | -8.91% | -0.096 | -77.88% | 151.76% | 0% |
*JNB Sharpe near zero: South Africa's 9% risk-free rate effectively matches the strategy's 9.07% CAGR, making Sharpe a poor metric. Use absolute return and down capture instead.
The Geographic Pattern
Where it works: India, Germany, UK, and to a lesser extent Sweden, South Africa, Norway, and Korea. These markets share structural characteristics: less systematic momentum trading penetration, deeper mid-cap universes, and real business cycle-driven momentum (commodity cycles, infrastructure cycles, consumer cycles) rather than tech-sentiment cycles.
Where it fails: China, Hong Kong, Taiwan, Singapore, the US, and most of developed Asia. The US failure is the starkest, the world's most studied momentum market delivers the second-worst result. China is the worst overall at -1.17% CAGR with a -77.88% max drawdown.
The crowding hypothesis. US momentum is heavily traded by quantitative funds. Every major factor investor, from AQR to Two Sigma, runs systematic momentum. The premium gets arbitraged toward zero and the crash risk increases as crowded positions unwind simultaneously. The Daniel-Moskowitz (2016) momentum crash mechanism is most acute in the US.
The emerging market pattern. India outperforms massively; China doesn't. This isn't simply "emerging markets = momentum works." Market structure matters. India has domestic-focused growth sectors (consumer, financial, infrastructure) with genuine multi-year earnings trends. China has significant state ownership, policy-driven price movements, and a different market microstructure where momentum signals are contaminated by political and regulatory events.
Down Capture: The Risk Dimension
The range of down capture across 18 exchanges tells the real risk story:
- South Africa: 29.44% (portfolio fell 70% less than SPY in downturns)
- India: 43.55% (fell 56% less)
- Malaysia: 46.29% (fell 54% less)
- Thailand: 50.57% (fell 49% less)
- Canada: 52.42% (fell 48% less)
- UK: 58.29% (fell 42% less)
- Korea: 66.84% (fell 33% less)
- Germany: 75.29% (fell 25% less)
- Singapore: 101.14% (slightly worse than SPY)
- Norway: 93.06% (close to SPY)
- US: 154.33% (fell 54% MORE than SPY)
- China: 151.76% (fell 52% more)
- Hong Kong: 140.18% (fell 40% more)
- Taiwan: 129.29% (fell 29% more)
The US and China have the worst down capture. The markets with the most crowded momentum trading also amplify crashes the most. In contrast, India and South Africa, markets with less systematic quant trading, show dramatic downside protection.
South Africa's unusual profile. The JNB Sharpe is 0.002 because the risk-free rate in South Africa is 9%. The strategy's 9.07% CAGR barely exceeds the risk-free rate. But the 29.44% down capture is the best in the study. This is a genuine diversification asset for a global portfolio, it generates returns comparable to cash while avoiding most equity downturns.
The 2008 Test
Every exchange was hit in 2008. The question is how hard:
| Exchange | 2008 Return | vs SPY (-34.3%) |
|---|---|---|
| Germany | -40.3% | -6 pp |
| UK | -53.6% | -19 pp |
| India | -69.8% | -35 pp |
| US | -59.5% | -25 pp |
| China | -68.5% | -34 pp |
2008 was a globally synchronized crisis driven by forced deleveraging. No exchange was immune. The exchanges with better long-term down capture (India, UK) still got hit hard in 2008, because the global crash mechanism (leveraged selling across all assets) overwhelmed regional diversification.
The 2022 crisis showed a different pattern. Rate-shock-driven downturns are more regional and sector-specific. Germany (-13.7% vs -19% SPY), UK (-18.7% vs -19%), and India (+14.3% vs -19%) all performed well relative to SPY in 2022. The down capture numbers in the table above reflect the average across all crisis types, including 2008.
What the Academic Literature Predicts
Asness, Moskowitz, and Pedersen (2013) documented momentum in equities across 40+ countries. They showed the premium is positive and statistically significant globally. This study replicates that finding for most exchanges, but the magnitude varies enormously.
The academic prediction is correct in direction: more exchanges than not show positive excess returns. But the US result (-3.69% annual drag) challenges the straightforward "momentum works everywhere equally" interpretation.
The heterogeneity is consistent with the rational-learning interpretation of momentum (Hong and Stein, 1999): when information diffuses slowly through institutional ownership chains, momentum persists longer. Less institutionally penetrated markets see slower information diffusion and stronger momentum. That describes India and Germany better than the US or Japan.
Backtest Methodology
- Data: FMP financial data via Ceta Research warehouse. Price data from
stock_eod(adjusted closes). - Point-in-time: Market cap filter uses annual
key_metricsfilings with 45-day lag per exchange. - Exchange-specific thresholds: $1B USD (US), ₹20B (India), €500M (Germany), £500M (UK), ¥100B (Japan), etc.
- Cash rule: Fewer than 10 qualifying stocks → hold cash for that semi-annual period.
- Data quality: Stocks with adjusted close < $1 excluded. Momentum capped at 500% per stock. Exchanges ASX and SAO excluded (historical adjusted close artifacts too severe for reliable momentum calculation).
- RFR: Exchange-specific risk-free rates for Sharpe calculation (e.g., US 2%, India 6.5%, SA 9%).
- Benchmark: SPY total return for all exchanges. This is a cross-exchange comparison benchmark, not a local index.
Limitations
SPY as benchmark. Using SPY for all 18 exchanges creates a USD-denominated comparison. Local investors would measure against local benchmarks and local risk-free rates. The "excess CAGR" figures in this study are vs SPY, which inflates the apparent advantage of non-US exchanges that have historically delivered higher absolute returns.
Currency effects. Every non-USD exchange has embedded currency exposure. INR, EUR, GBP, JPY, and others all moved vs USD from 2000 to 2025. The CAGR figures include these currency movements. Local-currency returns would differ.
Data coverage differences. FMP's historical coverage is deeper for some exchanges (US, UK, Germany) than others (India pre-2003, Korea, Southeast Asia). Earlier data gaps mean some exchanges have fewer observations and higher uncertainty in the metrics.
Survivorship and delisting. FMP includes delisted companies in some periods but may not be complete for all exchanges. This could slightly inflate returns by missing the worst outcomes for companies that were removed from exchanges.
Takeaway
12-month price momentum works in most markets. 8 of 18 exchanges outperform SPY, several by wide margins. But the premium isn't uniform. Geography and market structure determine whether the signal translates into investable alpha.
The US is the worst-performing developed market in this study. The most studied, most systematically traded factor market has competed away the excess return and retained the crash risk. India is the strongest performer, a less crowded market with genuine domestic growth cycles where momentum captures real economic trends.
Germany's risk-adjusted profile (Sharpe 0.561) is the best in the study and often overlooked. UK delivers consistent alpha with below-average downside. These two European markets represent the clearest case for adding international momentum exposure to a portfolio that already has US equity coverage.
References
- Jegadeesh, N. & Titman, S. (1993). Returns to Buying Winners and Selling Losers. Journal of Finance, 48(1), 65-91.
- Asness, C., Moskowitz, T. & Pedersen, L. (2013). Value and Momentum Everywhere. Journal of Finance.
- Daniel, K. & Moskowitz, T. (2016). Momentum Crashes. Journal of Financial Economics.
- Hong, H. & Stein, J. (1999). A Unified Theory of Underreaction, Momentum Trading, and Overreaction in Asset Markets. Journal of Finance.
Run This Screen Yourself
Global 12-month momentum screen across all exchanges:


