Margin Expansion Across 12 Exchanges: Where Operating Margins Predict Returns

We ran the same margin expansion backtest across 12 global exchanges. The question: do companies with improving operating margins outperform those with deteriorating margins? The answer depends entirely on which market you're looking at.
Contents
- Method
- The Results at a Glance
- Where Margin Expansion Works
- Taiwan: +15.57% spread
- Hong Kong: +3.77% spread
- Sweden: +3.21% spread
- UK: +2.42% spread
- Germany and Switzerland: ~+1.9% spread
- Where Margin Expansion Barely Registers
- US: +0.83% spread
- China: +1.10% spread
- Korea: +0.75% spread
- Where the Signal Reverses
- India: -14.24% spread (contracting wins)
- Brazil: -0.82% spread
- Canada: -0.65% spread
- What Drives the Cross-Market Differences
- 1. Market concentration vs diversification
- 2. Growth vs profitability valuation regimes
- 3. Speed of price discovery
- Stable Margins: The Hidden Performer
- Full Comparison Table
- Limitations
- Takeaway
Taiwan produced a +15.57% annual spread between expanding and contracting portfolios. India showed a -14.24% reverse signal where contracting margins outperformed. The US barely registered at +0.83%. This isn't a universal factor. It's a market-structure-dependent signal that works powerfully in some economies and fails in others.
The main finding: margin expansion carries the most information in concentrated, export-driven markets where margin trends reflect real competitive positioning. In diversified economies with multiple sectors and revenue sources, the signal dilutes to noise.
Method
Data source: Ceta Research (FMP financial data warehouse) Universe: 12 global exchanges, market cap thresholds in local currency, excluding Financial Services Period: 2000-2025 (24-25 annual periods depending on exchange data availability) Rebalancing: Annual (April 1), equal weight, 45-day filing lag Benchmark: S&P 500 Total Return (SPY, global reference) Cash rule: Hold cash if fewer than 10 qualifying stocks
Signal definition: - Operating Profit Margin (OPM) = Operating Income / Revenue from annual income statements - Margin Expansion = Current FY OPM minus average of prior 3 FY OPMs - Expanding: > +1 percentage point - Stable: -1pp to +1pp - Contracting: < -1 percentage point
Transaction costs: size-tiered (0.1%/0.3%/0.5%), one-way. Returns in local currency per exchange. Full methodology: backtests/METHODOLOGY.md
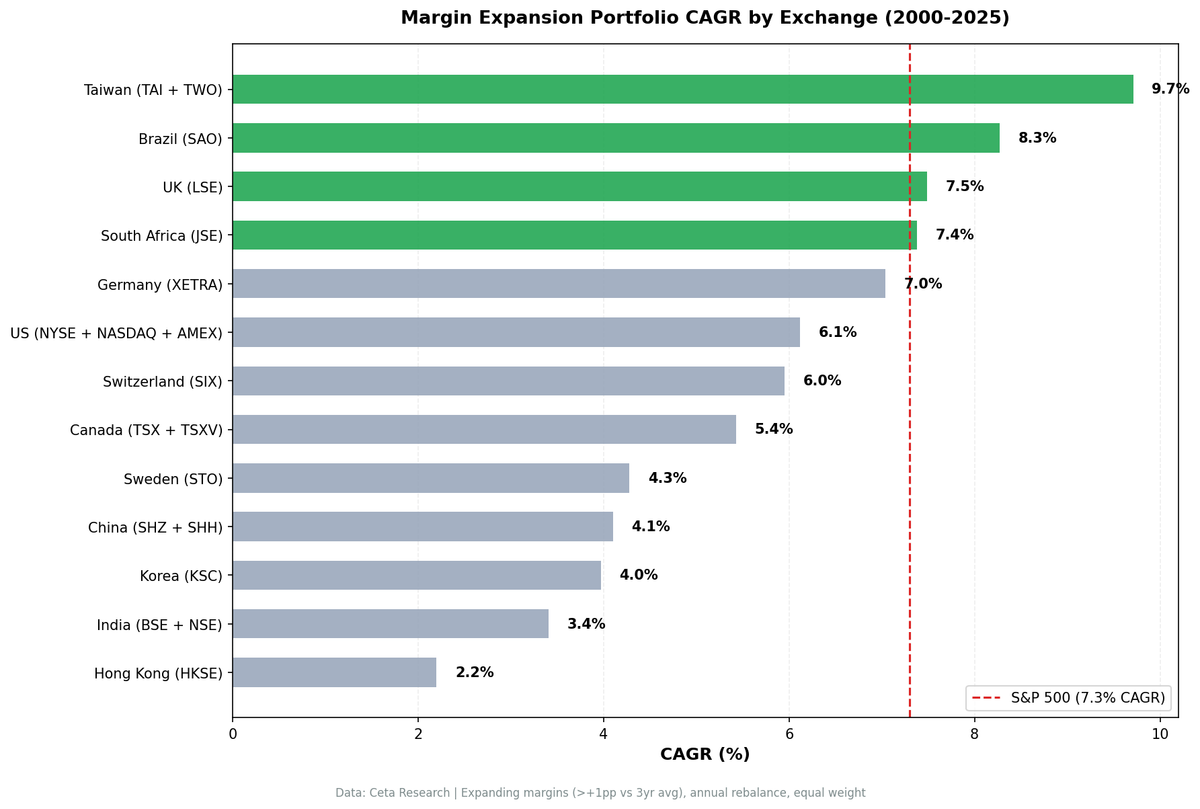
The Results at a Glance
| Exchange | Exp CAGR | Con CAGR | Spread | Avg Exp Stocks |
|---|---|---|---|---|
| Taiwan | 9.71% | -5.86% | +15.57% | 76 |
| Hong Kong | 2.17% | -1.58% | +3.77% | 144 |
| Sweden | 4.31% | 1.10% | +3.21% | 36 |
| UK | 7.49% | 5.07% | +2.42% | 162 |
| Germany | 7.04% | 5.08% | +1.96% | 125 |
| Switzerland | 5.96% | 4.05% | +1.91% | 42 |
| China | 4.10% | 3.03% | +1.10% | 669 |
| US | 6.12% | 5.29% | +0.83% | 563 |
| Korea | 3.97% | 3.22% | +0.75% | 54 |
| Canada | 5.38% | 6.03% | -0.65% | 88 |
| Brazil | 8.34% | 9.09% | -0.82% | 49 |
| India | 3.41% | 17.65% | -14.24% | 199 |
Three groups emerge from this data. Markets where margin expansion works (Taiwan, Hong Kong, Sweden, UK, Germany, Switzerland). Markets where the signal is near zero (China, US, Korea). And markets where contracting margins actually outperform (Canada, Brazil, India).
Where Margin Expansion Works
Taiwan: +15.57% spread
Taiwan is the global standout. Expanding-margin stocks returned 9.71% CAGR while contracting-margin stocks lost 5.86% annually. The contracting portfolio's max drawdown was -93%, effectively capital destruction.
Why it works here: Taiwan's market is concentrated in semiconductors, electronics, and tech hardware. In these industries, margin trends directly map to competitive positioning. A company expanding margins is winning foundry contracts or scaling process nodes. A company contracting is losing customers. The signal carries real fundamental information.
The signal weakened post-2015, but the cumulative 24-year result is unmatched. Full analysis: Taiwan margin expansion blog.
Hong Kong: +3.77% spread
Hong Kong produced the second-widest positive spread. Expanding margins returned 2.17% vs -1.58% for contracting. Both groups delivered low absolute returns, but the directional signal is clear: expanding margins separate winners from losers.
Hong Kong's result reflects its role as a listing venue for Chinese companies across multiple sectors. Margin trends help sort companies exposed to competitive Chinese domestic markets where operational efficiency matters.
Sweden: +3.21% spread
Sweden produced a positive spread from a small universe (36 stocks in the expanding portfolio). At 4.31% CAGR for expanding vs 1.10% for contracting, the absolute returns are modest. The signal works but the thin universe limits practical investability.
UK: +2.42% spread
The UK signal is moderate but has an unusual feature: it strengthened over time. The spread was negative in 2000-09 and turned positive post-2010, widening to +5.6% by 2020-25. The expanding portfolio averaged 162 stocks, making this one of the most diversified results in the study. Full analysis: UK margin expansion blog.
Germany and Switzerland: ~+1.9% spread
Both continental European markets show modest positive signals. Germany (7.04% vs 5.08%, 125 stocks) and Switzerland (5.96% vs 4.05%, 42 stocks) fall in the "real but small" category. The expanding portfolios outperform, but the spread is narrow enough that implementation costs could eat into it.
Where Margin Expansion Barely Registers
US: +0.83% spread
The US result is the most surprising near-miss. With the world's deepest equity market and 563 expanding-margin stocks on average, you'd expect margin trends to carry information. They barely do.
Expanding margins returned 6.12% vs 5.29% for contracting. A +0.83% spread over 25 years. The US market is too diversified, too efficient, and too well-analyzed for margin expansion alone to generate meaningful separation. Price discovery happens faster. Margin improvements get priced in quickly by the time annual filings confirm them.
China: +1.10% spread
China's signal is weak despite having the largest expanding-margin universe (669 stocks). Expanding returned 4.10% vs 3.03% for contracting. The A-share market's speculative dynamics, high retail participation, and policy-driven sector rotations overwhelm fundamental signals like margin trends.
Korea: +0.75% spread
Korea's result (3.97% vs 3.22%, 54 stocks) is statistically thin. The spread is positive but minimal. Korea's chaebol-dominated market structure means a few large conglomerates drive returns regardless of margin trends at the individual stock level.
Where the Signal Reverses
India: -14.24% spread (contracting wins)
India produced the most dramatic reversal in the study. Contracting-margin stocks returned 17.65% CAGR while expanding returned just 3.41%. This isn't noise. A -14.24% annual spread sustained over the full period is a genuine reverse signal.
Why? India's growth dynamic rewards companies in rapid revenue expansion phases, even when that expansion temporarily compresses margins. A company investing heavily in distribution, capacity, or market share will show contracting operating margins. But in India's fast-growing economy, that margin compression is an investment, not a problem. The market rewards the growth, not the margin.
The Indian market's valuation framework is different from developed markets. Investors price in future margin recovery once growth investments pay off. Companies with already-expanded margins are often seen as having peaked.
Brazil: -0.82% spread
Brazil shows a mild reverse signal (8.34% expanding vs 9.09% contracting). The effect is small and the universe thin (49 stocks), so this falls in the "inconclusive" category rather than a strong reverse finding.
Canada: -0.65% spread
Canada's reverse signal is also mild (5.38% vs 6.03%). Canada's market is resource-heavy, and commodity companies often show "contracting" margins during periods of investment that precede strong production-driven returns. Similar dynamic to India but weaker.
What Drives the Cross-Market Differences
Three structural factors explain why the signal varies so widely.
1. Market concentration vs diversification
The strongest positive signals appear in concentrated markets. Taiwan (semiconductors), Hong Kong (Chinese commercial exposure), and Sweden (industrials/tech) all have sector tilts where margin trends reflect competitive dynamics. The weakest signals appear in diversified markets (US, China) where margin trends in one sector get diluted by unrelated dynamics in others.
| Market Type | Examples | Avg Spread |
|---|---|---|
| Concentrated/export | Taiwan, Hong Kong, Sweden | +7.5% |
| European mid-size | UK, Germany, Switzerland | +2.1% |
| Large diversified | US, China, Korea | +0.9% |
| Growth-driven | India, Brazil, Canada | -5.2% |
2. Growth vs profitability valuation regimes
Markets that primarily reward revenue growth (India, Brazil) show reverse signals. Markets that reward profitability and operational efficiency (Taiwan, Germany) show positive signals. The margin expansion screen implicitly selects for companies optimizing current profitability. In growth markets, those companies are often ex-growth.
This is a key insight: margin expansion isn't a neutral signal. It carries embedded assumptions about whether improving profitability or accelerating growth is more valued by local market participants.
3. Speed of price discovery
In the US, margin improvements are anticipated by analysts, priced into forward estimates, and reflected in stock prices before annual filings confirm them. The quarterly earnings cycle, analyst coverage depth, and options market activity all accelerate price discovery. By the time an annual rebalance captures the margin expansion, the return has already happened.
In Taiwan and Hong Kong, analyst coverage is thinner for mid-cap companies. Annual margin changes contain more novel information. The signal retains predictive power because the market hasn't fully priced it yet.
Stable Margins: The Hidden Performer
One pattern worth highlighting: stable margins (within +/-1pp of the 3-year average) often perform well relative to what you'd expect.
| Exchange | Stable CAGR | Relative to Expanding | Relative to Contracting |
|---|---|---|---|
| US | 9.72% | +3.60% | +4.43% |
| UK | 6.55% | -0.94% | +1.48% |
| Taiwan | 3.88% | -5.83% | +9.74% |
| Germany | 6.81% | -0.23% | +1.73% |
In the US, stable margins (9.72% CAGR) outperformed both expanding (6.12%) and contracting (5.29%). Stable beat contracting in every market. This suggests that the primary signal isn't "expansion is good" but rather "contraction is bad" and "stability is underrated." Companies maintaining margins, even without improvement, tend to be well-run businesses that avoid the operational deterioration that destroys value. The US result is the strongest case for margin stability as the real quality signal.
Full Comparison Table
| Exchange | Exp CAGR | Stable CAGR | Con CAGR | Spread | Avg Exp | Avg Stable | Avg Con |
|---|---|---|---|---|---|---|---|
| Taiwan | 9.71% | 3.88% | -5.86% | +15.57% | 76 | 44 | 60 |
| Hong Kong | 2.17% | — | -1.58% | +3.77% | 144 | — | — |
| Sweden | 4.31% | — | 1.10% | +3.21% | 36 | — | — |
| UK | 7.49% | 6.55% | 5.07% | +2.42% | 162 | 103 | 129 |
| Germany | 7.04% | — | 5.08% | +1.96% | 125 | — | — |
| Switzerland | 5.96% | — | 4.05% | +1.91% | 42 | — | — |
| China | 4.10% | — | 3.03% | +1.10% | 669 | — | — |
| US | 6.12% | — | 5.29% | +0.83% | 563 | — | — |
| Korea | 3.97% | — | 3.22% | +0.75% | 54 | — | — |
| Canada | 5.38% | — | 6.03% | -0.65% | 88 | — | — |
| Brazil | 8.34% | — | 9.09% | -0.82% | 49 | — | — |
| India | 3.41% | — | 17.65% | -14.24% | 199 | — | — |
Limitations
Local currency returns. All returns are denominated in local currency. A USD-based investor comparing Taiwan (TWD) and India (INR) would see different relative rankings after currency adjustment.
Benchmark consistency. SPY is the global reference benchmark for comparability. Against local benchmarks (TAIEX, Nifty 50, FTSE 100), individual exchange results would look different.
Annual rebalance. The strategy rebalances once per year in April. More frequent rebalancing might capture margin changes faster in markets with quarterly reporting. The annual cadence benefits markets like Taiwan where semi-annual or annual filings are the norm.
Signal definition sensitivity. The +/-1pp threshold for expansion/contraction is fixed across markets. A 1pp OPM change means different things for a 25%-margin US software company and a 5%-margin Taiwanese electronics manufacturer. Percentage-based thresholds might produce different results.
Survivorship bias. Delisted companies with contracting margins would make contracting portfolios look even worse. The bias generally strengthens the positive signal in markets where it exists, making the negative-signal markets (India, Brazil) more noteworthy.
Universe sizes vary. Taiwan (76 expanding stocks) and Sweden (36) have much thinner universes than the US (563) or China (669). Results from thinner universes carry more single-stock concentration risk.
Takeaway
Margin expansion is not a universal factor. It's a market-structure-dependent signal.
The strategy works best in concentrated, export-driven economies where margin trends carry genuine competitive information. Taiwan's +15.57% spread is the clearest example. It works moderately in European markets (UK, Germany, Switzerland) with diversified but not enormous universes. It barely registers in the deepest markets (US, China) where price discovery is fast and sector diversification dilutes the signal. And it reverses in high-growth economies (India) where the market rewards investment-driven margin compression.
For a global investor, the practical takeaway: margin expansion as a factor allocation makes sense in Asian and European mid-size markets. In the US and India, other signals carry more weight.
Full backtest code: github.com/ceta-research/backtests Run live screens: cetaresearch.com/data-explorer
Data: Ceta Research (FMP financial data warehouse). Returns in local currency per exchange. Past performance does not guarantee future results.