Greenblatt's Magic Formula: 25 Years of US Stock Data
We backtested Greenblatt's Magic Formula on all US exchanges from 2000 to 2025 with next-day execution. The strategy returned 9.53% annually vs 8.02% for the S&P 500. Most of the alpha came from 2000-2013.

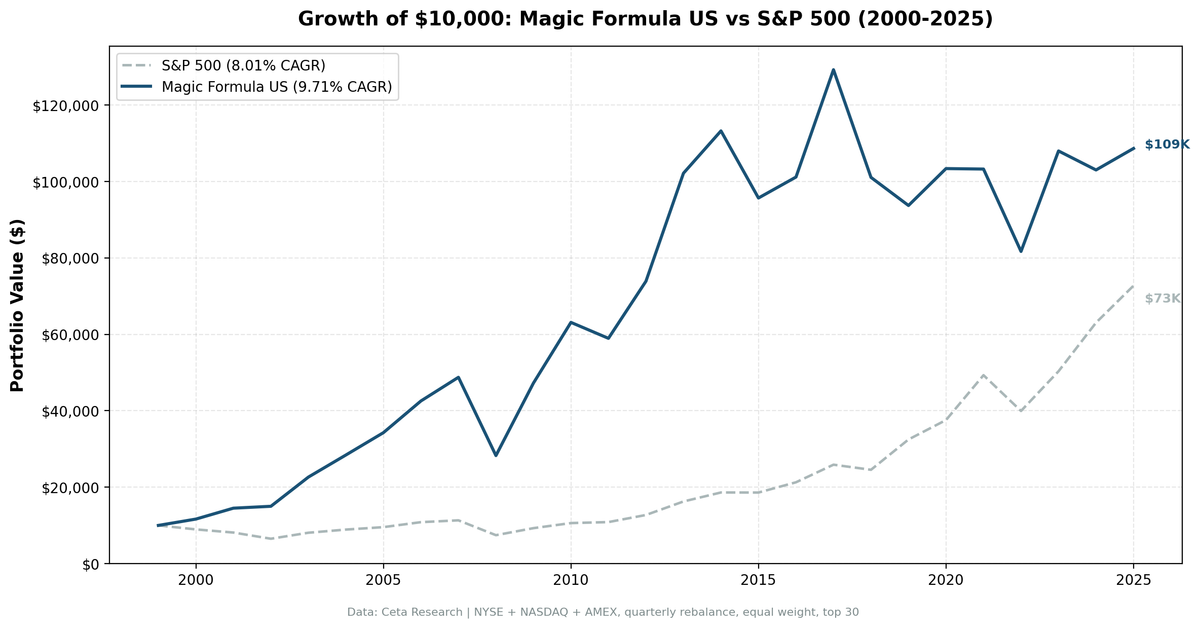
We backtested Greenblatt's Magic Formula on all US exchanges (NYSE, NASDAQ, AMEX) from 2000 to 2025, using next-day execution to avoid same-bar entry bias. The strategy returned 9.53% annually vs 8.02% for the S&P 500. $10,000 became $104,210 vs $72,830 for the benchmark. Most of the alpha came from 2000 to 2013. The last decade has been a grind.
Contents
- The Strategy
- Method
- The Screen (SQL)
- What We Found
- 9.53% CAGR over 25 years. 1.51% annual alpha.
- Year-by-year returns
- Two distinct eras
- Crisis performance
- When It Works
- When It Struggles
- Backtest Methodology
- Limitations
- Takeaway
- Part of a Series
- References
- Run This Screen Yourself
The Strategy
Joel Greenblatt's Magic Formula ranks every stock by two metrics:
- Earnings Yield (EBIT / Enterprise Value) - how cheap is the stock?
- Return on Capital Employed (EBIT / Capital Employed) - how efficiently does it use capital?
Each stock gets a rank for Earnings Yield (highest = rank 1) and a rank for ROCE (highest = rank 1). Add the two ranks together. Buy the 30 stocks with the lowest combined rank. These are companies that score well on both cheapness and quality.
Financial Services and Utilities are excluded because ROCE is meaningless for capital-structure-dependent businesses.
Source: Greenblatt, Joel. The Little Book That Beats the Market (2005).
Method
Data source: Ceta Research (FMP financial data warehouse) Universe: All US exchanges (NYSE, NASDAQ, AMEX), market cap > $1B Period: 2000-2025 (25.8 years, 103 quarterly periods) Rebalancing: Quarterly (January, April, July, October), equal weight top 30 Transaction costs: Size-tiered (0.1% for >$10B, 0.3% for $2-10B, 0.5% for <$2B, one-way) Execution: Next-day close (MOC). Signal generated at rebalance date, trades executed at next trading day's close. Benchmark: S&P 500 Total Return (SPY) Cash rule: Hold cash if fewer than 10 stocks qualify Data lag: Point-in-time financial data (fiscal year end + 45 days)
Full methodology: backtests/METHODOLOGY.md
The Screen (SQL)
WITH base AS (
    SELECT
        k.symbol,
        p.companyName,
        p.exchange,
        p.sector,
        k.earningsYieldTTM as earnings_yield,
        k.returnOnCapitalEmployedTTM as roce,
        k.marketCap / 1e9 as market_cap_billions
    FROM key_metrics_ttm k
    JOIN profile p ON k.symbol = p.symbol
    WHERE k.earningsYieldTTM > 0
      AND k.returnOnCapitalEmployedTTM > 0
      AND k.marketCap > 1000000000
      AND p.sector NOT IN ('Financial Services', 'Utilities')
      AND p.exchange IN ('NYSE', 'NASDAQ', 'AMEX')
),
ranked AS (
    SELECT *,
        RANK() OVER (ORDER BY earnings_yield DESC) AS ey_rank,
        RANK() OVER (ORDER BY roce DESC) AS roce_rank
    FROM base
)
SELECT symbol, companyName, exchange, sector,
       ROUND(earnings_yield * 100, 2) as ey_pct,
       ROUND(roce * 100, 2) as roce_pct,
       ey_rank, roce_rank,
       (ey_rank + roce_rank) as combined_rank,
       ROUND(market_cap_billions, 1) as mcap_bn
FROM ranked
ORDER BY combined_rank ASC
LIMIT 30
Run this query on Ceta Research
What We Found
9.53% CAGR over 25 years. 1.51% annual alpha.
| Metric | Magic Formula | S&P 500 |
|---|---|---|
| CAGR | 9.53% | 8.02% |
| Total Return | 942% | 628% |
| Volatility | 23.4% | 16.7% |
| Max Drawdown | -54.7% | -43.9% |
| Sharpe Ratio | 0.322 | 0.361 |
| Win Rate (quarterly) | 51.5% | - |
| Avg Stocks per Period | 25.1 | - |
| Cash Periods | 0 of 103 | - |
| Beta | 1.07 | - |
| Alpha (annualized) | 1.08% | - |
The total return gap is meaningful: $104K vs $73K on a $10K starting investment. But the Sharpe ratio tells a different story. At 0.322, the Magic Formula delivered more raw return but at higher volatility (23.4% vs 16.7%). The -54.7% max drawdown is deeper than SPY's -43.9%.
This isn't a free lunch. It's a volatility premium wrapped in a value/quality signal.
Year-by-year returns
| Year | Magic Formula | S&P 500 | Excess |
|---|---|---|---|
| 2000 | +16.5% | -10.5% | +27.0% |
| 2001 | +24.9% | -9.2% | +34.1% |
| 2002 | +3.1% | -19.9% | +23.0% |
| 2003 | +52.2% | +24.1% | +28.1% |
| 2004 | +25.4% | +10.2% | +15.2% |
| 2005 | +21.1% | +7.2% | +13.9% |
| 2006 | +24.2% | +13.6% | +10.5% |
| 2007 | +14.3% | +4.4% | +9.9% |
| 2008 | -41.5% | -34.3% | -7.2% |
| 2009 | +65.9% | +24.7% | +41.2% |
| 2010 | +30.8% | +14.3% | +16.5% |
| 2011 | -6.4% | +2.5% | -8.9% |
| 2012 | +25.2% | +17.1% | +8.1% |
| 2013 | +38.0% | +27.8% | +10.2% |
| 2014 | +11.0% | +14.5% | -3.5% |
| 2015 | -16.7% | -0.1% | -16.5% |
| 2016 | +5.0% | +14.5% | -9.4% |
| 2017 | +28.4% | +21.6% | +6.7% |
| 2018 | -21.9% | -5.1% | -16.7% |
| 2019 | -8.0% | +32.3% | -40.3% |
| 2020 | +11.0% | +15.6% | -4.6% |
| 2021 | -0.6% | +31.3% | -31.9% |
| 2022 | -21.1% | -19.0% | -2.1% |
| 2023 | +32.2% | +26.0% | +6.2% |
| 2024 | -5.8% | +25.3% | -31.1% |
| 2025 | +6.2% | +15.5% | -9.3% |
Two distinct eras
2000-2013: The golden age. Magic Formula beat SPY in 11 of 14 years. The dot-com bust was the highlight: +16.5%, +24.9%, and +3.1% in years when SPY dropped -10.5%, -9.2%, and -19.9%. Value stocks with high capital efficiency were exactly what survived. The 2009 recovery was even more dramatic: +65.9% vs +24.7%.
2014-2024: The drought. Magic Formula lagged SPY in 8 of 11 years. 2019 was brutal: -8.0% vs +32.3%. 2021 wasn't much better: -0.6% vs +31.3%. Growth stocks with sky-high P/Es dominated the market, and the Magic Formula's value tilt was a drag. Cheap, capital-efficient companies weren't where the returns were.
Crisis performance
| Event | Magic Formula | S&P 500 | Gap |
|---|---|---|---|
| Dot-com (2000-02) | +49.5% | -34.9% | +84.4% |
| Financial crisis (2008) | -41.5% | -34.3% | -7.2% |
| COVID (2020) | +11.0% | +15.6% | -4.6% |
| 2022 bear | -21.1% | -19.0% | -2.1% |
The dot-com era is where the Magic Formula earned its reputation. Three consecutive years of massive outperformance while the market crashed. But the 2008 financial crisis tells a different story: the strategy fell harder than the benchmark. Value stocks got punished more than growth stocks during the credit crunch.
When It Works
Value cycles. 2000-2007 was a golden era for value investing broadly. The Magic Formula's edge tracks closely with the Fama-French value factor. When cheap stocks outperform expensive ones, the formula delivers.
Recovery years. 2003 (+52.2%), 2009 (+65.9%), 2023 (+32.2%). After sell-offs, the market re-prices quality. The Magic Formula portfolio, loaded with cheap, high-ROCE companies, catches the snap-back.
When It Struggles
Growth-dominated markets. 2019 (-8.0% vs +32.3%) and 2021 (-0.6% vs +31.3%) are the clearest examples. When markets reward companies with high revenue growth regardless of current profitability, the Magic Formula's emphasis on earnings yield becomes a liability.
Credit crises. 2008 was a -41.5% drawdown vs -34% for SPY. Cheap, capital-efficient businesses still had exposure to the credit market. The formula doesn't filter for financial distress directly.
Backtest Methodology
| Parameter | Choice |
|---|---|
| Universe | NYSE + NASDAQ + AMEX, Market Cap > $1B |
| Signal | Rank(Earnings Yield DESC) + Rank(ROCE DESC), top 30 |
| Portfolio | Top 30, equal weight |
| Rebalancing | Quarterly (Jan, Apr, Jul, Oct) |
| Cash rule | Hold cash if < 10 qualify |
| Benchmark | S&P 500 Total Return (SPY) |
| Period | 2000-2025 (25.8 years, 103 periods) |
| Transaction costs | Size-tiered (0.1-0.5% one-way) |
| Data | Point-in-time FY data with 45-day lag |
| Sector exclusion | Financial Services, Utilities |
Limitations
Higher volatility than the benchmark. 23.4% annualized vs 16.7% for SPY. The concentrated portfolio (25 stocks) and value tilt amplify swings. The Sharpe ratio (0.322) is actually lower than SPY's (0.361).
Recent underperformance. The strategy lagged SPY in 8 of the last 11 years (2014-2024). Growth-dominated markets are the Magic Formula's weakness. Investors need multi-year patience.
Beta > 1. At 1.07, the portfolio moves more than the market. Some of the "alpha" is actually beta exposure. The true alpha (regression-based) is only 1.08% annualized.
ROCE vs ROIC. Greenblatt's original formula uses Return on Invested Capital. We use ROCE (Return on Capital Employed), which is the closest available metric in FMP data. ROCE = EBIT / (Total Assets - Current Liabilities). The two are similar but not identical.
No sector balancing. The portfolio skews toward industrials and technology in most periods. There's no constraint on sector concentration.
Survivorship bias. Exchange membership uses current company profiles. Delisted stocks aren't captured retrospectively.
Takeaway
The Magic Formula works on US stocks, but modestly. 9.53% CAGR vs 8.02% for SPY, with 1.51% annual alpha over 25 years. The catch: almost all the alpha came before 2014. The last decade has been painful for value/quality strategies in the US.
Greenblatt's 30% claim from the book was based on a different time period, different universe (smaller caps), and no transaction costs. Our results, using a $1B market cap floor, next-day execution, and quarterly rebalancing with realistic costs, are more conservative. The signal is real but the magnitude is smaller than advertised.
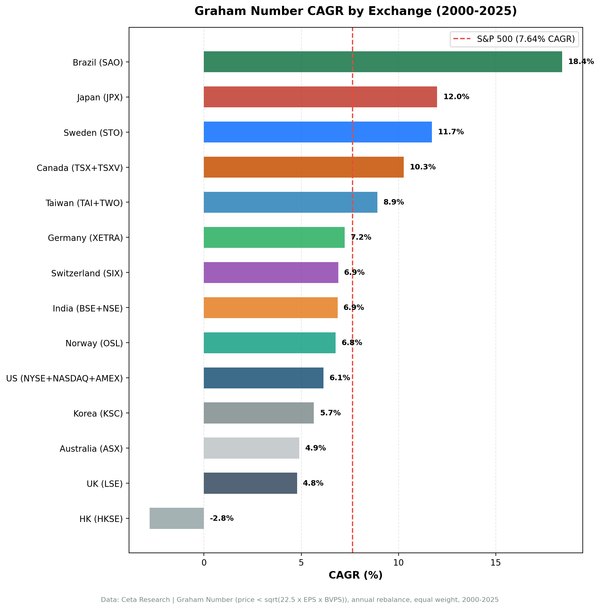
Where the Magic Formula really shines is outside the US. We tested it on 18 exchanges globally. India (+13.1% excess CAGR vs Sensex), Brazil (+10.7% vs Bovespa), and the UK (+8.0% vs FTSE 100) produced the strongest results on liquid, investable-sized companies, even when measured against local benchmarks rather than the S&P 500. Value/quality signals are less efficiently priced when fewer analysts cover the stocks.
Part of a Series
This analysis is part of our Magic Formula global exchange comparison: - Magic Formula on Indian Stocks - 24.25% CAGR, the standout performer - Magic Formula on Indonesian Stocks - JKT analysis - Magic Formula on Brazilian Stocks - Brazil results - Magic Formula: Global Comparison - 18-exchange comparison table
References
- Greenblatt, Joel (2005). The Little Book That Beats the Market. John Wiley & Sons.
- Greenblatt, Joel (2010). The Little Book That Still Beats the Market. John Wiley & Sons.
- Novy-Marx, R. (2013). "The Other Side of Value: The Gross Profitability Premium." Journal of Financial Economics, 108(1), 1-28.
Run This Screen Yourself
Via web UI: Run the Magic Formula screen on Ceta Research. The query is pre-loaded. Hit "Run" and see what passes today.
Via Python:
# Clone the backtest repo
git clone https://github.com/ceta-research/backtests.git
cd backtests

# Run the screen (requires CR_API_KEY)
export CR_API_KEY="your-api-key"
python3 magic-formula/screen.py

# Run the backtest
python3 magic-formula/backtest.py --preset us --verbose
Get your API key at cetaresearch.com. The full backtest code (Python + DuckDB) is on GitHub.
Data: Ceta Research (FMP financial data warehouse). Universe: NYSE + NASDAQ + AMEX, market cap > $1B. Quarterly rebalance, equal weight, 2000-2025. Size-tiered transaction costs.