
Low Debt Quality on Taiwan: Cash-Rich Tech and Half the Market's

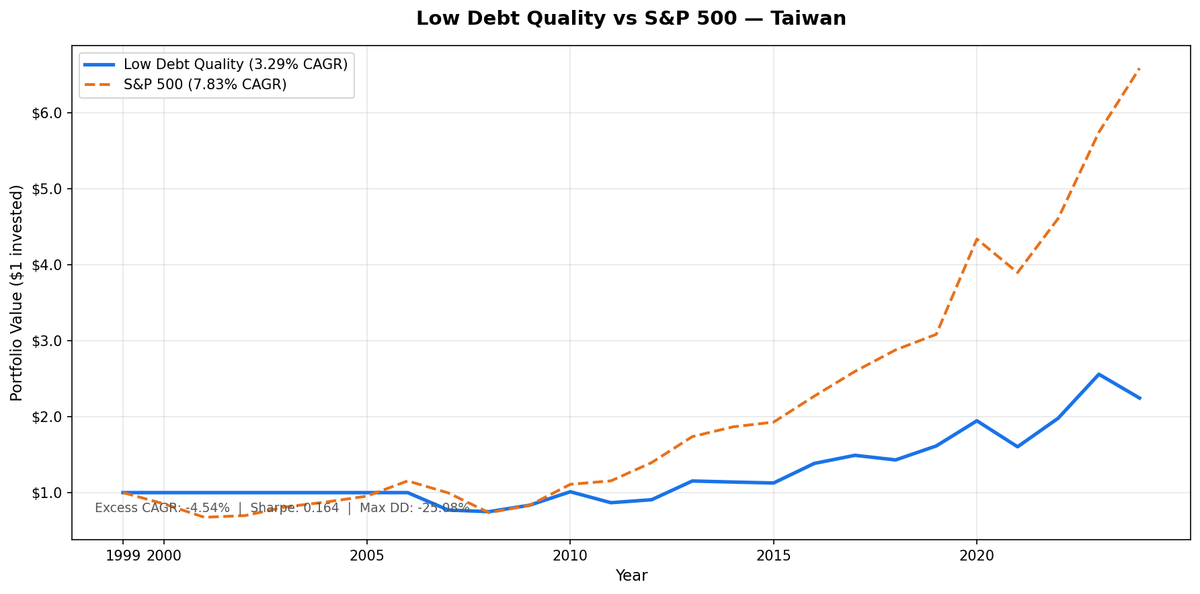
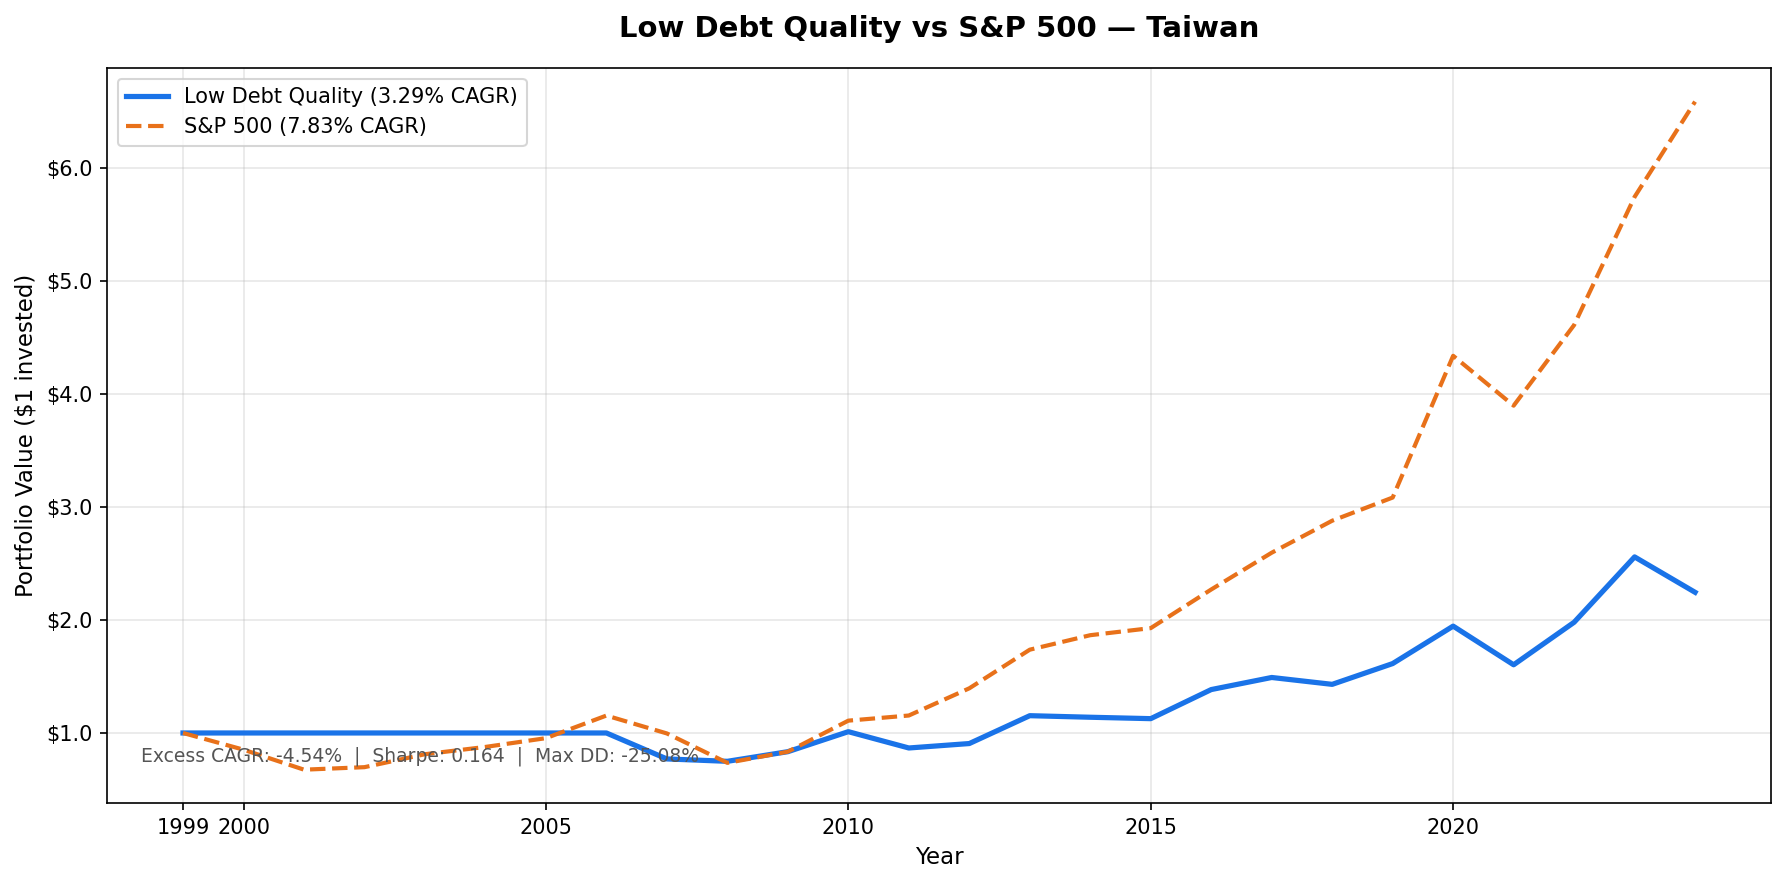
We screened all TAI and TWO-listed stocks for D/E < 0.5 and Piotroski F-Score of 7 or higher, then held the portfolio annually from 2000 to 2025. The result: 3.29% CAGR vs 7.83% for SPY. The strategy trailed by 4.54% per year. Total return was 124.47% vs 558.69% for SPY. The honest upside: max drawdown of -25.08% vs SPY's -36.27%, and a down capture of 50.61%. The strategy lost only half as much as SPY during market sell-offs. But it captured only 47.41% of market gains. The math doesn't work. Results are in TWD.
Contents
- Method
- The Signal
- The Screen (SQL)
- What We Found
- 7 cash periods. Half the upside. Less than a third of the return.
- Annual returns (July-to-July, TWD vs SPY USD)
- 2000-2006: Seven years in cash
- 2008: The sharpest single-year demonstration
- 2013, 2022, 2023: The three investment years that worked
- 2024: The worst single-year excess in the study
- Backtest Methodology
- Limitations
- Takeaway
- Part of a Series
- Run This Screen Yourself
Method
- Data source: Ceta Research (FMP financial data warehouse)
- Universe: TAI + TWO, market cap > TWD 15B
- Period: 2000-2025 (25 years, 25 annual periods)
- Rebalancing: Annual (July), equal weight all qualifying
- Benchmark: S&P 500 Total Return (SPY)
- Cash rule: Hold cash if fewer than 10 stocks qualify
- Data lag: 45-day point-in-time lag on financial statements (prevents look-ahead bias)
Annual returns are measured July-to-July, since the portfolio rebalances each July. The year label marks the start of each 12-month holding period. Returns are in TWD; SPY returns are in USD. The comparison captures strategy performance in local terms, not currency-adjusted.
The Signal
Two filters. Both must pass.
Filter 1: Low Leverage
D/E < 0.5, measured from annual financial statements (FY data). Companies with debt-to-equity at or above 0.5 are excluded entirely, regardless of any other metric.
Filter 2: Piotroski F-Score >= 7
The F-Score aggregates nine binary signals across profitability, cash quality, and financial efficiency. Each signal scores 1 or 0. Stocks must score 7 or higher to qualify.
| # | Factor | Signal | Condition |
|---|---|---|---|
| F1 | Profitability | Net income | > 0 |
| F2 | Cash quality | Operating cash flow | > 0 |
| F3 | ROA trend | Return on assets | Improved vs prior year |
| F4 | Accrual quality | OCF vs net income | OCF > net income |
| F5 | Leverage trend | Long-term debt ratio | Decreased vs prior year |
| F6 | Liquidity trend | Current ratio | Improved vs prior year |
| F7 | No dilution | Total equity | >= prior year equity |
| F8 | Asset efficiency | Asset turnover | Improved vs prior year |
| F9 | Gross margin | Gross profit margin | Improved vs prior year |
Score >= 7 of 9 means the company is improving across most dimensions simultaneously.
Taiwan's listed companies are heavily weighted toward semiconductor and electronics manufacturing. Many of the largest names, TSMC, MediaTek, and Foxconn's various supply chain entities, operate with significant retained earnings and modest debt. The D/E < 0.5 filter keeps many of these cash-rich tech companies in the portfolio. They're not in because they passed a special test. They're in because Taiwan's tech sector is structurally low-leverage. The average qualifying universe was 58 stocks per period.
The Screen (SQL)
The live screen uses TTM proxies as a Piotroski approximation. Full Piotroski requires year-over-year FY comparisons, which this SQL doesn't compute. The TTM screen substitutes ROE, operating margin, and interest coverage as quality proxies. Use this to find candidates, not to replicate the exact backtest signal.
SELECT
 p.exchange,
 r.symbol,
 p.companyName,
 p.sector,
 ROUND(r.debtToEquityRatioTTM, 3) AS de_ratio,
 ROUND(k.returnOnEquityTTM * 100, 1) AS roe_pct,
 ROUND(r.operatingProfitMarginTTM * 100, 1) AS opm_pct,
 ROUND(r.interestCoverageRatioTTM, 1) AS interest_coverage,
 ROUND(k.freeCashFlowYieldTTM * 100, 2) AS fcf_yield_pct,
 ROUND(k.marketCap / 1e9, 2) AS mktcap_b
FROM financial_ratios_ttm r
JOIN key_metrics_ttm k ON r.symbol = k.symbol
JOIN profile p ON r.symbol = p.symbol
WHERE r.debtToEquityRatioTTM >= 0
 AND r.debtToEquityRatioTTM < 0.50
 AND k.returnOnEquityTTM > 0.08
 AND r.operatingProfitMarginTTM > 0.08
 AND r.interestCoverageRatioTTM > 5.0
 AND p.isActivelyTrading = true
 AND k.marketCap > 15000000000
 AND p.exchange IN ('TAI', 'TWO')
ORDER BY de_ratio ASC
LIMIT 30
Run this query on Ceta Research
What We Found
7 cash periods. Half the upside. Less than a third of the return.
| Metric | Low Debt Quality | S&P 500 (SPY) |
|---|---|---|
| CAGR | 3.29% | 7.83% |
| Total Return | 124.47% | 558.69% |
| Volatility | 13.98% | 15.00% |
| Max Drawdown | -25.08% | -36.27% |
| Sharpe Ratio | 0.164 | 0.38 |
| Down Capture | 50.61% | 100% |
| Up Capture | 47.41% | 100% |
| Win Rate (annual vs SPY) | 32% | - |
| Avg Stocks per Period | 58 | - |
| Cash Periods | 7 of 25 | - |
The down capture of 50.61% is genuine. When SPY fell, this portfolio lost roughly half as much. The problem is symmetric: when SPY rose, this portfolio captured only 47.41% of the gain. That rough symmetry in capture ratios is how you get a 3.29% CAGR against SPY's 7.83%.
The win rate of 32% is the lowest in the study. The strategy beat SPY in only 8 of 25 annual periods.
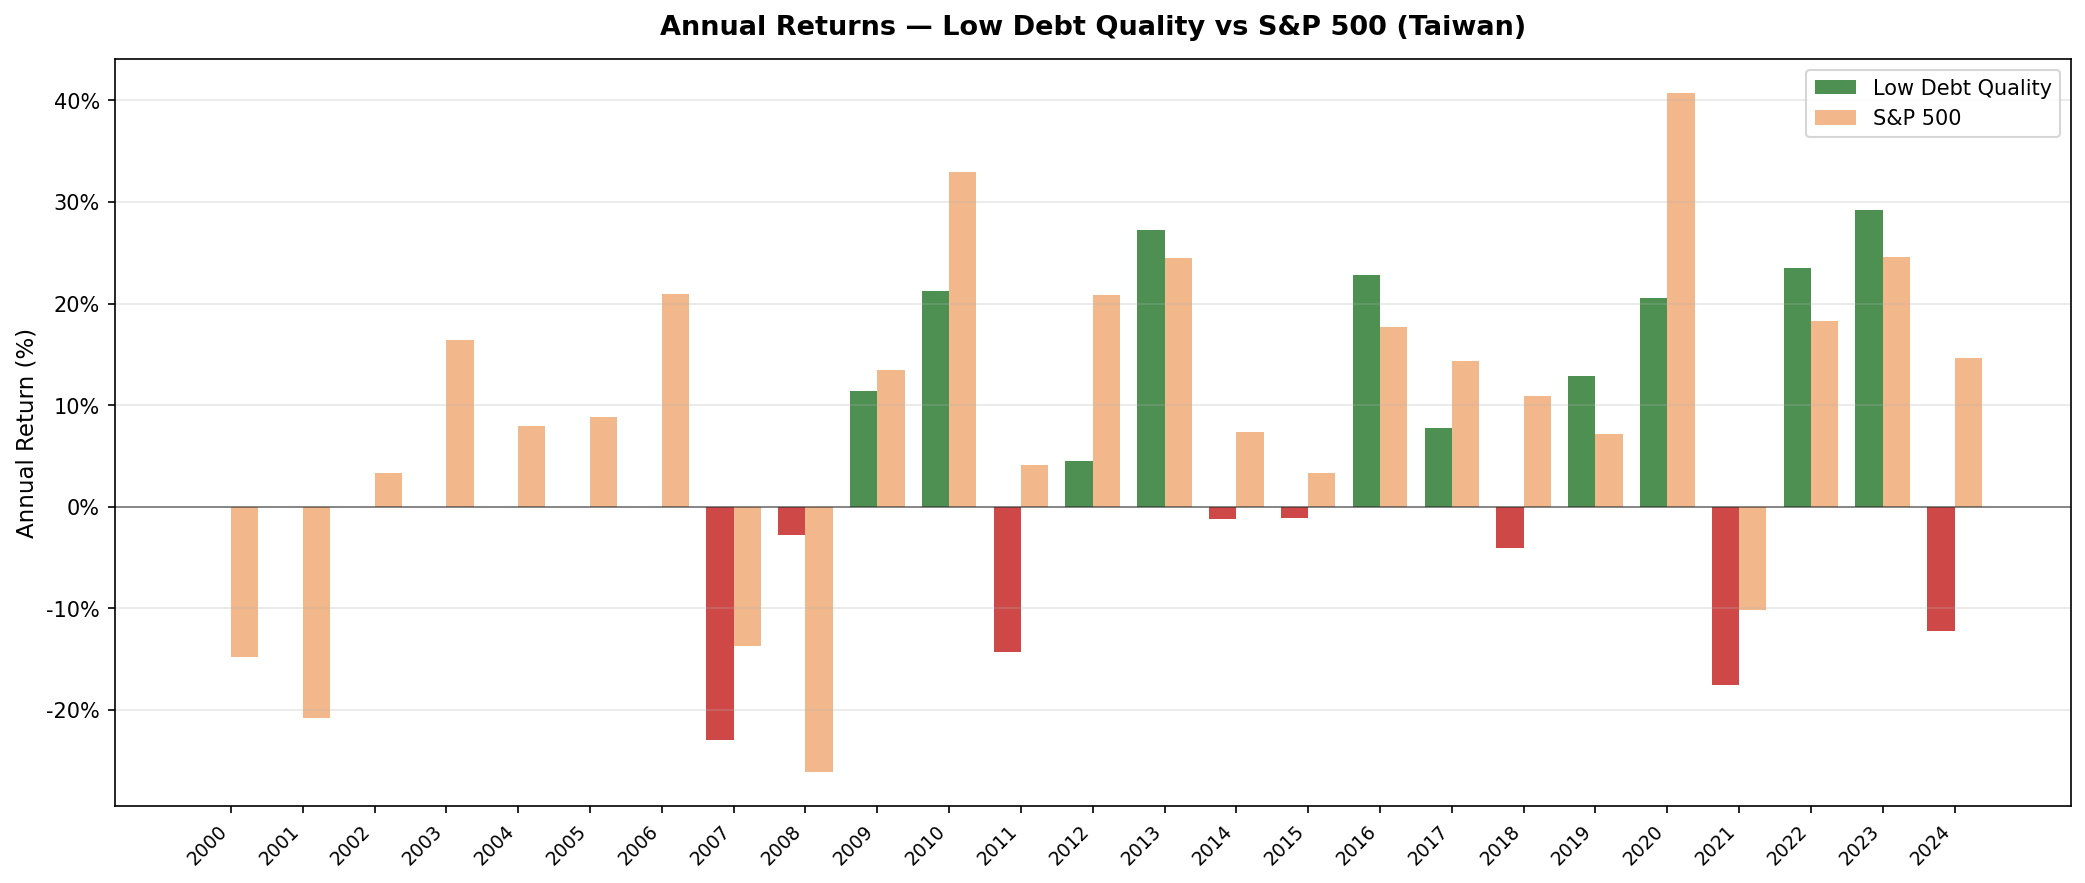
Annual returns (July-to-July, TWD vs SPY USD)
| Year | Portfolio (TWD) | SPY (USD) | Excess |
|---|---|---|---|
| 2000 | 0.0% (cash) | -14.8% | +14.8% |
| 2001 | 0.0% (cash) | -20.8% | +20.8% |
| 2002 | 0.0% (cash) | +3.3% | -3.3% |
| 2003 | 0.0% (cash) | +16.4% | -16.4% |
| 2004 | 0.0% (cash) | +7.9% | -7.9% |
| 2005 | 0.0% (cash) | +8.9% | -8.9% |
| 2006 | 0.0% (cash) | +20.9% | -20.9% |
| 2007 | -23.0% | -13.7% | -9.3% |
| 2008 | -2.7% | -26.1% | +23.4% |
| 2009 | +11.4% | +13.4% | -2.0% |
| 2010 | +21.2% | +32.9% | -11.7% |
| 2011 | -14.3% | +4.1% | -18.4% |
| 2012 | +4.5% | +20.9% | -16.3% |
| 2013 | +27.2% | +24.5% | +2.7% |
| 2014 | -1.2% | +7.4% | -8.6% |
| 2015 | -1.1% | +3.4% | -4.5% |
| 2016 | +22.8% | +17.7% | +5.1% |
| 2017 | +7.7% | +14.3% | -6.6% |
| 2018 | -4.1% | +10.9% | -15.0% |
| 2019 | +12.9% | +7.1% | +5.7% |
| 2020 | +20.5% | +40.7% | -20.1% |
| 2021 | -17.6% | -10.2% | -7.4% |
| 2022 | +23.5% | +18.3% | +5.2% |
| 2023 | +29.2% | +24.6% | +4.6% |
| 2024 | -12.2% | +14.7% | -26.9% |
2000-2006: Seven years in cash
All seven cash periods occurred consecutively at the start of the backtest. In the early 2000s, Taiwan's large-cap listed universe had too few companies meeting both D/E < 0.5 and Piotroski >= 7 above the TWD 15B market cap threshold to reach the minimum 10-stock bar. The qualifying universe simply wasn't there.
Being in cash during 2000-2001 (SPY -14.8%, -20.8%) looks beneficial on paper. It wasn't a defensive call. It was a thin universe problem. The strategy missed the 2003-2006 SPY recovery period equally (SPY gained cumulative ~71% 2003-2006; this portfolio sat in cash and missed it entirely).
2008: The sharpest single-year demonstration
2008 is where the strategy's logic shows up most clearly. The portfolio lost -2.7% vs SPY's -26.1%. A 23.4-point gap. Taiwan's low-debt tech companies held up through the global financial crisis precisely because they didn't carry the leverage that amplified losses across banking and consumer sectors. D/E < 0.5 functioned as intended when credit stress hit globally.
This single year is the best evidence that the signal works. The problem is 2008 was an extreme event, and the strategy captures only 47 cents of the upside in normal years.
2013, 2022, 2023: The three investment years that worked
Outside of the 2008 protection, the strategy outperformed SPY meaningfully in only three invested years: 2013 (+2.7%), 2022 (+5.2%), and 2023 (+4.6%). These all shared a common trait: SPY was either modest or weak, and Taiwan's semiconductor supply chain was benefiting from specific demand cycles (2013 smartphone penetration, 2022 post-COVID chip demand normalization, 2023 AI accelerator orders).
The strategy picks up this performance when Taiwan's listed tech companies outperform on fundamentals, not when the market broadly rallies.
2024: The worst single-year excess in the study
2024 returned -12.2% for the portfolio vs SPY +14.7%, a -26.9% excess. This is the worst calendar year in relative terms in the entire 25-year run.
Taiwan's semiconductor stocks had a two-year rally in 2022-2023 on AI demand expectations. By mid-2024, a correction set in as investors rotated away from hardware into software and services names. The portfolio, full of Taiwan tech and hardware companies that qualified via D/E < 0.5, took the full force of that correction. SPY, dominated by US software and mega-cap tech, kept climbing.
Backtest Methodology
| Parameter | Choice |
|---|---|
| Universe | TAI + TWO, Market Cap > TWD 15B |
| Signal | D/E < 0.5, Piotroski F-Score >= 7 (computed from FY statements) |
| Portfolio | All qualifying, equal weight |
| Rebalancing | Annual (July) |
| Cash rule | Hold cash if < 10 qualify |
| Benchmark | S&P 500 Total Return (SPY) |
| Period | 2000-2025 (25 years, 25 annual periods) |
| Data lag | Point-in-time, 45-day lag for financial statements |
| Currency | TWD (portfolio) vs USD (SPY) |
Limitations
Seven cash periods compress the compounding base. The 2000-2006 cash periods mean the portfolio didn't benefit from the 2003-2006 global equity recovery. Any total return comparison to SPY is heavily distorted by those years in cash.
Sector concentration in semiconductors. Taiwan's qualifying universe isn't diversified. D/E < 0.5 disproportionately selects semiconductor and electronics companies. The portfolio behaves like a concentrated Taiwan tech fund, not a diversified market screen.
Currency mismatch. Returns are in TWD; SPY is in USD. TWD has appreciated roughly 10-15% against USD over the 25-year period, which slightly benefits the strategy in USD-adjusted terms. The data here uses local currency returns as reported, without currency adjustment.
Survivorship bias. Exchange membership uses current company profiles, not historical. Companies that were delisted during the backtest period may not be captured. This likely causes some upward bias in reported returns.
TTM screen vs backtest signal. The live SQL screen uses TTM financial ratios as a Piotroski proxy. The actual backtest computed Piotroski from FY year-over-year changes. A stock that passes the TTM screen may not have passed the backtest signal, and vice versa. Use the screen for candidate identification, not exact replication.
Takeaway
Taiwan's low-debt quality backtest illustrates one of the strategy's clearest structural limits: symmetric capture. Down capture of 50.61% and up capture of 47.41% produce nearly identical dampening in both directions. The result is a portfolio that doesn't crash as hard, but also doesn't compound as fast. Over 25 years, that asymmetry costs 4.54% annually versus SPY.
The 2008 crisis year (-2.7% vs -26.1%) is the one period where the signal delivered unmistakably. Outside of that, the performance record is thin. Taiwan is worth watching in periods of global stress. As a core long-term holding, the return profile doesn't support the case.
Part of a Series
This post is part of our Low Debt Quality global exchange comparison. We ran the same strategy across 15 exchanges worldwide: - Low Debt Quality on US Stocks - 7.09% CAGR, -29.77% max drawdown, 82.83% down capture - Low Debt Quality on Indian Stocks (BSE + NSE) - 14.05% CAGR, +6.22% excess - Low Debt Quality on Canadian Stocks (TSX) - +1.33% excess - Low Debt Quality on Swedish Stocks - +1.14% excess - Low Debt Quality on Swiss Stocks - best Sharpe in the study (0.429) - Low Debt Quality on German Stocks (XETRA) - European result - Low Debt Quality on UK Stocks (LSE) - LSE results - Low Debt Quality on Japanese Stocks (JPX) - JPX results - Low Debt Quality on Hong Kong Stocks (HKSE) - 91.71% down capture - Low Debt Quality on Thailand Stocks (SET) - 26.48% down capture - Low Debt Quality on China Stocks - bubble-era returns - Low Debt Quality: Global Exchange Comparison - all 15 exchanges
Run This Screen Yourself
The TTM screen SQL above is runnable directly on Ceta Research. Query the FMP financial data warehouse and filter by your own criteria. No setup required.
The full backtest code (Python + DuckDB) is on GitHub.
Part of a Series: Global | US | UK | Thailand | Switzerland | Sweden | Japan | India
Run It Yourself
Explore the data behind this analysis on Ceta Research. Query our financial data warehouse with SQL, build custom screens, and run your own backtests across 70,000+ stocks on 20 exchanges.
Data: Ceta Research, FMP financial data warehouse. Returns in TWD. Annual rebalance July, equal weight, 2000-2025.


