
Low Debt + Financial Health: Results Across 13 Global Exchanges

We ran a strict financial quality screen on 13 exchanges over a 25-year backtest window. Two filters: debt-to-equity below 0.5, and a Piotroski F-Score of 7 or higher. Annual rebalance each July. Equal weight, all qualifying stocks.
Contents
- Method
- Results by Exchange
- What Drives the Differences
- The Downside Protection Pattern
- Country Highlights
- What We Tested and What We Excluded
- Backtest Methodology
- Limitations
- Takeaway
- Part of a Series
The goal wasn't to find the highest-returning strategy. It was to find one that holds up when markets fall apart.
Here's what we found.
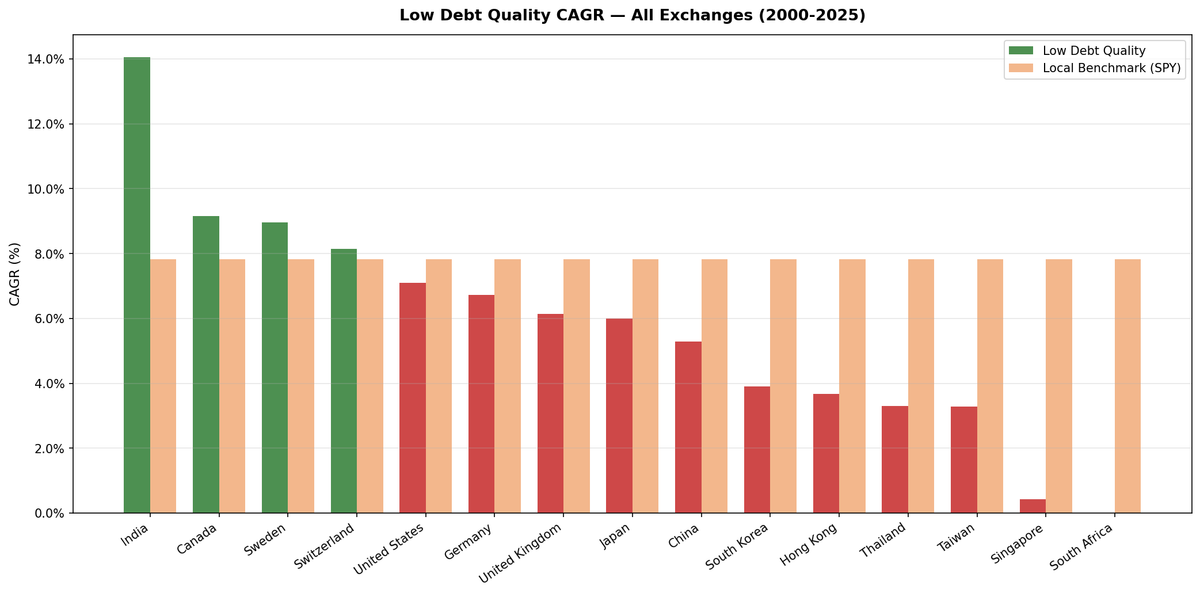
| Exchange | Country | CAGR | vs SPY | Sharpe | MaxDD | Down Capture | Avg Stocks |
|---|---|---|---|---|---|---|---|
| BSE_NSE | India | 14.05% | +6.22% | 0.336 | -17.99% | -2.02% | 141 |
| TSX | Canada | 9.16% | +1.33% | 0.356 | -31.65% | -13.01% | 35 |
| STO | Sweden | 8.97% | +1.14% | 0.312 | -34.74% | 64.57% | 22 |
| SIX | Switzerland | 8.14% | +0.30% | 0.429 | -36.50% | 69.27% | 23 |
| NYSE_NASDAQ_AMEX | US | 7.09% | -0.75% | 0.300 | -29.77% | 82.83% | 198 |
| XETRA | Germany | 6.72% | -1.11% | 0.264 | -38.84% | 89.44% | 48 |
| LSE | UK | 6.14% | -1.69% | 0.136 | -40.59% | 96.58% | 61 |
| JPX | Japan | 6.00% | -1.83% | 0.314 | -42.99% | 75.10% | 112 |
| SHZ_SHH | China | 5.28% | -2.55% | 0.084 | -55.77% | 11.37% | 307 |
| KSC | Korea | 3.91% | -3.92% | 0.063 | -26.89% | 31.43% | 39 |
| HKSE | Hong Kong | 3.67% | -4.17% | 0.030 | -35.10% | 91.71% | 62 |
| TAI_TWO | Taiwan | 3.29% | -4.54% | 0.164 | -25.08% | 50.61% | 58 |
| SET | Thailand | 3.30% | -4.53% | 0.048 | -36.32% | 26.48% | 25 |
SPY benchmark: 7.83% CAGR, -36.27% max drawdown. Each exchange is compared to SPY as a common benchmark.

Method
Each July, the screen selects all stocks that pass:
- D/E < 0.5 (debt-to-equity ratio below 0.5, using most recent fiscal year data available 45+ days before rebalance)
- Piotroski F-Score >= 7 (9-point financial health composite: profitability, leverage, operating efficiency)
No upper limit on the number of stocks. All qualifying companies are held at equal weight. The portfolio stays in cash during years where no stocks qualify. Each exchange uses a locally adjusted market cap threshold (not a flat $1B USD).
The Piotroski score uses nine binary signals from financial statements: positive net income, positive operating cash flow, improving ROA, operating cash flow exceeding net income (accruals), declining D/E, improving current ratio, no new share issuance, improving gross margin, and improving asset turnover. A score of 7 or higher means the company passes at least 7 of these 9 checks.
Results by Exchange
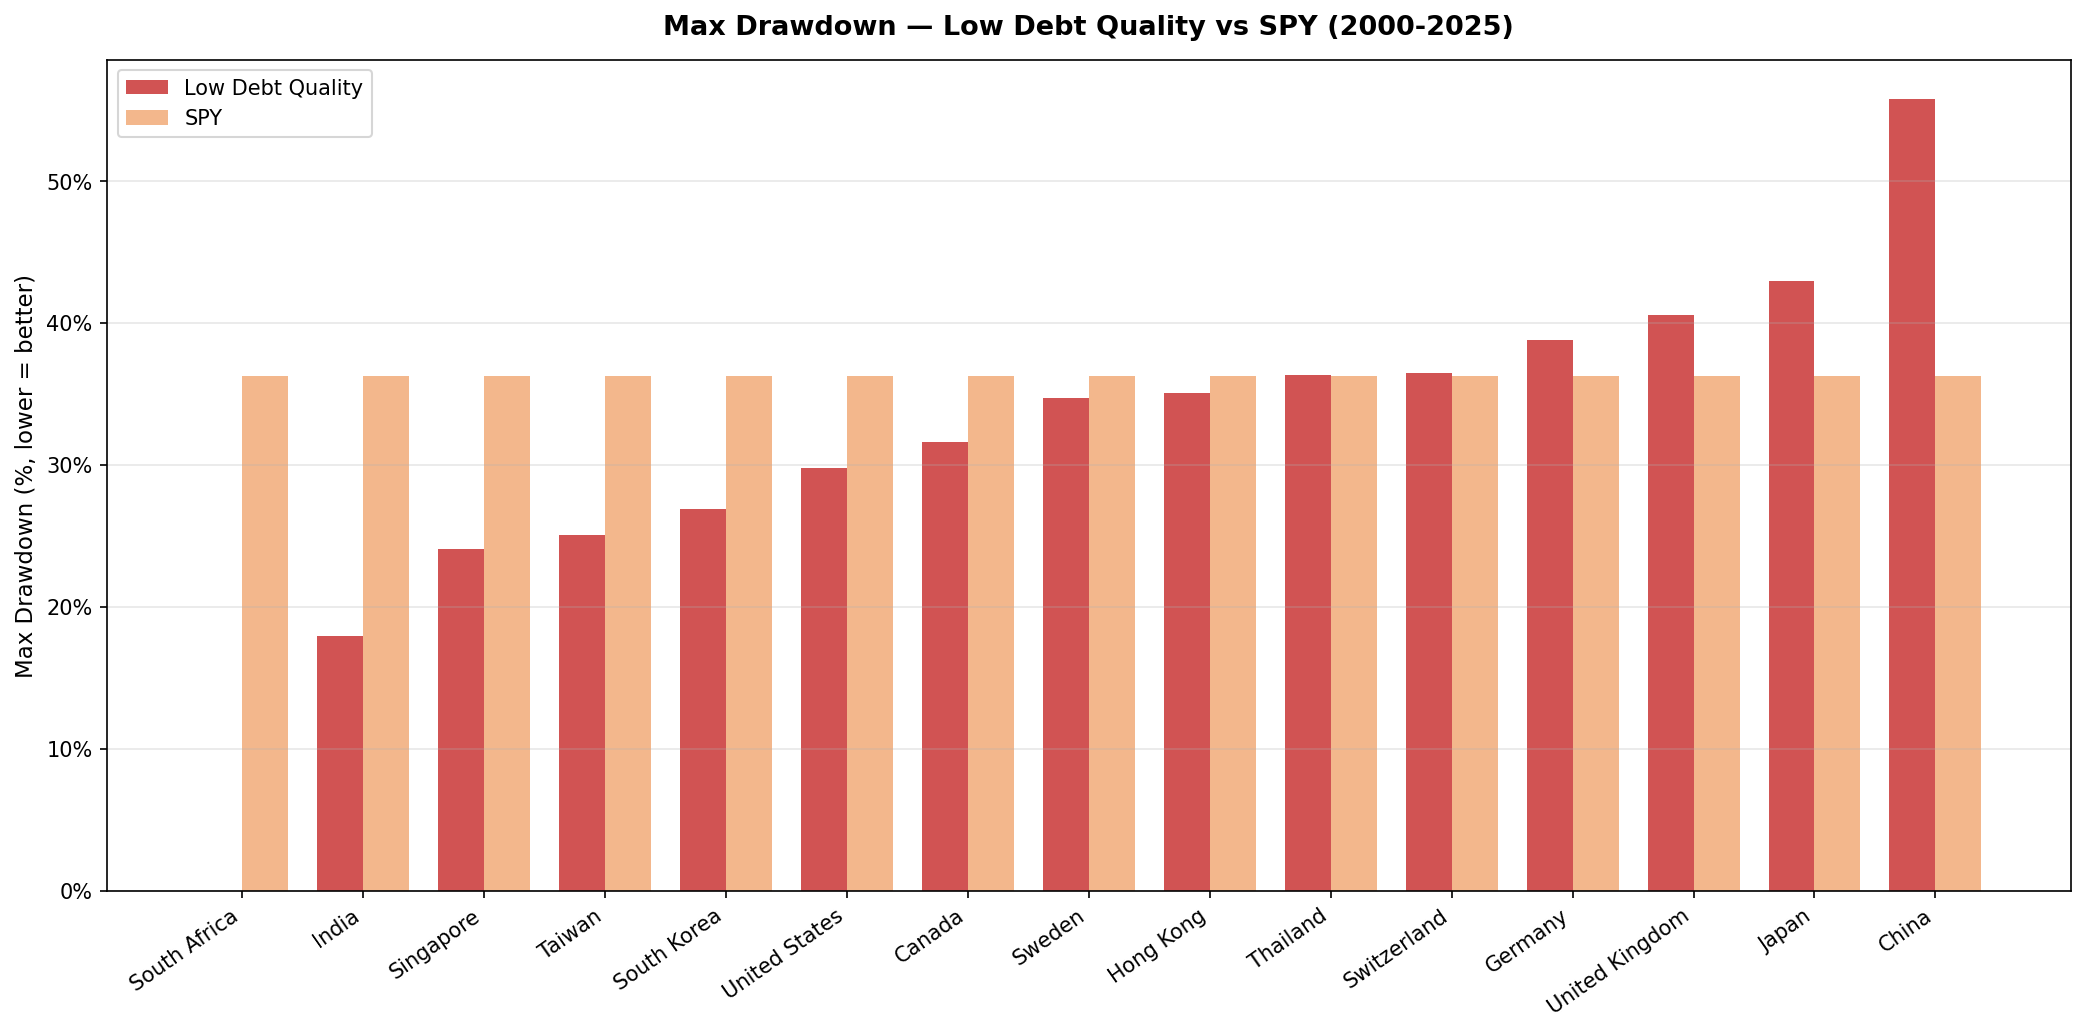
India is the global standout. 14.05% CAGR, +6.22% excess over SPY, -17.99% max drawdown versus SPY's -36.27%. Down capture of -2.02% means the portfolio actually rose slightly, on average, during months when SPY fell. Over 25 years, the filter had 141 qualifying stocks per year and was never in cash after the early 2000s.
Canada is the biggest surprise outside India. 9.16% CAGR, +1.33% excess, and a down capture of -13.01%. That's negative. The portfolio moved in the opposite direction to the market during down months. Canada's result is driven by the composition effect: Canadian resources and energy companies carry heavy debt loads. D/E < 0.5 eliminates a large chunk of the index, leaving a portfolio weighted toward industrial, tech, and consumer businesses that don't correlate with commodity cycles.
Sweden delivered 8.97% CAGR, +1.14% excess. 22 average stocks, 28% cash periods (mostly early 2000s when the Swedish market was small). Down capture of 64.57% shows meaningful protection in drawdowns.
Switzerland underperforms slightly on raw CAGR (+0.30% excess) but has the highest Sharpe ratio of any exchange at 0.429. That's the best risk-adjusted return globally. 23 stocks on average, 0% cash periods. Swiss large-cap industrials and pharma companies with low debt trade at stable valuations, which keeps volatility low.
The US is slightly below SPY at 7.09% vs 7.83%, with down capture of 82.83%. The filter works on a universe of 198 stocks on average, which is large and diversified. The underperformance comes mainly from missing mega-cap tech. In 2021, the portfolio returned -27.3% vs SPY -10.2%, largely because equal-weight quality got left behind by Magnificent 7 momentum. The downside protection still works: -29.77% max drawdown versus SPY's -36.27%.
Germany and UK both trail SPY by 1-2%. Germany: -1.11%, UK: -1.69%. The UK result is dragged partly by pound-denominated returns (returns calculated locally) and the post-2016 structural weight toward financials and energy in the FTSE 350, where D/E filtering removes more than it adds. UK down capture is 96.58%, which is the highest in the study. The filter offers minimal downside protection here.
Japan trails at -1.83% excess but has a reasonable Sharpe of 0.314 and down capture of 75.10%. Japan's corporate culture has shifted toward balance sheet discipline since the Bank of Japan's governance push. The 112 average qualifying stocks is high, suggesting the filter has good coverage. The underperformance is structural: Japanese equities have underperformed global benchmarks on an absolute basis.
China (Shanghai and Shenzhen combined) shows 5.28% CAGR, -2.55% excess. Down capture of 11.37% is the second-lowest in the study. When Chinese markets fall, low-debt quality companies fall much less. The max drawdown is the worst in the study at -55.77%, but that's driven by the A-share bubbles of 2006-2007 and 2014-2015. These aren't data errors. The 2006 annual return of +111.2% and 2014 annual return of +83.8% reflect genuine speculative episodes in China's domestic equity market, followed by equally dramatic corrections. The low-debt screen didn't protect against those drawdowns because the entire market moved together.
Korea has 36% cash periods due to the chaebol structure. Conglomerates like Samsung, Hyundai, and SK Group carry significant leverage by design. The D/E filter eliminates most of the major index constituents, leaving a thin and inconsistent investable universe. Korea is included for comparison, but the 36% cash makes it statistically weaker than the other markets.
Hong Kong, Taiwan, and Thailand all underperform SPY by 4-5%. Down captures vary: China is low (11.37%), Taiwan at 50.61%, Thailand at 26.48%. The common thread is that these markets don't show a strong relationship between low debt and outperformance. Market structure (state enterprise dominance in HK, tech-export concentration in Taiwan, commodity and tourism cycles in Thailand) explains most of it.
What Drives the Differences
The geographic pattern is consistent. The strategy works best where the D/E filter actually differentiates the investable universe from the benchmark.
In India, the filter removes leveraged public sector undertakings (power, infrastructure, steel) and debt-heavy infrastructure conglomerates that dominate the index. What remains is a set of quality private-sector companies with real earnings power. These companies have historically compounded well in India's high-growth environment.
In Canada, the filter removes the resource economy. Oil and gas, mining, and pipelines account for a large share of the TSX by market cap, and they carry structural leverage. The remaining companies trend toward financials, consumer, and industrials with lower debt sensitivity. This creates a portfolio that's genuinely defensive in commodity downturns.
In Switzerland and Sweden, the filter selects for a similar profile: industrial conglomerates and exporters that have historically maintained conservative balance sheets. The filter doesn't eliminate much of the core benchmark, but the companies that do pass tend to be higher quality than the local index average.
In Asia (Hong Kong, Korea, Taiwan, Thailand), the story is different. These markets have significant portions of their market cap in companies that are structurally leveraged: utilities, telecommunications, and state enterprises in HK; semiconductor manufacturers with heavy capex financing in Taiwan; chaebols in Korea. The D/E filter removes these companies, but the remaining universe doesn't have a consistent quality premium. The filter is exclusionary rather than selective.
The Downside Protection Pattern
Down capture tells you how much of a market decline the portfolio captured. A down capture below 100% means it fell less than the market. Below 0% means it actually rose when the market fell.
| Exchange | Down Capture |
|---|---|
| Canada | -13.01% |
| India | -2.02% |
| China | 11.37% |
| Sweden | 64.57% |
| Switzerland | 69.27% |
| Japan | 75.10% |
| US | 82.83% |
| Korea | 31.43% |
| Thailand | 26.48% |
| Taiwan | 50.61% |
| Hong Kong | 91.71% |
| Germany | 89.44% |
| UK | 96.58% |
Eleven of the 13 exchanges show down capture below 100%. The UK at 96.58% is the weakest. India and Canada are the only markets with negative down capture.
This pattern holds because the D/E filter removes the most financially fragile companies from the portfolio. Highly leveraged companies tend to fall hardest in downturns: their debt becomes harder to service, credit costs rise, and equity holders absorb the residual risk. A portfolio of low-leverage, financially healthy companies doesn't have that fragility.
The Piotroski component adds another layer. Companies with improving profitability, cash flow coverage of earnings, and no share dilution are less likely to be caught in earnings deterioration cycles during recessions.
The practical result: across almost every market tested, this strategy provides a meaningful cushion in bad years, even when it doesn't generate alpha in good ones.
Country Highlights
- Best CAGR: India (14.05%)
- Best Sharpe: Switzerland (0.429)
- Best downside protection: Canada (-13.01% down capture)
- Most consistent alpha: India and Canada (both positive excess, both with negative down capture)
- Largest average portfolio: China (307 stocks), India (141), US (198)
- Highest cash: Korea (36%), Sweden (28%), Taiwan (28%), Thailand (28%), India (20%)
- Worst drawdown: China (-55.77%), but driven by bubble events, not strategy failure
- Best drawdown: India (-17.99%), Korea (-26.89%, though mostly cash)
What We Tested and What We Excluded
13 exchanges included in this comparison: NYSE/NASDAQ/AMEX (US), BSE/NSE (India), STO (Sweden), SIX (Switzerland), XETRA (Germany), LSE (UK), JPX (Japan), SHZ/SHH (China), KSC (Korea), HKSE (Hong Kong), TAI/TWO (Taiwan), SET (Thailand), TSX (Canada).
Excluded from comparison:
- SES (Singapore): 52% cash across the backtest period, average 6.8 qualifying stocks per year. Not enough investable periods for statistical reliability.
- JNB (South Africa): 100% cash. South Africa's economy is heavily commodity and resource-driven. The resource sector carries high structural leverage, and the D/E filter eliminates nearly the entire investable universe.
Korea note: Korea is included in the comparison but is flagged as statistically weaker due to 36% cash periods. Results should be interpreted with that context.
Backtest Methodology
| Parameter | Value |
|---|---|
| Signal 1 | D/E < 0.5 (fiscal year, most recent 45+ days before rebalance) |
| Signal 2 | Piotroski F-Score >= 7 |
| Rebalance | Annual, July |
| Weighting | Equal weight |
| Portfolio | All qualifying stocks |
| Cash rule | 100% cash if zero stocks qualify |
| MCap threshold | Per-exchange (local currency, not flat $1B USD) |
| Benchmark | SPY (USD, total return) |
| Data | FMP financial statements + EOD price data |
| Period | 2000-2025 (varies by data availability per exchange) |
Limitations
The Piotroski F-Score requires nine signals from financial statements. In markets with thinner FMP coverage (Thailand, Korea), some early years may have fewer data points, which can affect stock counts and cash periods.
The strategy holds all qualifying stocks at equal weight. A portfolio of 307 equal-weight Chinese stocks behaves very differently in practice from a 23-stock Swiss portfolio. Transaction costs, liquidity, and market impact aren't modeled.
Exchange-rate effects: all returns are computed in local currency and compared to SPY in USD. This means currency performance is embedded in the results. Indian and Canadian excess returns partly reflect strong domestic currency performance during certain periods.
The Piotroski score is computed from fiscal-year data. Annual rebalance means we're using information that can be 12-18 months stale by the end of a hold period. This is realistic for a systematic strategy but creates lag in detecting financial deterioration.
Takeaway
Low Debt Quality is a downside protection strategy that sometimes generates alpha, depending on the market.
The downside protection is consistent. Eleven of 13 exchanges show down capture below 100%. The portfolio falls less than the market almost everywhere you test it.
The alpha is market-specific. India and Canada both show positive excess returns and negative down capture, the best combination you can ask for. Switzerland has the best Sharpe globally. Sweden is modestly positive.
In the US, Europe (outside Switzerland), Japan, and most of Asia, the strategy trails SPY on CAGR. But it does so with meaningfully lower drawdowns and more stable behavior in bad years.
For investors who care more about not losing money than about maximizing upside, this is the exchange-by-exchange verdict: the strategy works almost everywhere on the downside. Whether it generates alpha depends on whether your market's composition gives the D/E filter something real to do.
Part of a Series
This blog is the global overview. We've published dedicated analyses for each major market:
- Low Debt Quality: US Results
- Low Debt Quality: India Results
- Low Debt Quality: Canada Results
- Low Debt Quality: Germany Results
- Low Debt Quality: UK Results
- Low Debt Quality: Japan Results
- Low Debt Quality: Switzerland Results
- Low Debt Quality: Sweden Results
- Low Debt Quality: Hong Kong Results
- Low Debt Quality: China Results
- Low Debt Quality: Taiwan Results
- Low Debt Quality: Thailand Results
Backtest code: github.com/ceta-research/backtests
Run It Yourself
Explore the data behind this analysis on Ceta Research. Query our financial data warehouse with SQL, build custom screens, and run your own backtests across 70,000+ stocks on 20 exchanges.
Data: FMP warehouse, TTM metrics


