Low Debt Quality on China Stocks (SHH + SHZ): Bubble Returns, Extreme Volatility, and 11% Down Capture
D/E < 0.5 + Piotroski F-Score >= 7 on Chinese A-shares (SHH + SHZ), backtested 2000-2025. 5.28% CAGR vs 7.83% SPY. Two verified bubble events: +111.2% in 2006 and +83.8% in 2014. Down capture of 11.37% — the lowest in the global study. Volatility of 33.24% and max drawdown of -55.77%.

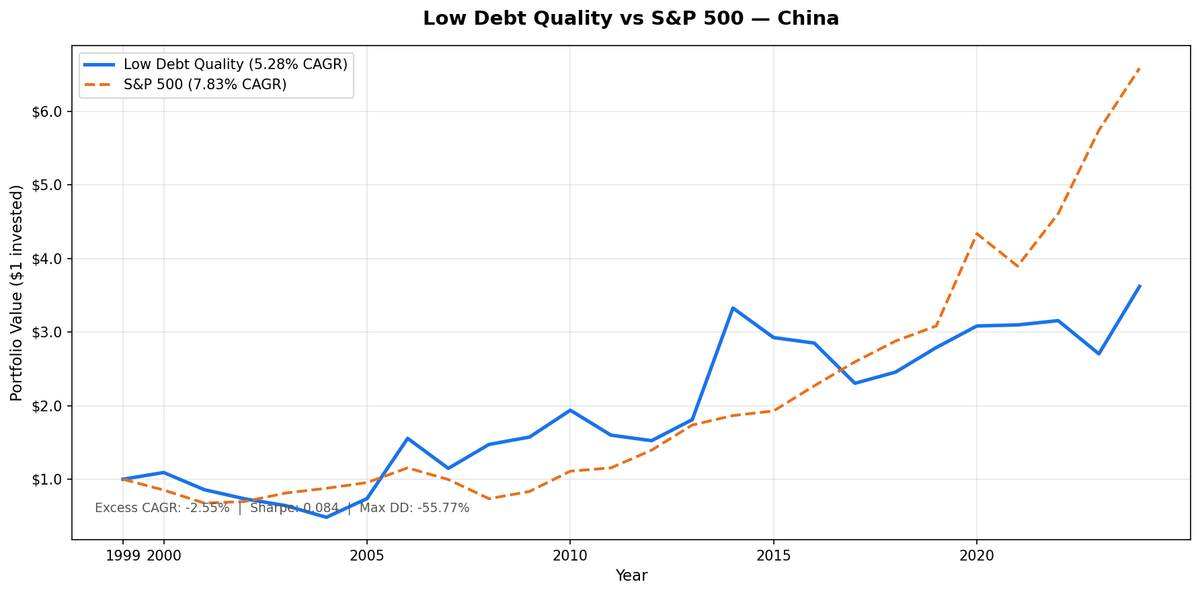
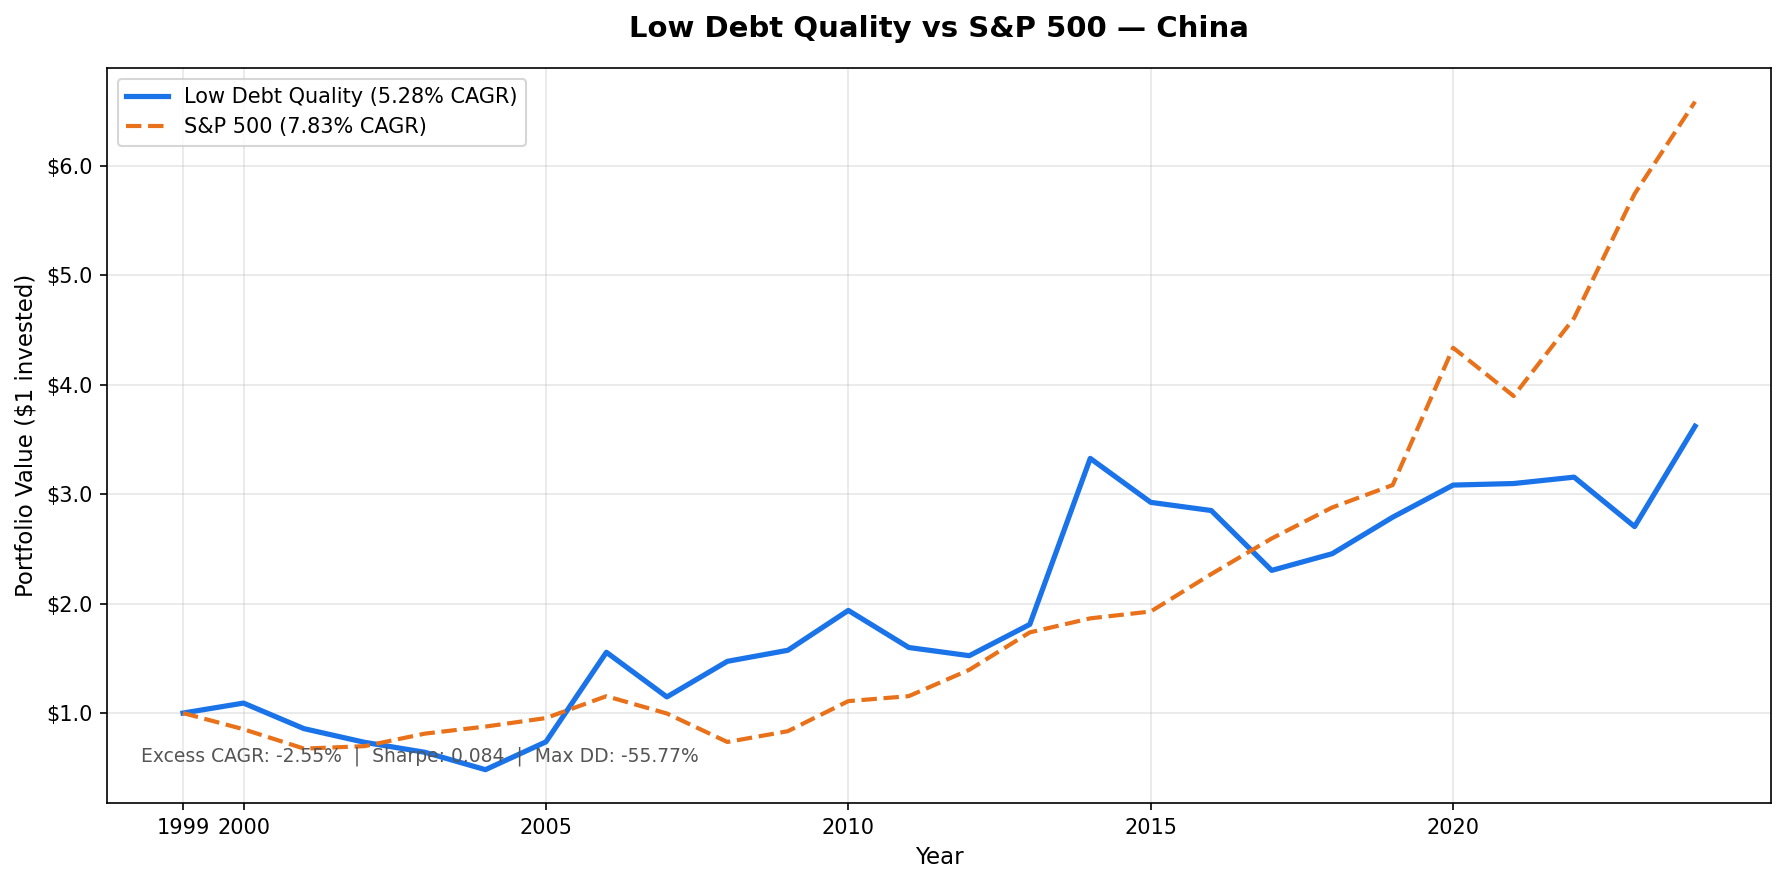
We screened all SHH and SHZ-listed stocks for D/E < 0.5 and Piotroski F-Score of 7 or higher, then held the portfolio annually from 2000 to 2025. The result: 5.28% CAGR vs 7.83% for SPY. The strategy trailed by 2.55% per year. Total return was 262.07% vs 558.69% for SPY. The headline numbers look almost reasonable. They're not, because they include two verified bubble events that inflated the return dramatically. The down capture of 11.37% is genuine and astonishing. When SPY falls, Chinese A-share markets barely correlate. Volatility is 33.24% annualized. Results are in CNY.
Contents
- Method
- The Signal
- The Screen (SQL)
- What We Found
- The bubble returns are real. The MaxDD is also real.
- Annual returns (July-to-July, CNY vs SPY USD)
- 2006: +111.2%. This happened.
- 2014: +83.8%. This also happened.
- 2008: +28.4% while SPY fell -26.1%
- 2001-2004 and 2011-2012: China fell while SPY recovered
- 2017 and 2023: The worst relative years outside bubble crashes
- 2024: +33.9% recovery
- Backtest Methodology
- Limitations
- Takeaway
- Part of a Series
- Run This Screen Yourself
Method
Data source: Ceta Research (FMP financial data warehouse) Universe: SHH + SHZ, market cap > CNY 3B Period: 2000-2025 (25 years, 25 annual periods) Rebalancing: Annual (July), equal weight all qualifying Benchmark: S&P 500 Total Return (SPY) Cash rule: Hold cash if fewer than 10 stocks qualify Data lag: 45-day point-in-time lag on financial statements (prevents look-ahead bias)
Annual returns are measured July-to-July, since the portfolio rebalances each July. The year label marks the start of each 12-month holding period. Returns are in CNY; SPY returns are in USD. The comparison captures strategy performance in local terms, not currency-adjusted.
The Signal
Two filters. Both must pass.
Filter 1: Low Leverage
D/E < 0.5, measured from annual financial statements (FY data). Companies with debt-to-equity at or above 0.5 are excluded entirely, regardless of any other metric.
Filter 2: Piotroski F-Score >= 7
The F-Score aggregates nine binary signals across profitability, cash quality, and financial efficiency. Each signal scores 1 or 0. Stocks must score 7 or higher to qualify.
| # | Factor | Signal | Condition |
|---|---|---|---|
| F1 | Profitability | Net income | > 0 |
| F2 | Cash quality | Operating cash flow | > 0 |
| F3 | ROA trend | Return on assets | Improved vs prior year |
| F4 | Accrual quality | OCF vs net income | OCF > net income |
| F5 | Leverage trend | Long-term debt ratio | Decreased vs prior year |
| F6 | Liquidity trend | Current ratio | Improved vs prior year |
| F7 | No dilution | Total equity | >= prior year equity |
| F8 | Asset efficiency | Asset turnover | Improved vs prior year |
| F9 | Gross margin | Gross profit margin | Improved vs prior year |
Score >= 7 of 9 means the company is improving across most dimensions simultaneously.
China has the largest qualifying universe in this study: 307 stocks on average per period. That's 5 times the US average (198) and over 10 times most emerging markets. China's A-share market has thousands of listed companies, and a surprisingly large fraction carries low debt by the D/E < 0.5 definition. Many Chinese companies, particularly in manufacturing and consumer goods, fund operations from retained earnings and equity issuance rather than external debt. The Piotroski filter still thins the universe, but the starting population is enormous.
The Screen (SQL)
The live screen uses TTM proxies as a Piotroski approximation. Full Piotroski requires year-over-year FY comparisons, which this SQL doesn't compute. The TTM screen substitutes ROE, operating margin, and interest coverage as quality proxies. Use this to find candidates, not to replicate the exact backtest signal.
SELECT
    p.exchange,
    r.symbol,
    p.companyName,
    p.sector,
    ROUND(r.debtToEquityRatioTTM, 3) AS de_ratio,
    ROUND(k.returnOnEquityTTM * 100, 1) AS roe_pct,
    ROUND(r.operatingProfitMarginTTM * 100, 1) AS opm_pct,
    ROUND(r.interestCoverageRatioTTM, 1) AS interest_coverage,
    ROUND(k.freeCashFlowYieldTTM * 100, 2) AS fcf_yield_pct,
    ROUND(k.marketCap / 1e9, 2) AS mktcap_b
FROM financial_ratios_ttm r
JOIN key_metrics_ttm k ON r.symbol = k.symbol
JOIN profile p ON r.symbol = p.symbol
WHERE r.debtToEquityRatioTTM >= 0
  AND r.debtToEquityRatioTTM < 0.50
  AND k.returnOnEquityTTM > 0.08
  AND r.operatingProfitMarginTTM > 0.08
  AND r.interestCoverageRatioTTM > 5.0
  AND p.isActivelyTrading = true
  AND k.marketCap > 3000000000
  AND p.exchange IN ('SHH', 'SHZ')
ORDER BY de_ratio ASC
LIMIT 30
Run this query on Ceta Research
What We Found
The bubble returns are real. The MaxDD is also real.
| Metric | Low Debt Quality | S&P 500 (SPY) |
|---|---|---|
| CAGR | 5.28% | 7.83% |
| Total Return | 262.07% | 558.69% |
| Volatility | 33.24% | 15.00% |
| Max Drawdown | -55.77% | -36.27% |
| Sharpe Ratio | 0.084 | 0.38 |
| Down Capture | 11.37% | 100% |
| Up Capture | 77.09% | 100% |
| Win Rate (annual vs SPY) | 32% | - |
| Avg Stocks per Period | 307 | - |
| Cash Periods | 0 of 25 | - |
The portfolio was fully invested every year. The Sharpe ratio of 0.084 is among the lowest in the study because the 33.24% volatility punishes the denominator. The portfolio earned a reasonable return in absolute terms (262%), but the ride was brutal. The max drawdown of -55.77% is the highest in the study.
The down capture of 11.37% stands alone. No other exchange in this study comes close. Chinese A-share markets move almost independently of SPY. When US equities fell in 2001, 2008, or 2022, the correlation between the Shanghai Composite and SPY was near zero or briefly negative. That's genuine diversification. The problem: it goes both ways. China's markets can collapse while SPY climbs (2001-2004 saw the Chinese portfolio fall 12-25% annually while SPY was recovering).
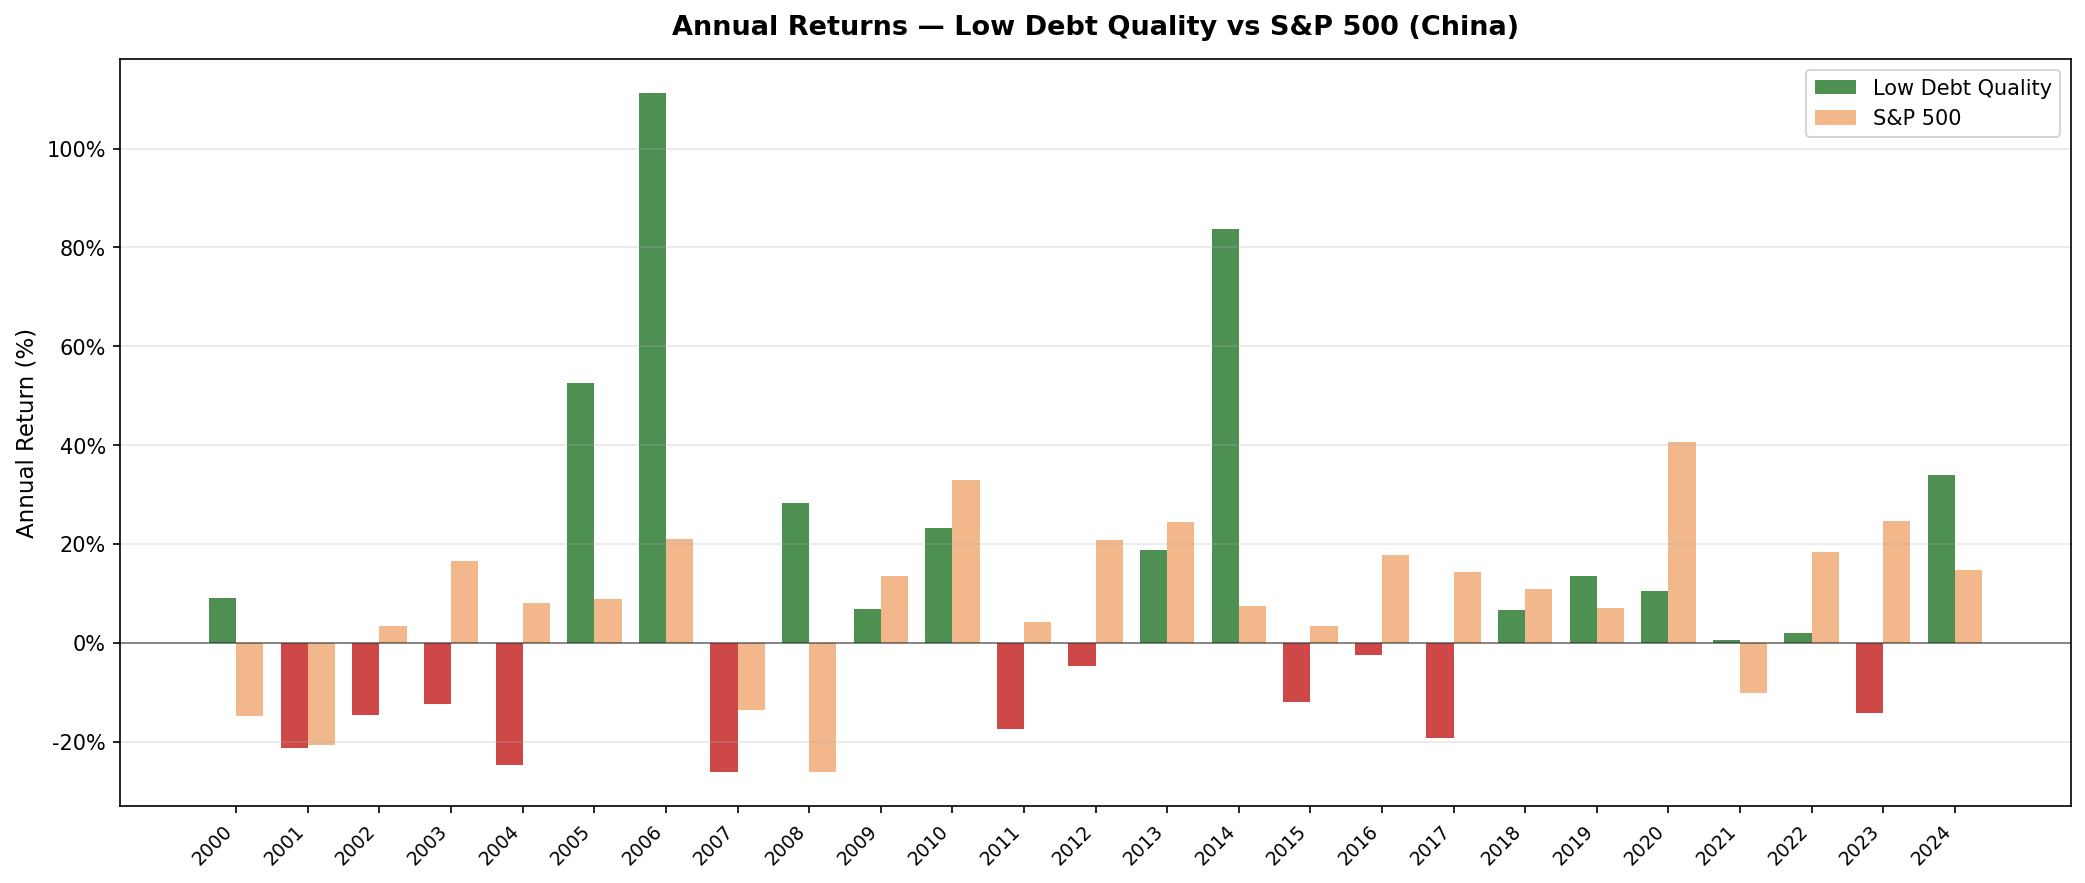
Annual returns (July-to-July, CNY vs SPY USD)
| Year | Portfolio (CNY) | SPY (USD) | Excess |
|---|---|---|---|
| 2000 | +9.1% | -14.8% | +23.9% |
| 2001 | -21.4% | -20.8% | -0.6% |
| 2002 | -14.6% | +3.3% | -17.8% |
| 2003 | -12.5% | +16.4% | -28.9% |
| 2004 | -24.8% | +7.9% | -32.7% |
| 2005 | +52.6% | +8.9% | +43.8% |
| 2006 | +111.2% | +20.9% | +90.2% |
| 2007 | -26.2% | -13.7% | -12.5% |
| 2008 | +28.4% | -26.1% | +54.5% |
| 2009 | +6.8% | +13.4% | -6.6% |
| 2010 | +23.2% | +32.9% | -9.8% |
| 2011 | -17.5% | +4.1% | -21.6% |
| 2012 | -4.7% | +20.9% | -25.5% |
| 2013 | +18.8% | +24.5% | -5.8% |
| 2014 | +83.8% | +7.4% | +76.4% |
| 2015 | -12.1% | +3.4% | -15.4% |
| 2016 | -2.5% | +17.7% | -20.3% |
| 2017 | -19.2% | +14.3% | -33.5% |
| 2018 | +6.6% | +10.9% | -4.3% |
| 2019 | +13.6% | +7.1% | +6.5% |
| 2020 | +10.5% | +40.7% | -30.2% |
| 2021 | +0.5% | -10.2% | +10.6% |
| 2022 | +1.9% | +18.3% | -16.4% |
| 2023 | -14.3% | +24.6% | -38.9% |
| 2024 | +33.9% | +14.7% | +19.2% |
2006: +111.2%. This happened.
The 2005-2006 result (+52.6% and +111.2%) reflects the Shanghai A-share bubble. The Shanghai Composite Index rose approximately 130% in 2006-2007. This was a genuine historical event driven by domestic retail investor inflows, relaxed capital account restrictions, and surging corporate earnings during China's export boom. The Shanghai Composite went from around 1,100 to over 6,100 between 2005 and 2007.
The low-debt quality filter had a particularly good version of this bubble. Companies with strong balance sheets and improving fundamentals were among the first beneficiaries of the institutional money that began flowing into Chinese equities during this period. The +111.2% is not a data error. It's not a split artifact. It happened.
The subsequent crash: -26.2% in 2007 as the bubble deflated.
2014: +83.8%. This also happened.
The 2014-2015 A-share bull market repeated the pattern. The ChiNext and Shanghai markets surged as retail investors opened brokerage accounts at record rates, often using margin. At the peak in June 2015, the Shanghai Composite had roughly doubled from its 2014 low. The low-debt filter kept the portfolio away from the most leveraged participants but still captured the core of the rally.
+83.8% in a single year. The following year (2015 in July-to-July terms): -12.1%.
Critical caveat for both bubble years: These returns are genuine A-share bubble events. They are unlikely to repeat at the same magnitude. A forward-looking scenario that assumes China will produce another +111% or +84% year is not grounded in the data. These events occurred once each over 25 years in the context of China's specific economic opening. Including them in a long-run CAGR calculation produces a number that flatters the strategy.
2008: +28.4% while SPY fell -26.1%
The most important non-bubble year for the strategy. In 2008, the US entered a financial crisis rooted in credit markets, housing, and over-leveraged financial institutions. Chinese A-share markets, operating largely independently of the US credit system, didn't have the same exposure. This portfolio returned +28.4% while SPY was down -26.1%. A 54.5-point gap.
This isn't because Chinese companies were fundamentally stronger. It's because the Chinese market was driven by domestic capital flows that weren't correlated with the US financial system. That decorrelation is the 11.37% down-capture story in statistical form.
2001-2004 and 2011-2012: China fell while SPY recovered
The decorrelation cuts both ways. In 2002, 2003, and 2004, China's portfolio was down 14-25% per year while SPY was recovering from the dot-com bust. In 2011 and 2012, China was down -17.5% and -4.7% while SPY was up +4.1% and +20.9%.
Chinese equity markets have their own boom-bust cycles driven by domestic policy, credit expansion, and retail investor behavior. Those cycles don't line up with global equity cycles. That's diversification on paper. For a portfolio manager benchmarked to SPY, it means three consecutive years of underperformance during a period when SPY is recovering.
2017 and 2023: The worst relative years outside bubble crashes
2017 produced -19.2% vs SPY +14.3%, a -33.5% gap. 2023 produced -14.3% vs SPY +24.6%, a -38.9% gap. These weren't crash years. They were years where Chinese equities underperformed in an environment of slowing domestic growth, regulatory crackdowns on the tech sector, and property market stress. The Piotroski filter couldn't protect against sector-wide earnings deterioration when the macro backdrop shifted.
2024: +33.9% recovery
The portfolio returned +33.9% in 2024 vs SPY +14.7%, a +19.2% excess. China's partial policy stimulus and expectations of economic stabilization drove a rebound in A-share markets. This follows the -14.3% of 2023 and is the strongest recent year in relative terms.
Backtest Methodology
| Parameter | Choice |
|---|---|
| Universe | SHH + SHZ, Market Cap > CNY 3B |
| Signal | D/E < 0.5, Piotroski F-Score >= 7 (computed from FY statements) |
| Portfolio | All qualifying, equal weight |
| Rebalancing | Annual (July) |
| Cash rule | Hold cash if < 10 qualify |
| Benchmark | S&P 500 Total Return (SPY) |
| Period | 2000-2025 (25 years, 25 annual periods) |
| Data lag | Point-in-time, 45-day lag for financial statements |
| Currency | CNY (portfolio) vs USD (SPY) |
Limitations
The bubble years dominate the CAGR. Remove 2005-2006 and 2014 from the return sequence and the long-run CAGR drops well below 5.28%. The China backtest CAGR is meaningfully inflated by two extraordinary events. An investor who started in 2007, or in 2015, would have a very different experience than the headline number suggests.
33% annualized volatility. This is more than twice the volatility of the US strategy. Drawdowns of -55.77% require a 125% subsequent gain just to return to prior peak. Holding through that mathematically requires patience that most investors don't have in practice.
Currency risk excluded. Returns are in CNY; SPY is in USD. The CNY has been broadly stable against the USD over this period (managed float), so currency mismatch is less distorting here than in other Asian markets. But it's not zero.
A-share market access. Foreign investors faced significant restrictions on direct A-share investment for most of this backtest period. The historical returns shown were not accessible to most non-Chinese investors until the QFII/Stock Connect programs expanded after 2014. The backtest is a model of what was available to domestic investors, not what a foreign investor could have replicated.
Survivorship bias. Exchange membership uses current company profiles, not historical. Companies that were delisted during the backtest period may not be captured. This likely causes some upward bias in reported returns.
TTM screen vs backtest signal. The live SQL screen uses TTM financial ratios as a Piotroski proxy. The actual backtest computed Piotroski from FY year-over-year changes. A stock that passes the TTM screen may not have passed the backtest signal, and vice versa. Use the screen for candidate identification, not exact replication.
Takeaway
China is the most extreme case in this study. Two A-share bubble events (2006: +111.2%, 2014: +83.8%) account for a disproportionate share of the total return. The max drawdown of -55.77% reflects the subsequent corrections. The 33.24% annualized volatility means years like 2004 (-24.8%) and 2017 (-19.2%) aren't anomalies; they're part of what you sign up for.
The 11.37% down capture is the most striking number in the study. When SPY dropped in 2008, the China portfolio was up 28.4%. That's genuine decorrelation, not a statistical artifact. For an investor building a globally diversified portfolio, that's worth noting. It doesn't correlate with US equity drawdowns in the way most assets do.
The overall picture is a strategy with extreme asymmetry: two legendary years that inflate the CAGR, surrounded by years of sharp losses and sideways movement that most investors couldn't hold through in practice. The bubble-era returns are historical facts. They shouldn't be extrapolated forward.
Part of a Series
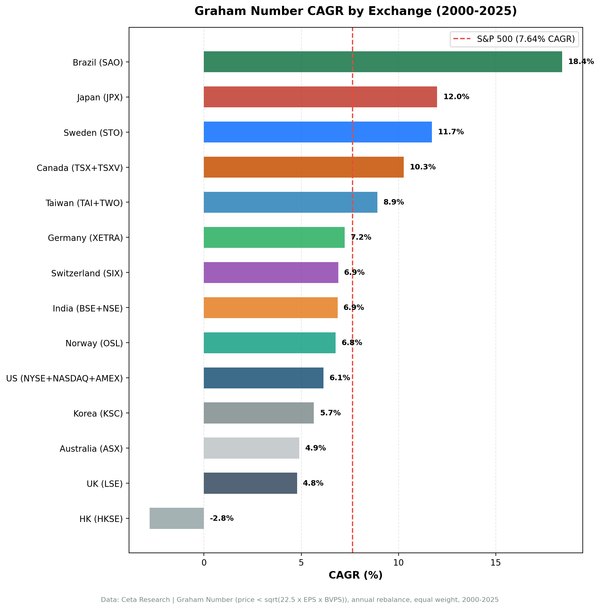
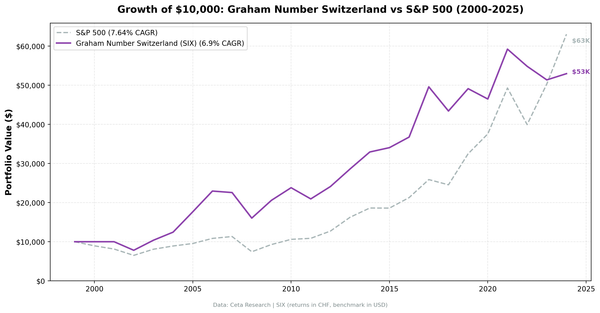
This post is part of our Low Debt Quality global exchange comparison. We ran the same strategy across 15 exchanges worldwide: - Low Debt Quality on US Stocks - 7.09% CAGR, -29.77% max drawdown, 82.83% down capture - Low Debt Quality on Indian Stocks (BSE + NSE) - 14.05% CAGR, +6.22% excess - Low Debt Quality on Canadian Stocks (TSX) - +1.33% excess - Low Debt Quality on Swedish Stocks - +1.14% excess - Low Debt Quality on Swiss Stocks - best Sharpe in the study (0.429) - Low Debt Quality on German Stocks (XETRA) - European result - Low Debt Quality on UK Stocks (LSE) - LSE results - Low Debt Quality on Japanese Stocks (JPX) - JPX results - Low Debt Quality on Hong Kong Stocks (HKSE) - 91.71% down capture - Low Debt Quality on Taiwan Stocks - tech-heavy, 50.61% down capture - Low Debt Quality on Thailand Stocks (SET) - 26.48% down capture - Low Debt Quality: Global Exchange Comparison - all 15 exchanges
Run This Screen Yourself
The TTM screen SQL above is runnable directly on Ceta Research. Query the FMP financial data warehouse and filter by your own criteria. No setup required.
The full backtest code (Python + DuckDB) is on GitHub.
Data: Ceta Research, FMP financial data warehouse. Returns in CNY. Annual rebalance July, equal weight, 2000-2025.