
Graham Number on Nasdaq Stockholm: 11.61% CAGR, Best Win Rate of 13 Exchanges

Graham Number on Nasdaq Stockholm: 11.61% CAGR and the Best Win Rate of 13 Exchanges
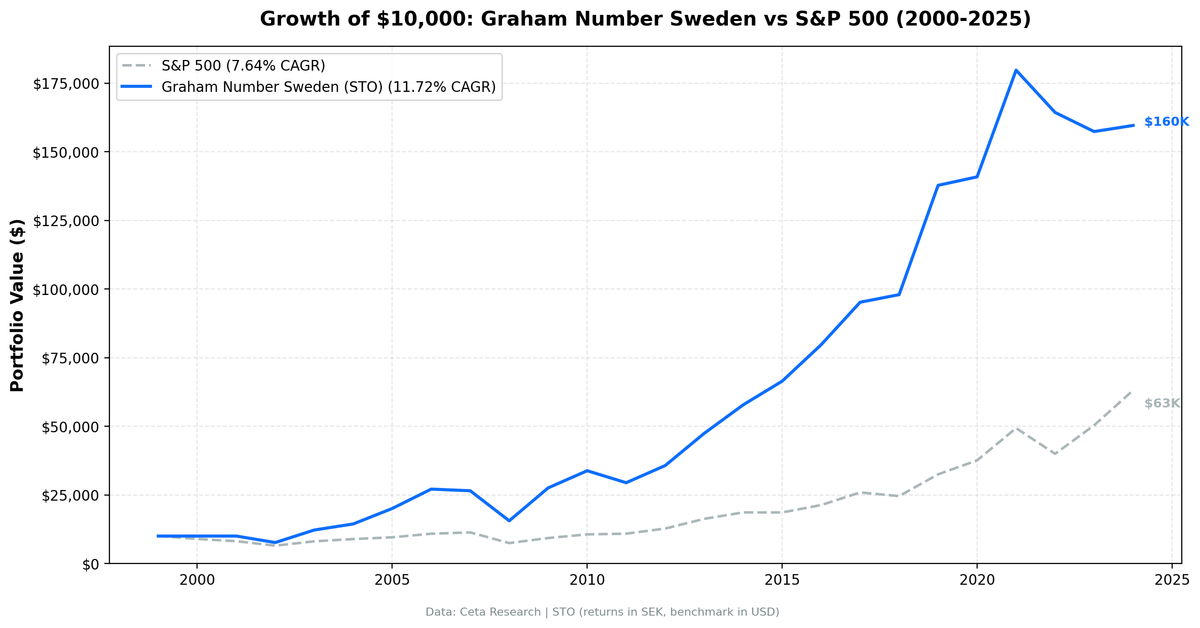
Sweden beats the OMX Stockholm 30 in 20 of 25 years. That's an 80% win rate, the highest of any exchange we've tested in the Graham Number series. The strategy returned 11.61% annually from 2000 to 2024 vs 2.95% for the OMX Stockholm 30. Excess CAGR: +8.65%.
Contents
- Method
- What We Found
- Year by Year
- The Asymmetric Profile
- Run It Yourself
- Full Annual Returns
- Limitations
- Part of a Series
The number that explains the outperformance isn't the raw return. It's the asymmetry: 149.4% up capture and 43.8% down capture. In rising markets, Sweden's Graham Number portfolio captures significantly more than the benchmark. In falling markets, it absorbs less than half the damage. That combination compounded into a 1,457% total return in SEK over 25 years, vs 107% for the OMX.
Method
Data source: Ceta Research (FMP financial data warehouse) Universe: Nasdaq Stockholm (STO), size-tiered market cap filter Period: 2000–2024 (25 annual rebalance periods) Rebalancing: Annual (January), equal weight top 30 by deepest discount to Graham Number Benchmark: OMX Stockholm 30 Cash rule: Hold cash if fewer than 10 stocks qualify Transaction costs: Size-tiered model
| Parameter | Value |
|---|---|
| Signal | Price < Graham Number (sqrt(22.5 × EPS × BVPS)) |
| P/E threshold | < 15 |
| P/B threshold | < 1.5 |
| ROE | > 10% |
| D/E | < 1.0 |
| Ranking | Deepest discount to Graham Number first |
| Portfolio size | Top 30, equal weight |
| Data lag | 45-day filing lag (FY data) |
Historical financial data with 45-day lag. Full methodology: backtests/METHODOLOGY.md
What We Found
| Metric | Portfolio | OMX Stockholm 30 |
|---|---|---|
| CAGR | 11.61% | 2.95% |
| Excess CAGR | +8.65% | — |
| Total Return | 1,457.2% | 107.0% |
| Max Drawdown | -42.59% | — |
| Volatility (ann.) | 25.65% | — |
| Sharpe Ratio | 0.381 | — |
| Sortino Ratio | 0.897 | — |
| Calmar Ratio | 0.275 | — |
| Beta | 1.095 | 1.00 |
| Alpha | 8.56% | — |
| Up Capture | 149.4% | — |
| Down Capture | 43.8% | — |
| Win Rate (vs OMX) | 80.0% | — |
| Cash Periods | 2/25 | — |
| Avg Stocks | 27.3 | — |
The two cash periods are 2000 and 2001, when early Nasdaq Stockholm data didn't yield 10+ qualifying stocks. From 2002 onward the portfolio was fully invested every year.
Volatility at 25.65% is higher than a broad Swedish index, which is expected. Swedish small and mid caps are more volatile than a large-cap benchmark. What matters is that the Sharpe ratio (0.381) comfortably exceeds the benchmark's return per unit of risk.

Year by Year
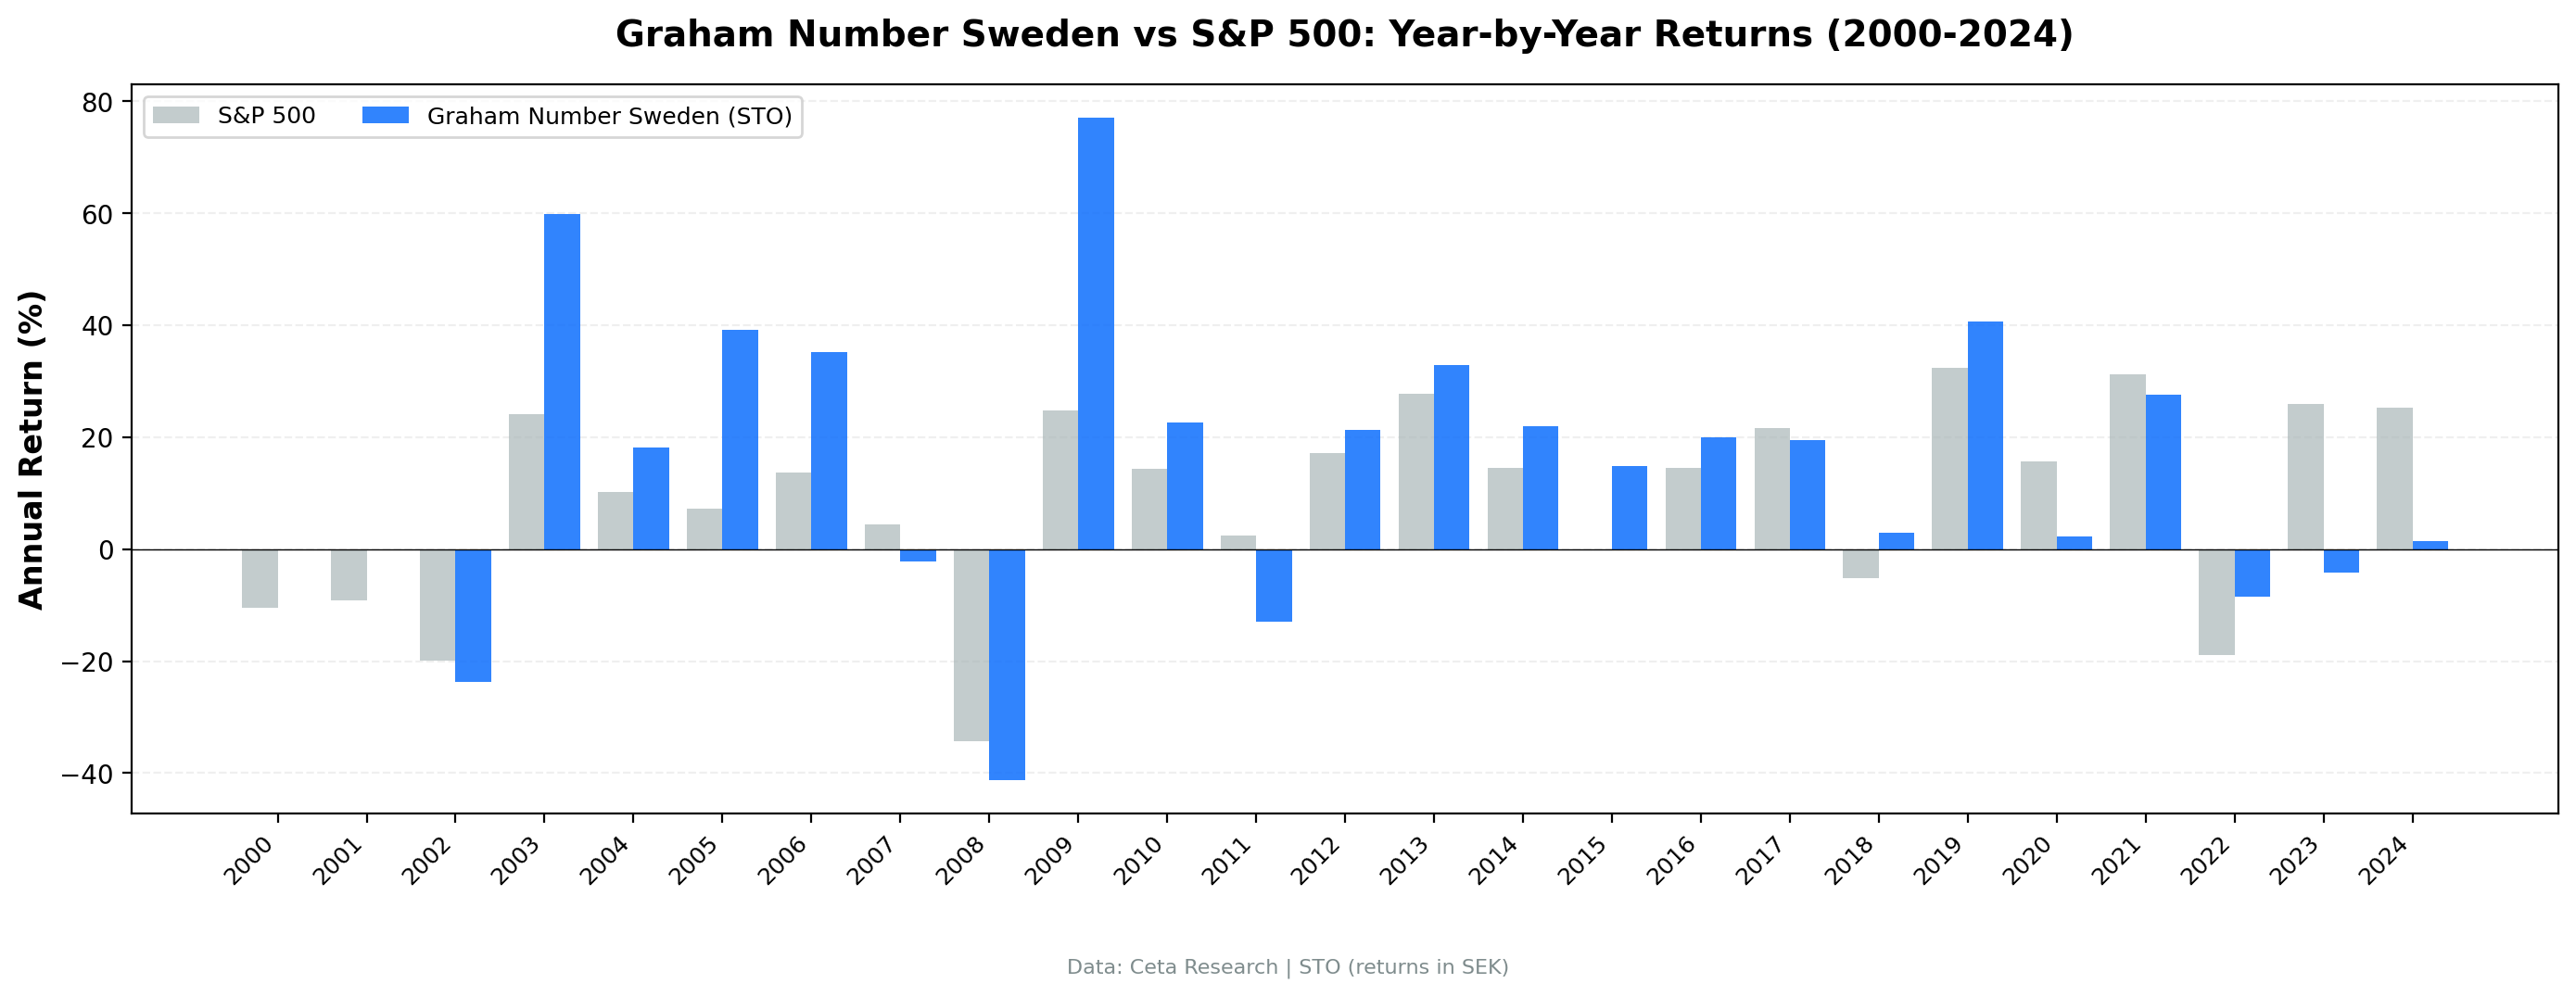
The 2009 recovery is the defining year. The portfolio returned +77.1% vs +38.9% for the OMX, a +38.2% excess. Swedish industrials and cyclicals whose P/Es and P/Bs compressed sharply in 2008 bounced hard when credit conditions stabilized. The Graham Number screen had loaded up on exactly those names.
2003: +53.4% vs +25.2% (+28.2%). Same pattern as 2009, one cycle earlier. Post-bubble recovery in cheap Swedish cyclicals.
2005 and 2006: Back-to-back strong years. +39.1% (+10.2% excess) then +35.2% (+14.4% excess). This mid-decade run reflects the broader European value rally, but the Graham Number's deep-discount ranking concentrated exposure in the cheapest names, amplifying the move.
2013 and 2014: +32.9% and +21.9%, both ahead of the OMX by wide margins (+15.6% and +11.4%). The portfolio held up through a period when many non-US value strategies were struggling.
2015: +14.9% vs -4.7% for the OMX. One of the cleaner demonstrations. The local benchmark was down; Sweden's cheap stocks were up 15%.
2018: +2.9% vs -11.0% for the OMX. Positive in a negative year. The down-capture math showed up in practice: the OMX fell 11%, the portfolio made money.
2022: -8.6% vs -15.1% for the OMX. The rate-hike year. Down capture in action again. The OMX lost 15%; Sweden's Graham Number portfolio lost roughly half that.
Then the recent lag. 2023: -4.2% vs +15.4% (-19.6% excess). 2024: +1.4% vs +4.8% (-3.3% excess). Two years of underperformance, though much milder against the local benchmark than it appeared against SPY. The reasons are structural: global momentum in growth and AI names, and a broader shift away from cyclicals and industrials.
The Asymmetric Profile
The central story of this backtest is the capture ratio pair: 149.4% up capture and 43.8% down capture.
Here's what those numbers mean in practice. In years when the OMX rose, the Swedish portfolio rose 49.4% more. In years when the OMX fell, the portfolio fell only 43.8% as much. That asymmetry compounds powerfully over time. A strategy that captures extra upside and limits downside doesn't need to win every year to generate meaningful long-term outperformance.
The 80% win rate (20 of 25 years ahead of the OMX) is consistent with this profile. It doesn't win in every single year, but it wins far more often than it loses, and when it does lose, the gaps tend to be small.
Why does this work in Sweden? Nasdaq Stockholm has a composition that suits Graham's formula. The market is heavy in industrials, materials, engineering companies, and financials, sectors with tangible assets and cyclical earnings. These companies generate high book values and moderate P/E ratios. During downturns, their multiples compress further below their Graham Numbers, which is precisely when the annual rebalance loads up on them. The subsequent recovery is where the 149% up capture comes from.
It's a different market structure than a cap-weighted index dominated by a handful of large names. The Graham Number screen finds the cheaper, smaller companies that the index underweights.
Run It Yourself
git clone https://github.com/ceta-research/backtests.git
cd backtests

python3 graham-number/backtest.py --preset sweden --output results.json --verbose
python3 graham-number/screen.py --preset sweden
Or run the screen live against current data:
-- Graham Number screen: Nasdaq Stockholm (current data)
SELECT
    s.symbol,
    p.companyName,
    p.sector,
    ROUND(r.priceToEarningsRatioTTM, 2)   AS pe_ttm,
    ROUND(r.priceToBookRatioTTM, 2)        AS pb_ttm,
    ROUND(SQRT(22.5 / NULLIF(r.priceToEarningsRatioTTM, 0)
               / NULLIF(r.priceToBookRatioTTM, 0)), 3) AS graham_ratio,
    ROUND(r.returnOnEquityTTM * 100, 1)   AS roe_pct,
    ROUND(r.debtToEquityRatioTTM, 2)      AS de,
    ROUND(k.marketCap / 1e9, 2)           AS mktcap_b_sek
FROM financial_ratios_ttm r
JOIN key_metrics_ttm k   ON r.symbol = k.symbol
JOIN profile p           ON r.symbol = p.symbol
WHERE p.exchange = 'STO'
  AND r.priceToEarningsRatioTTM > 0
  AND r.priceToEarningsRatioTTM < 15
  AND r.priceToBookRatioTTM     > 0
  AND r.priceToBookRatioTTM     < 1.5
  AND r.returnOnEquityTTM       > 0.10
  AND r.debtToEquityRatioTTM    < 1.0
ORDER BY r.priceToEarningsRatioTTM ASC
LIMIT 30
Run Sweden Graham Number screen live →
Full Annual Returns
| Year | Portfolio | OMX Stockholm 30 | Excess |
|---|---|---|---|
| 2000 | 0.00% (cash) | -14.0% | +14.0% |
| 2001 | 0.00% (cash) | -20.1% | +20.1% |
| 2002 | -23.7% | -38.2% | +14.5% |
| 2003 | +53.4% | +25.2% | +28.2% |
| 2004 | +20.0% | +16.0% | +4.0% |
| 2005 | +39.1% | +28.8% | +10.2% |
| 2006 | +35.2% | +20.8% | +14.4% |
| 2007 | -2.2% | -9.1% | +6.9% |
| 2008 | -41.3% | -34.4% | -6.8% |
| 2009 | +77.1% | +38.9% | +38.2% |
| 2010 | +22.7% | +22.1% | +0.5% |
| 2011 | -12.9% | -15.1% | +2.1% |
| 2012 | +21.3% | +13.1% | +8.2% |
| 2013 | +32.9% | +17.2% | +15.6% |
| 2014 | +21.9% | +10.5% | +11.4% |
| 2015 | +14.9% | -4.7% | +19.7% |
| 2016 | +20.0% | +9.5% | +10.5% |
| 2017 | +19.4% | +3.5% | +15.9% |
| 2018 | +2.9% | -11.0% | +13.9% |
| 2019 | +40.7% | +28.6% | +12.0% |
| 2020 | +2.2% | +4.8% | -2.6% |
| 2021 | +27.6% | +28.9% | -1.4% |
| 2022 | -8.6% | -15.1% | +6.5% |
| 2023 | -4.2% | +15.4% | -19.6% |
| 2024 | +1.4% | +4.8% | -3.3% |
Limitations
Volatility is real. At 25.65% annualized, this is a volatile strategy. The -42.59% max drawdown in 2008 occurred within a single calendar year. Investors running this need tolerance for sharp short-term swings.
2023 lag is significant. A -19.6% gap in a single year is a meaningful test of conviction. If you started this strategy in 2022, the 2023 experience was difficult, though the 2022 down-capture protection partly offset it.
Survivorship bias risk. Historical FMP data for smaller Swedish companies may underrepresent delisted or failed companies from the early 2000s. If the data skews toward survivors, early-period returns could be slightly overstated.
Part of a Series
This is one result from a 13-exchange study applying the Graham Number strategy to international markets.
- US analysis → — The baseline: 30 years of US data
- Japan analysis → — The value market case
- Global comparison → — All 13 exchanges, side by side
Data: Ceta Research (FMP financial data warehouse), 2000–2024. Universe: Nasdaq Stockholm (STO). Returns in SEK. Benchmark: OMX Stockholm 30. Full methodology: METHODOLOGY.md. Past performance does not guarantee future results.


