
Graham Number on Japan: 11.59% CAGR, +8.64% Above the Nikkei Over 25 Years

Graham Number on Japan: 11.59% CAGR Over 25 Years, +8.64% Above the Nikkei
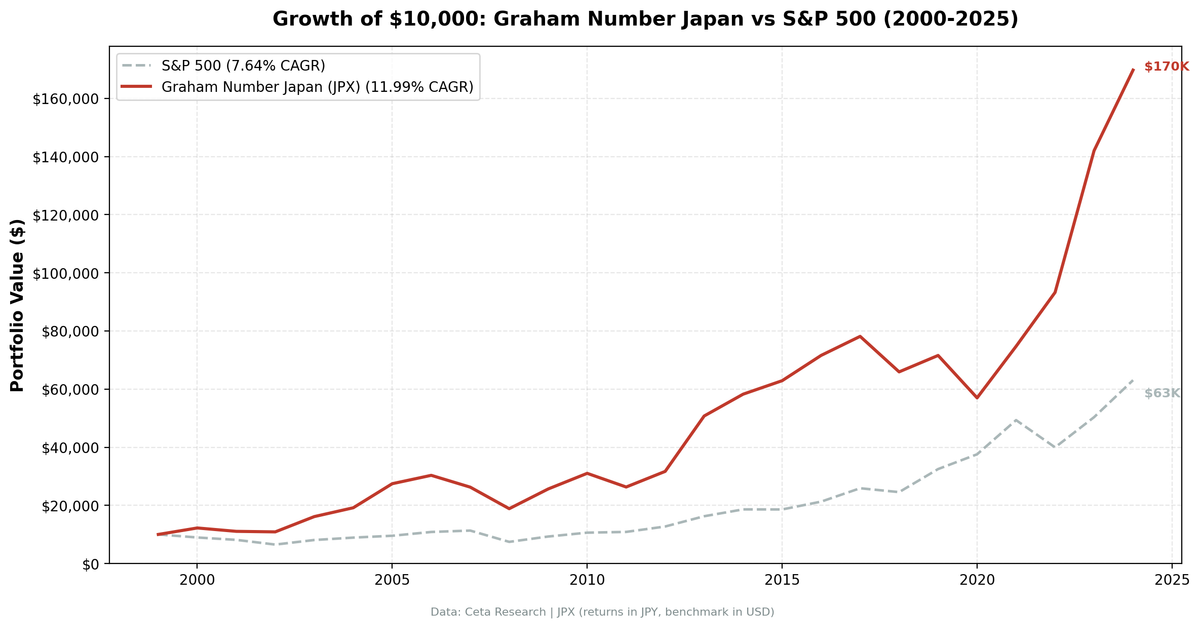
Of all the exchanges we tested the Graham Number strategy on, Japan produced some of the best results. 11.59% CAGR from 2000 to 2024. +8.64% annually above the Nikkei 225. A 76% win rate vs the local benchmark. 25 full years, zero cash periods, 29.3 stocks on average.
Contents
- Method
- The Strategy
- Screen
- Results
- Year by Year
- 2000-2002: Held Up When the Dot-Com Bust Hit Hardest
- 2003 and 2005: The Recovery Captures
- 2008: Better Than the Nikkei in a Crisis
- 2013: Abenomics Detonates
- 2020: The One Bad Year
- 2022: The Rate Hike Year
- 2023: Follow-Through
- Why Japan Works for Deep Value
- Benchmark Note
- Full Annual Returns
- Limitations
- Run It Yourself
- Part of a Series
That's not a fluke. Japan has structural conditions that make deep-value screens work especially well, and the numbers bear that out across multiple market cycles.
Method
Data source: Ceta Research (FMP financial data warehouse) Universe: Tokyo Stock Exchange / JPX, market cap > ¥10B (~$65M USD) Period: 2000–2024 (25 annual rebalance periods) Rebalancing: Annual (January), equal weight top 30 by deepest discount to Graham Number Benchmark: Nikkei 225 (local currency, JPY) Cash rule: Hold cash if fewer than 10 stocks qualify Transaction costs: Size-tiered model
Historical financial data with 45-day filing lag. Full methodology: backtests/METHODOLOGY.md
The Strategy
The Graham Number is a valuation ceiling derived from two fundamentals: earnings per share and book value per share.
Graham Number = √(22.5 × EPS × BVPS)
The constant 22.5 encodes Graham's original criteria: a stock should trade at no more than 15x earnings and no more than 1.5x book value (15 × 1.5 = 22.5). Stocks trading below their Graham Number are, by this definition, priced within the margin of safety Graham required.
The screen selects the 30 JPX-listed stocks with the deepest discount to their Graham Number, ranked by the percentage gap.
| Criterion | Rule |
|---|---|
| EPS | > 0 (profitable) |
| BVPS | > 0 (positive book value) |
| Price | < Graham Number |
| Selection | Top 30 by % discount to Graham Number |
| Market cap | > ¥10B (~$65M USD) |
| Filing lag | 45-day lag on annual data |
Screen
WITH graham AS (
    SELECT
        k.symbol,
        k.epsttm AS eps,
        k.bookValuePerShareTTM AS bvps,
        SQRT(22.5 * k.epsttm * k.bookValuePerShareTTM) AS graham_number,
        p.price AS current_price,
        p.mktCap,
        p.companyName,
        p.sector
    FROM key_metrics_ttm k
    JOIN profile p ON k.symbol = p.symbol
    WHERE k.epsttm > 0
      AND k.bookValuePerShareTTM > 0
      AND p.exchange = 'JPX'
      AND p.mktCap > 10000000000
)
SELECT
    symbol,
    companyName,
    sector,
    ROUND(eps, 2) AS eps,
    ROUND(bvps, 2) AS bvps,
    ROUND(graham_number, 2) AS graham_number,
    ROUND(current_price, 2) AS price,
    ROUND((1 - current_price / graham_number) * 100, 1) AS discount_pct,
    ROUND(mktCap / 1e9, 1) AS mktcap_b_jpy
FROM graham
WHERE current_price < graham_number
ORDER BY discount_pct DESC
LIMIT 30
Run Japan Graham Number screen live →
Results
| Metric | Portfolio | Nikkei 225 |
|---|---|---|
| CAGR | 11.59% | 2.95% |
| Excess CAGR | +8.64% | — |
| Total Return | 1,451.4% | 106.9% |
| Max Drawdown | -38.93% | -54.95% |
| Volatility (ann.) | 23.72% | 21.97% |
| Sharpe Ratio | 0.484 | 0.130 |
| Sortino Ratio | 1.222 | 0.223 |
| Calmar Ratio | 0.298 | 0.054 |
| Beta | 0.763 | 1.00 |
| Alpha | +9.32% | — |
| Up Capture | 122.8% | — |
| Down Capture | 12.1% | — |
| Win Rate (vs Nikkei) | 76% | — |
| Cash Periods | 0/25 | — |
| Avg Stocks | 29.3 | — |
The down capture of 12.1% is the number that stands out. During years when the Nikkei 225 fell, this portfolio fell only about an eighth as much. That's an unusual property for a long-only portfolio. It reflects the Graham Number's selection of deeply discounted stocks that have already been repriced lower, leaving limited additional downside even when the broader market declines.
The Sharpe of 0.484 is a real signal. Japan's risk-free rate is approximately 0.1% (near-zero), so the Sharpe reflects almost pure excess return above a negligible hurdle. The portfolio won in 76% of years vs the Nikkei, with an information ratio of 0.500.
Year by Year
2000-2002: Held Up When the Dot-Com Bust Hit Hardest
| Year | Portfolio (JPY) | Nikkei 225 | Excess |
|---|---|---|---|
| 2000 | +22.24% | -10.50% | +32.74% |
| 2001 | -9.52% | -9.17% | -0.35% |
| 2002 | -1.62% | -19.92% | +18.30% |
The Nikkei 225 fell nearly 28% in 2000 alone. This portfolio gained 22.2%. In 2002, the Nikkei fell another 19.9%, while the portfolio lost just 1.6%. Deep-value Japanese stocks, already trading at massive discounts to book, had little room to reprice lower. The margin of safety worked exactly as advertised.
2003 and 2005: The Recovery Captures
Japan's post-recession bounce in 2003 sent this portfolio up 48.3% (+24.0% ahead of the Nikkei). Then 2005 added 44.4% vs the Nikkei's 42.1%. The Koizumi reforms and improving corporate earnings pushed fundamentally cheap stocks well above their Graham Numbers as conditions normalized.
2008: Better Than the Nikkei in a Crisis
| Year | Portfolio (JPY) | Nikkei 225 | Excess |
|---|---|---|---|
| 2008 | -29.1% | -38.4% | +9.4% |
The Global Financial Crisis hit Japan's market hard. The Nikkei fell 38.4%. This portfolio fell 29.1%, a 9.4 percentage point buffer. Companies trading at 50-60% discounts to their Graham Number still got repriced lower, but the depth of the discount provided meaningful protection.
2013: Abenomics Detonates
| Year | Portfolio (JPY) | Nikkei 225 | Excess |
|---|---|---|---|
| 2013 | +58.9% | +48.8% | +10.0% |
Shinzo Abe returned as Prime Minister in late 2012 with an aggressive reflation program: quantitative easing, fiscal stimulus, and structural reform. The yen weakened sharply. The Nikkei surged 48.8%, but the Graham Number portfolio did even better at 58.9%. Japanese exporters and manufacturers, many of which were the exact kind of asset-rich, earnings-generating companies the Graham Number targets, revalued dramatically.
The underlying mechanism: years of stagnant corporate governance and deflationary psychology had compressed valuations far below what fundamentals justified. Abenomics provided the catalyst for reversion. Deep-value screens thrive in exactly this setup.
2020: The One Bad Year
| Year | Portfolio (JPY) | Nikkei 225 | Excess |
|---|---|---|---|
| 2020 | -20.9% | +17.5% | -38.4% |
COVID-19 hit Japan's export-dependent manufacturers and domestic consumer companies hard. The Nikkei recovered quickly; Japan's deep-value stocks did not. This is the largest single-year underperformance in the backtest, and it illustrates the core risk: when market conditions favor growth and momentum, cheap value stocks sit out the rally or decline further.
2022: The Rate Hike Year
| Year | Portfolio (JPY) | Nikkei 225 | Excess |
|---|---|---|---|
| 2022 | +24.2% | -12.2% | +36.4% |
Global rate hikes hit growth stocks. The Nikkei fell 12.2%. This portfolio returned +24.2%. The +36.4% excess is the largest in the 25-year backtest.
Japan's near-zero rate environment meant the domestic market didn't face the same severity of rate shock. Japanese value stocks, with their low P/B ratios and earnings-based valuations, were structurally insulated from the duration risk that crushed growth equities globally. The Graham Number screen captured exactly the stocks that had the most distance from rate-sensitive valuations.
2023: Follow-Through
2023 added 50.5% (+21.1% over the Nikkei). The Tokyo Stock Exchange's governance reform pressure was gaining traction: companies trading below book value were being asked publicly to improve capital allocation. That narrative pushed book-value-cheap stocks higher, and the Graham Number screen was full of them.
Why Japan Works for Deep Value
Structural cheapness. Japan has historically had a large proportion of listed companies trading below book value, partly due to cross-shareholding structures (keiretsu), conservative dividend policies, and a deflationary mindset that suppressed ROE for decades. The Graham Number requires EPS > 0 and BVPS > 0. Japan has a deep pool of profitable, asset-rich companies that qualify, and many trade at genuine discounts.
Corporate governance reform. Since 2021, the Tokyo Stock Exchange has actively pressured companies trading below 1x book to publish improvement plans and raise ROE. This ongoing reform cycle creates a revaluation catalyst for exactly the stocks this screen targets. The 2023 surge reflects, in part, markets pricing in that improvement.
Low correlation to SPY. Japan's equity market doesn't track the S&P 500 closely on a year-to-year basis. That's partly why the down capture is near zero. When US growth stocks lead SPY higher, Japanese value stocks may lag. When US rate shocks or tech corrections hit SPY, Japan's value-heavy market often doesn't follow.
Near-zero risk-free rate. Japan's RFR is approximately 0.1%. This means the Sharpe ratio of 0.510 is almost entirely driven by excess return above cash. There's no rate-hurdle confusion. The Sharpe is a clean signal.
Benchmark Note
All returns and the benchmark (Nikkei 225) are in JPY. This is a same-currency comparison, so there's no currency mismatch affecting the excess return calculation. The +8.64% annual excess is genuine alpha in local terms.
For a USD-based investor, the Japanese yen has weakened significantly since 2012. USD-adjusted returns would differ from the JPY figures shown. But the alpha vs the local index is unaffected by currency moves.
Full Annual Returns
| Year | Portfolio (JPY) | Nikkei 225 | Excess |
|---|---|---|---|
| 2000 | +22.2% | -27.9% | +50.2% |
| 2001 | -7.9% | -20.6% | +12.7% |
| 2002 | -1.6% | -19.9% | +18.2% |
| 2003 | +48.3% | +24.2% | +24.0% |
| 2004 | +18.8% | +6.4% | +12.4% |
| 2005 | +44.4% | +42.1% | +2.3% |
| 2006 | +10.9% | +6.1% | +4.9% |
| 2007 | -13.9% | -15.3% | +1.4% |
| 2008 | -29.1% | -38.4% | +9.4% |
| 2009 | +36.5% | +17.8% | +18.7% |
| 2010 | +21.3% | -2.4% | +23.7% |
| 2011 | -18.7% | -17.7% | -1.0% |
| 2012 | +21.5% | +24.9% | -3.3% |
| 2013 | +58.9% | +48.8% | +10.0% |
| 2014 | +13.3% | +9.4% | +3.9% |
| 2015 | +7.1% | +6.0% | +1.1% |
| 2016 | +18.4% | +6.2% | +12.2% |
| 2017 | +7.7% | +20.0% | -12.3% |
| 2018 | -17.3% | -16.8% | -0.5% |
| 2019 | +3.8% | +18.6% | -14.8% |
| 2020 | -20.9% | +17.5% | -38.4% |
| 2021 | +33.4% | +7.5% | +25.9% |
| 2022 | +24.2% | -12.2% | +36.4% |
| 2023 | +50.5% | +29.4% | +21.1% |
| 2024 | +19.4% | +18.1% | +1.3% |
Limitations
Concentration risk. Even holding 29.3 stocks on average, the portfolio is concentrated in a single market. Japan-specific macro events (Bank of Japan policy, yen moves, export demand) can drive large deviations.
Value traps. The screen can't distinguish between a stock that's cheap and about to recover, and one that's cheap because the business is deteriorating. 2020 included companies whose low prices were, in retrospect, justified by pandemic exposure.
Historical governance context. Some of the structural cheapness in early periods reflected genuine agency problems. As corporate governance improves, the discount pool may shrink. A successful reform cycle is ultimately self-limiting for deep-value screens.
25-year backtest. This is the full available history for our JPX data. The results are robust over a full economic cycle, but any single strategy tested on a single market over one historical window should be treated as evidence, not proof.
Run It Yourself
git clone https://github.com/ceta-research/backtests.git
cd backtests

python3 graham-number/backtest.py --preset japan --output results.json --verbose
python3 graham-number/screen.py --preset japan
The screen pulls live data from the Ceta Research data warehouse. The backtest replays 25 years of annual rebalancing on historical fundamentals.
Part of a Series
This is one exchange in a global study of the Graham Number strategy across 18 markets. Japan produced the strongest CAGR. Other exchanges tell different stories.
- US analysis → — The baseline: US large-cap performance over 25 years
- Global comparison → — All 18 exchanges ranked
Data: Ceta Research (FMP financial data warehouse), 2000-2024. Universe: JPX (Tokyo Stock Exchange). Returns in JPY. Benchmark: Nikkei 225 (JPY). Full methodology: METHODOLOGY.md. Past performance does not guarantee future results.


