We Backtested Peter Lynch's GARP Screen on 25 Years of US Data. It Lost.
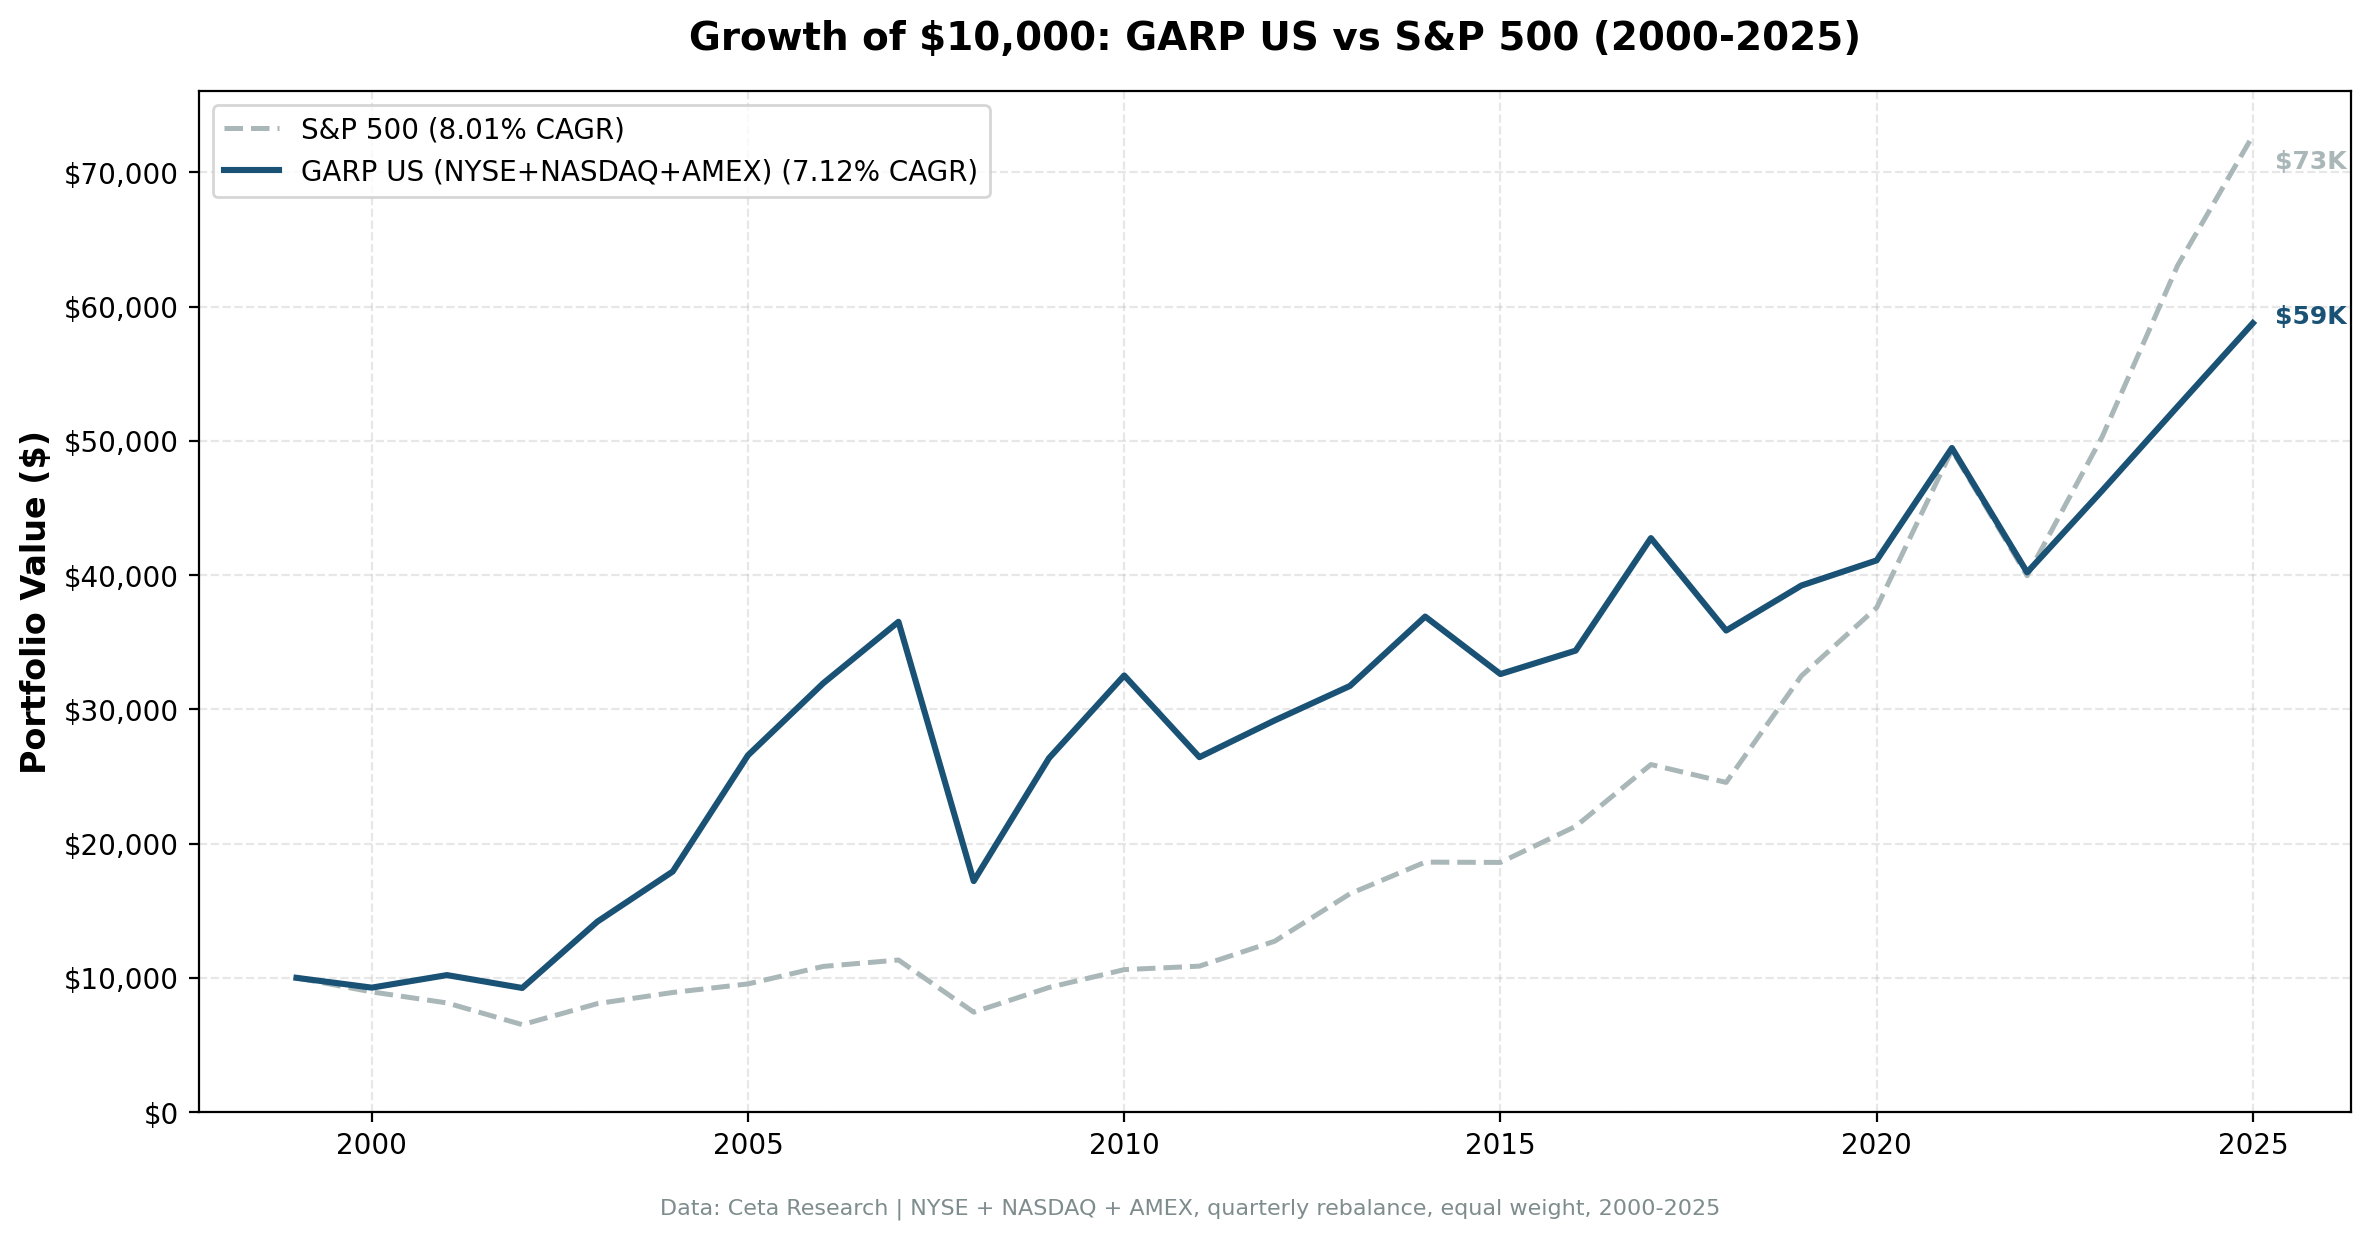
We ran the Growth at a Reasonable Price strategy on all US stocks from 2000 to 2025. 7.12% CAGR vs 8.01% for the S&P 500. The screen was fully invested every quarter. It still lost.

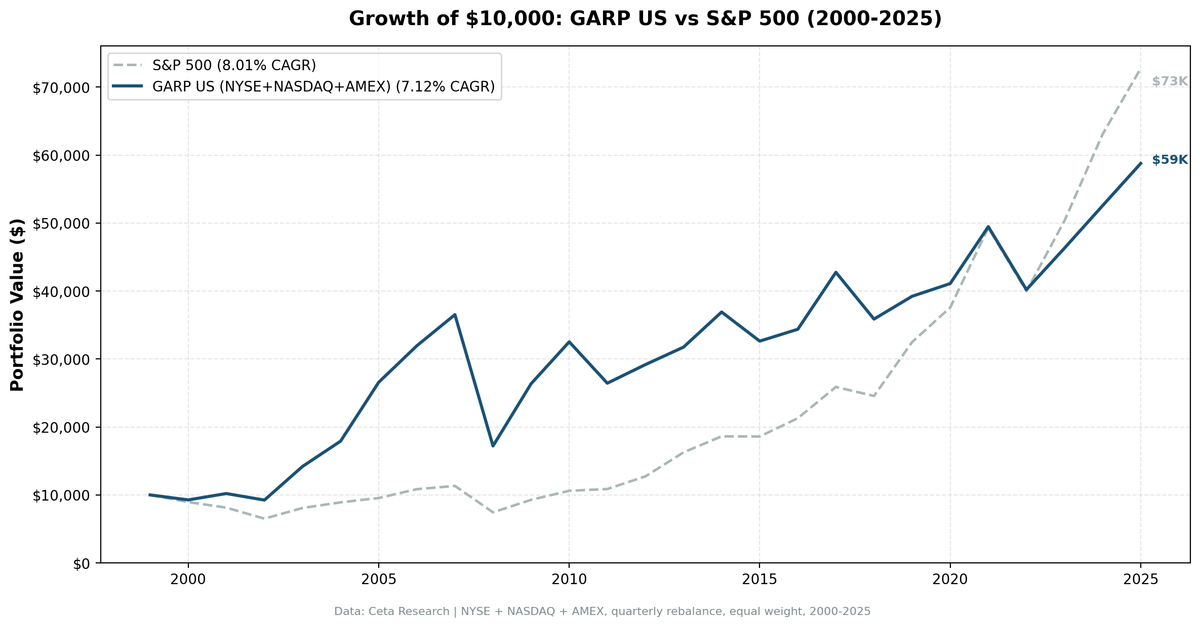
We ran the Growth at a Reasonable Price (GARP) strategy — PEG < 1.5, revenue growth > 15%, ROE > 10% — on all US stocks (NYSE, NASDAQ, AMEX) from 2000 to 2025. The result: 7.12% annualized vs 8.01% for the S&P 500. A $10,000 investment grew to $58,766 vs $72,745 for the index. The strategy lagged by nearly a full percentage point per year.
Contents
- Method
- What is GARP?
- What We Found
- The market already prices in growth.
- Year-by-Year Returns
- The early years looked promising
- 2008 changed the math permanently
- 2012–2024: consistent lag
- The Core Problem: No Free Lunch
- Limitations
- Takeaway
- Part of a Series
- Run This Screen Yourself
- References
Method
Data source: Ceta Research (FMP financial data warehouse) Universe: NYSE + NASDAQ + AMEX, market cap > $2B USD Period: 2000–2025 (25 years, 103 quarterly periods) Rebalancing: Quarterly (January, April, July, October), equal weight Benchmark: S&P 500 Total Return (SPY) Cash rule: Hold cash if fewer than 10 stocks qualify Transaction costs: Size-tiered model (0.1–0.5% one-way based on market cap)
Financial data uses a 45-day lag on annual filings to prevent look-ahead bias. PEG ratios, P/E ratios, ROE, and debt-to-equity come from fiscal year filings as they would have been available at each rebalance date.
What is GARP?
GARP — Growth at a Reasonable Price — is Peter Lynch's framework from One Up on Wall Street (1989). Lynch observed that investors tend to either chase growth (buying expensive) or hunt value (ignoring growth). GARP tries to find the middle: companies growing fast enough that their current valuation is justified.
The core metric is the PEG ratio: Price-to-Earnings divided by Earnings Growth Rate. A PEG of 1.0 means you're paying exactly one dollar of P/E for every percentage point of growth. Lynch argued that PEG < 1.0 was "cheap" and PEG above 2.0 was "too expensive." We use PEG < 1.5 — you're paying at most 1.5× the growth rate.
All six filters must pass at each quarterly rebalance:
| Filter | Threshold | Why |
|---|---|---|
| PEG ratio | 0 < PEG < 1.5 | Not overpaying for growth |
| P/E ratio | 5 < P/E < 50 | Exclude distressed and speculative |
| Revenue growth (YoY) | > 15% | Must be demonstrably growing |
| ROE | > 10% | Quality filter — profitable on equity |
| Debt/Equity | < 2.0 | Growth companies can carry more leverage, but not unlimited |
| Market cap | > $2B USD | Liquid, institutional-grade stocks |
From qualifying stocks, the portfolio holds the top 30 by lowest PEG ratio, equal weight.
What We Found
The market already prices in growth.
| Metric | GARP US | S&P 500 |
|---|---|---|
| CAGR | 7.12% | 8.01% |
| Total Return | 488% | 627% |
| Max Drawdown | -57.61% | -45.53% |
| Volatility | 23.17% | 16.97% |
| Sharpe Ratio | 0.221 | 0.354 |
| Up Capture | 106.68% | — |
| Down Capture | 107.95% | — |
| Beta | 1.128 | — |
| Cash Periods | 0 of 103 | — |
| Avg Stocks | 25.7 | — |
The GARP screen was fully invested every quarter over 25 years — no periods where qualifying stocks dropped below 10. That's a signal with consistent coverage.
But the return numbers tell a clear story: the screen took on more risk than the market (beta 1.128, volatility 23.2% vs 17.0%) and got paid less for it. Up capture of 107% means it slightly amplified bull market gains. Down capture of 108% means it amplified bear market losses even more. Net effect: worse risk-adjusted returns.
This isn't a data problem. It's the efficient market working correctly.
Year-by-Year Returns
| Year | GARP US | S&P 500 | Excess |
|---|---|---|---|
| 2000 | -7.31% | -10.50% | +3.19% |
| 2001 | +10.08% | -9.17% | +19.25% |
| 2002 | -9.41% | -19.92% | +10.51% |
| 2003 | +53.54% | +24.12% | +29.42% |
| 2004 | +26.25% | +10.24% | +16.01% |
| 2005 | +48.33% | +7.17% | +41.16% |
| 2006 | +20.19% | +13.65% | +6.54% |
| 2007 | +14.34% | +4.40% | +9.94% |
| 2008 | -52.89% | -34.31% | -18.58% |
| 2009 | +53.21% | +24.73% | +28.48% |
| 2010 | +23.38% | +14.31% | +9.07% |
| 2011 | -18.71% | +2.46% | -21.17% |
| 2012 | +10.35% | +17.09% | -6.74% |
| 2013 | +8.80% | +27.77% | -18.97% |
| 2014 | +16.28% | +14.50% | +1.78% |
| 2015 | -11.60% | -0.12% | -11.48% |
| 2016 | +5.35% | +14.45% | -9.10% |
| 2017 | +24.38% | +21.64% | +2.74% |
| 2018 | -16.10% | -5.15% | -10.95% |
| 2019 | +9.35% | +32.31% | -22.96% |
| 2020 | +4.77% | +15.64% | -10.87% |
| 2021 | +20.37% | +31.26% | -10.89% |
| 2022 | -18.73% | -18.99% | +0.26% |
| 2023 | +15.20% | +26.00% | -10.80% |
| 2024 | +13.49% | +25.28% | -11.79% |
| 2025 | +11.81% | +15.34% | -3.53% |
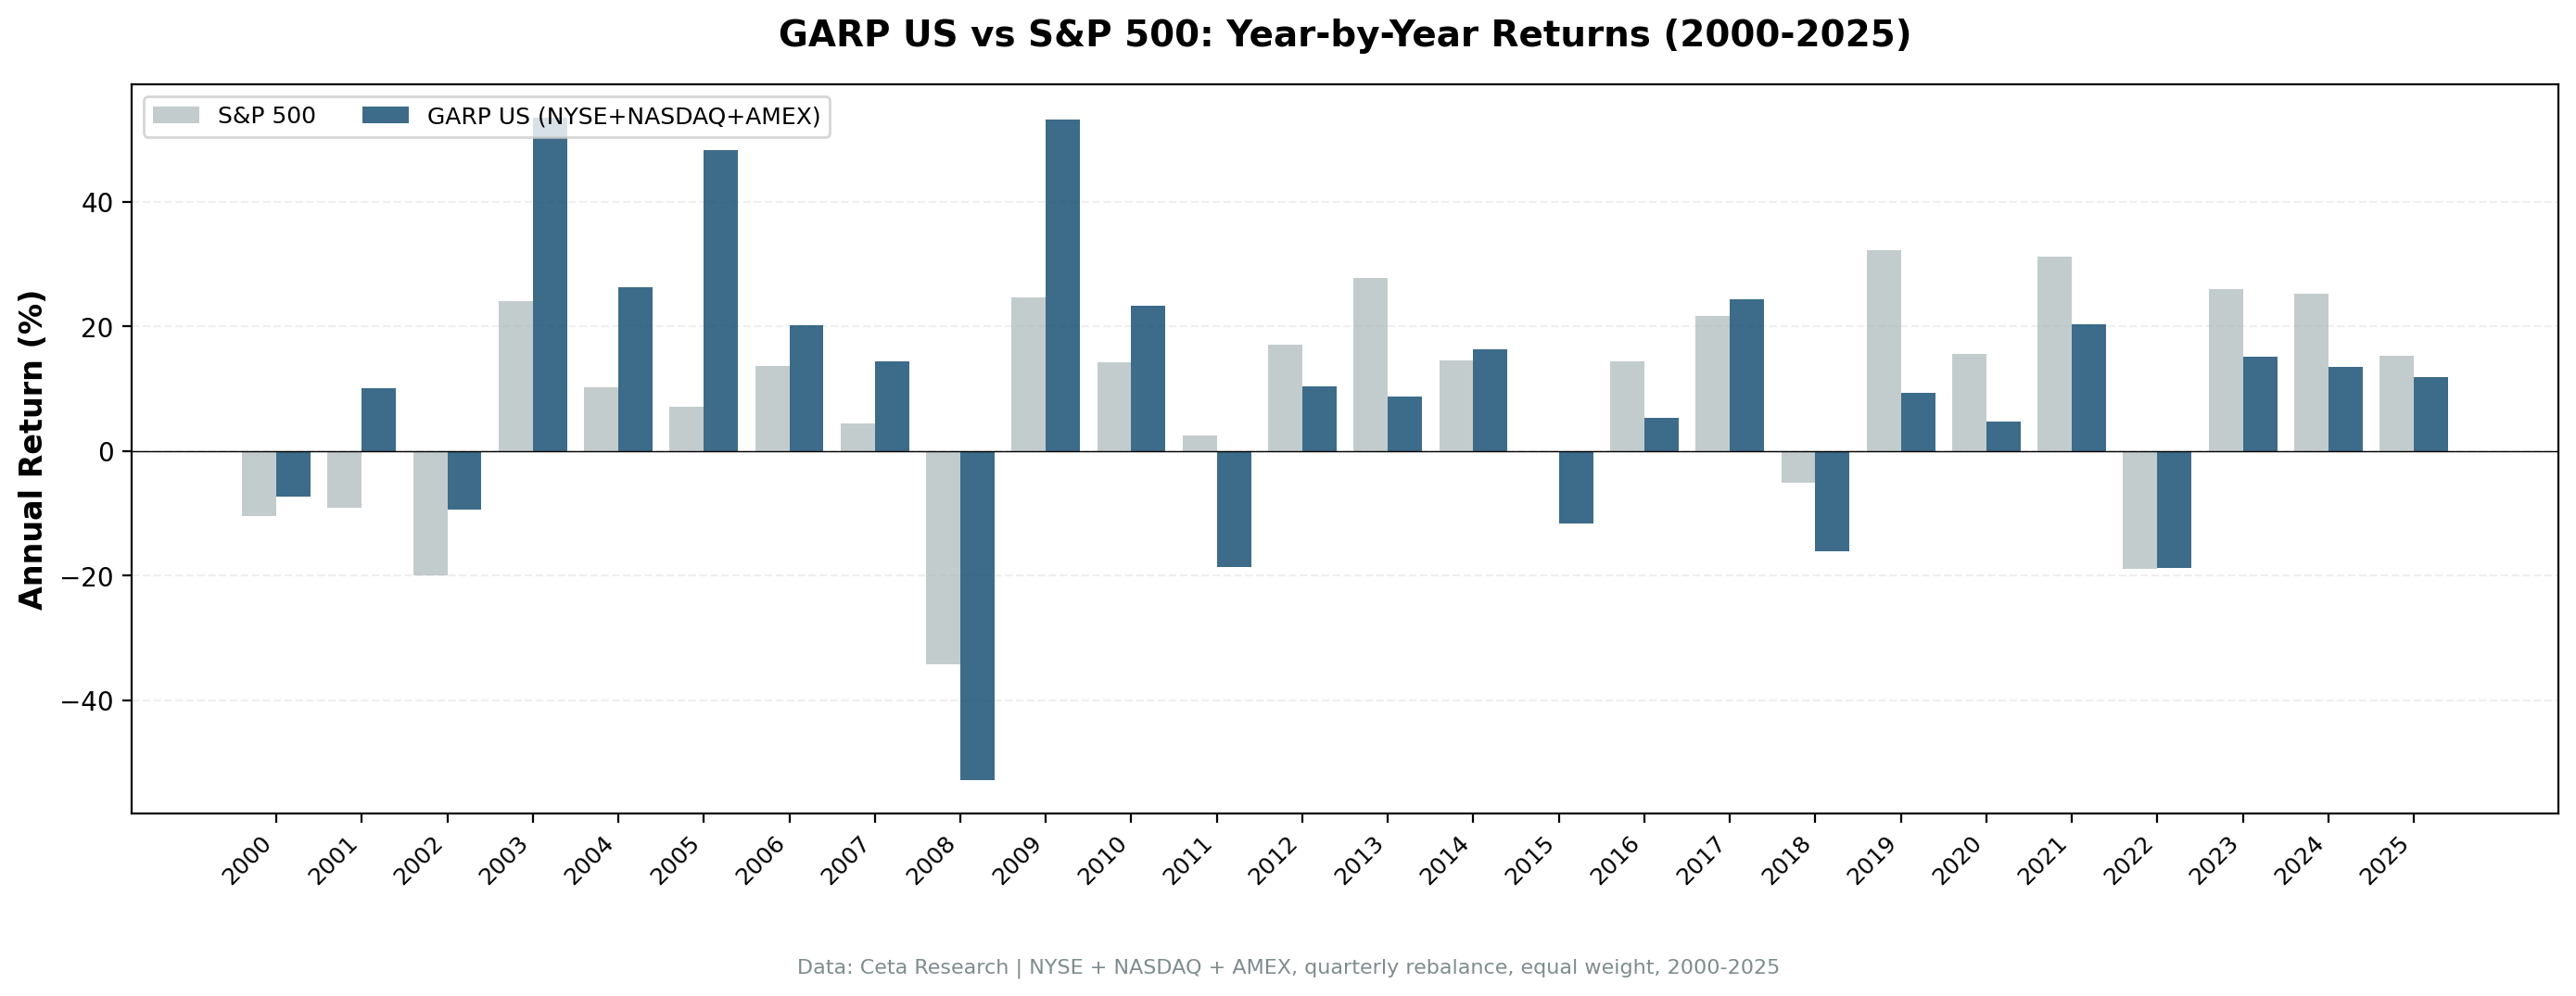
The early years looked promising
From 2001 to 2007, GARP beat the S&P 500 every single year. After the dot-com bust, there were genuine companies growing at 20–30% with PEG ratios below 1.5 — energy names, small industrials, healthcare companies the market had overlooked after the tech selloff. The screen found them.
2005 was the standout: +48.33% vs SPY's +7.17%. Energy and materials companies drove that year. If you'd just seen 2001–2007, you'd have been convinced GARP was the answer.
2008 changed the math permanently
When the financial crisis hit, GARP fell 52.89% against the S&P 500's 34.31%. That 18-point gap wiped out years of outperformance. The recovery in 2009 (+53.21%) was equally strong, but you had to absorb the full crash first.
After 2011, the character of the market shifted. The decade of low interest rates and quantitative easing sent capital into high-multiple growth stocks. Companies growing fast were rewarded with premium valuations. The GARP screen — filtering for PEG < 1.5 — systematically excluded the decade's best performers. Microsoft, Apple, Google, Nvidia: all priced above PEG 1.5 during their biggest runs. The screen passed them every quarter.
2012–2024: consistent lag
GARP trailed the S&P 500 in 11 of 13 years from 2012–2024. This isn't noise. Growth stocks with high multiples dominated that era, and GARP's valuation filter kept them out. The exception was 2022, when the strategy roughly matched the benchmark during the growth stock selloff.
The Core Problem: No Free Lunch
The efficient market hypothesis says that publicly available information is already priced into stocks. PEG < 1.5 combined with visible revenue growth > 15% — that's public information. Every analyst on Wall Street can compute it. By the time a stock passes GARP's screen, that information has been bid into the price.
That's the argument, and the 25-year backtest supports it. The US equity market is too efficient for systematic GARP to generate alpha over time. The signal fires, but it doesn't find hidden gems. It finds what the market already knows.
This doesn't mean Lynch was wrong. His framework was designed for active stock pickers who could identify PEG < 1.5 situations before the information spread widely — in a pre-internet, pre-Bloomberg era when information moved slower. Applied systematically in 2025 across thousands of stocks using real-time financial data, the edge doesn't survive.
Limitations
This is a total return backtest in USD. US stocks traded in USD are directly comparable to SPY. No currency translation needed.
Point-in-time compliance. The 45-day filing lag means filings released after January 15 don't appear in January 1 portfolios. Some data providers report GAAP filing dates with slight inconsistencies. This is a best-effort approximation, not a guaranteed clean cutoff.
Transaction costs included. Results reflect size-tiered transaction costs on entry and exit. Academic comparisons without costs would show slightly higher GARP returns (approximately 0.3–0.5% annually better).
Survivorship bias. Company profiles use current exchange listings. Delisted companies that went to zero aren't tracked through their failure. This biases results upward — the true performance is likely slightly worse.
PEG ratio uses reported earnings growth. The screen uses the PEG as reported, which can be distorted by one-time charges, acquisitions, or base-year effects. A company with artificially depressed prior-year earnings shows a spectacular "growth rate" that isn't real.
25 years is a long but imperfect test. The period 2000–2025 includes multiple regime changes: the tech bubble, low-rate era, COVID, and rate normalization. GARP performed differently in each. No 25-year backtest can guarantee future results in any one regime.
Takeaway
GARP doesn't beat the US market. Over 25 years, it returned 7.12% per year against 8.01% for the S&P 500, with higher volatility, a worse Sharpe ratio, and a maximum drawdown that exceeded the index by 12 percentage points.
The honest interpretation: the US equity market prices growth too efficiently for a simple PEG screen to find systematic alpha. The information is public, the tools are widely available, and the competition is intense. By the time a stock shows PEG < 1.5 and 15%+ revenue growth, the market has already seen it.
This doesn't mean the screen is useless. It's a structured portfolio with real diversification (26 stocks on average, fully invested every quarter). But as a benchmark-beating strategy in the US, the data says no.
The question worth asking: if GARP fails in the US, where does it work? We tested 17 markets. See the full comparison.
Part of a Series
This post is part of our GARP global exchange comparison:
- GARP on Indian Stocks (BSE + NSE) — The only market with meaningful outperformance
- GARP on German Stocks (XETRA) — Close to benchmark, with better drawdown protection
- GARP: 17-Exchange Global Comparison — 16 of 17 markets underperform
Run This Screen Yourself
The current GARP screen (US stocks, TTM data):
WITH latest_income AS (
    SELECT symbol, revenue, dateEpoch,
           ROW_NUMBER() OVER (PARTITION BY symbol ORDER BY dateEpoch DESC) AS rn
    FROM income_statement WHERE period = 'FY' AND revenue > 0
),
rev_growth AS (
    SELECT c.symbol,
           ROUND((c.revenue - p.revenue) / ABS(p.revenue) * 100, 1) AS rev_growth_pct
    FROM latest_income c
    JOIN latest_income p ON c.symbol = p.symbol AND c.rn = 1 AND p.rn = 2
    WHERE p.revenue > 0 AND (c.revenue - p.revenue) / ABS(p.revenue) > 0.15
)
SELECT f.symbol, p.companyName, p.sector,
    ROUND(f.priceToEarningsGrowthRatioTTM, 3) AS peg_ratio,
    ROUND(f.priceToEarningsRatioTTM, 2) AS pe_ratio,
    ROUND(k.returnOnEquityTTM * 100, 1) AS roe_pct,
    ROUND(f.debtToEquityRatioTTM, 2) AS debt_to_equity,
    g.rev_growth_pct,
    ROUND(k.marketCap / 1e9, 2) AS mktcap_b
FROM financial_ratios_ttm f
JOIN key_metrics_ttm k ON f.symbol = k.symbol
JOIN profile p ON f.symbol = p.symbol
JOIN rev_growth g ON f.symbol = g.symbol
WHERE f.priceToEarningsGrowthRatioTTM > 0 AND f.priceToEarningsGrowthRatioTTM < 1.5
  AND f.priceToEarningsRatioTTM > 5 AND f.priceToEarningsRatioTTM < 50
  AND k.returnOnEquityTTM > 0.10
  AND f.debtToEquityRatioTTM >= 0 AND f.debtToEquityRatioTTM < 2.0
  AND k.marketCap > 2000000000
  AND p.exchange IN ('NYSE', 'NASDAQ', 'AMEX')
QUALIFY ROW_NUMBER() OVER (PARTITION BY f.symbol ORDER BY f.priceToEarningsGrowthRatioTTM ASC) = 1
ORDER BY f.priceToEarningsGrowthRatioTTM ASC LIMIT 30
Run this screen on Ceta Research
The full backtest code (Python + DuckDB) is on GitHub.
References
- Lynch, P. (1989). One Up on Wall Street. Simon & Schuster. (PEG ratio framework, GARP concept)
- Easton, P. (2004). "PE Ratios, PEG Ratios, and Estimating the Implied Expected Rate of Return on Equity Capital." The Accounting Review, 79(1), 73–95.
- Fama, E. & French, K. (1992). "The Cross-Section of Expected Stock Returns." Journal of Finance, 47(2), 427–465. (Context: systematic factors in equity markets)
Data: Ceta Research, FMP financial data warehouse. Universe: NYSE + NASDAQ + AMEX. Quarterly rebalance, equal weight, transaction costs included, 2000–2025.