We Tested Peter Lynch's GARP in 17 Markets. One Outperformed.
We ran the GARP strategy on 17 stock exchanges from 2000 to 2025. The S&P 500 returned 8.01%. One market outperformed. Sixteen didn''t. India is the exception. Here''s the full comparison.

We ran the Growth at a Reasonable Price (GARP) strategy — PEG < 1.5, revenue growth > 15%, ROE > 10% — on 17 stock exchanges worldwide from 2000 to 2025. The S&P 500 benchmark returned 8.01% annually over that period. One market beat it. Sixteen didn't. The data is clearer than almost any other factor strategy we've tested: GARP is an emerging market strategy running in a developed-market world.
Contents
- Method
- What We Found
- One winner in 17 markets.
- Max Drawdowns
- Cash Periods: Where the Signal Doesn't Fire
- Why Developed Markets Underperform
- The China Exception
- The Japan Finding
- What the Pattern Suggests
- Limitations
- Takeaway
- Individual Exchange Posts
- References
Method
Data source: Ceta Research (FMP financial data warehouse) Period: 2000–2025 (25 years, 103 quarterly periods) Rebalancing: Quarterly (January, April, July, October), equal weight Benchmark: S&P 500 Total Return (SPY) Transaction costs: Size-tiered model (0.1–0.5% one-way based on market cap) Cash rule: Hold cash if fewer than 10 stocks qualify at a rebalance date
Each exchange uses exchange-specific market cap thresholds in local currency. Financial data has a 45-day lag on annual filings to prevent look-ahead bias.
GARP signal filters (all must pass at each rebalance):
| Filter | Threshold |
|---|---|
| PEG ratio | 0 < PEG < 1.5 |
| P/E ratio | 5 < P/E < 50 |
| Revenue growth (YoY) | > 15% |
| ROE | > 10% |
| Debt/Equity | < 2.0 |
| Market cap | Exchange-specific threshold |
What We Found
One winner in 17 markets.

| Exchange | CAGR | vs SPY | Sharpe |
|---|---|---|---|
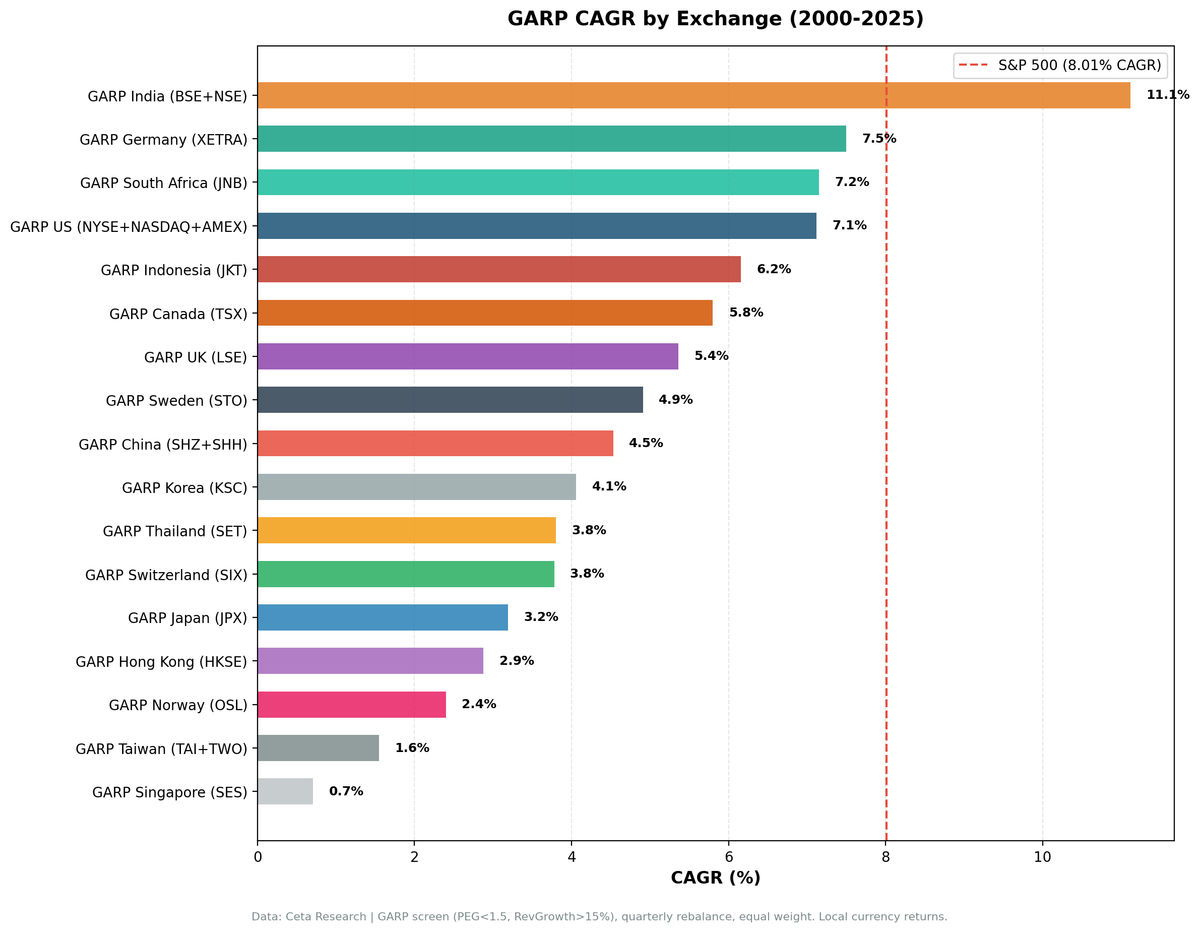
| India (BSE+NSE) | 11.12% | +3.11% | 0.131 |
| Germany (XETRA) | 7.50% | -0.51% | 0.266 |
| South Africa (JNB) | 7.15% | -0.86% | -0.090 |
| US (NYSE+NASDAQ+AMEX) | 7.12% | -0.89% | 0.221 |
| Indonesia (JKT) | 6.16% | -1.85% | 0.184 |
| Canada (TSX) | 5.80% | -2.21% | 0.142 |
| UK (LSE) | 5.36% | -2.65% | 0.082 |
| Sweden (STO) | 4.91% | -3.10% | 0.132 |
| China (SHZ+SHH) | 4.53% | -3.48% | 0.055 |
| Korea (KSC) | 4.06% | -3.95% | 0.064 |
| Thailand (SET) | 3.81% | -4.20% | 0.053 |
| Switzerland (SIX) | 3.78% | -4.23% | 0.168 |
| Japan (JPX) | 3.19% | -4.82% | 0.143 |
| Hong Kong (HKSE) | 2.88% | -5.13% | -0.004 |
| Norway (OSL) | 2.40% | -5.61% | -0.039 |
| Taiwan (TAI+TWO) | 1.55% | -6.47% | 0.029 |
| Singapore (SES) | 0.71% | -7.30% | -0.091 |
SPY benchmark: 8.01% CAGR, Sharpe 0.354
India is the only market with meaningful positive excess CAGR. Germany and South Africa are borderline. Everything else underperforms — some by a little (US: -0.89%), some by a lot (Singapore: -7.30%, Taiwan: -6.47%).
Max Drawdowns
| Exchange | Max Drawdown | vs SPY |
|---|---|---|
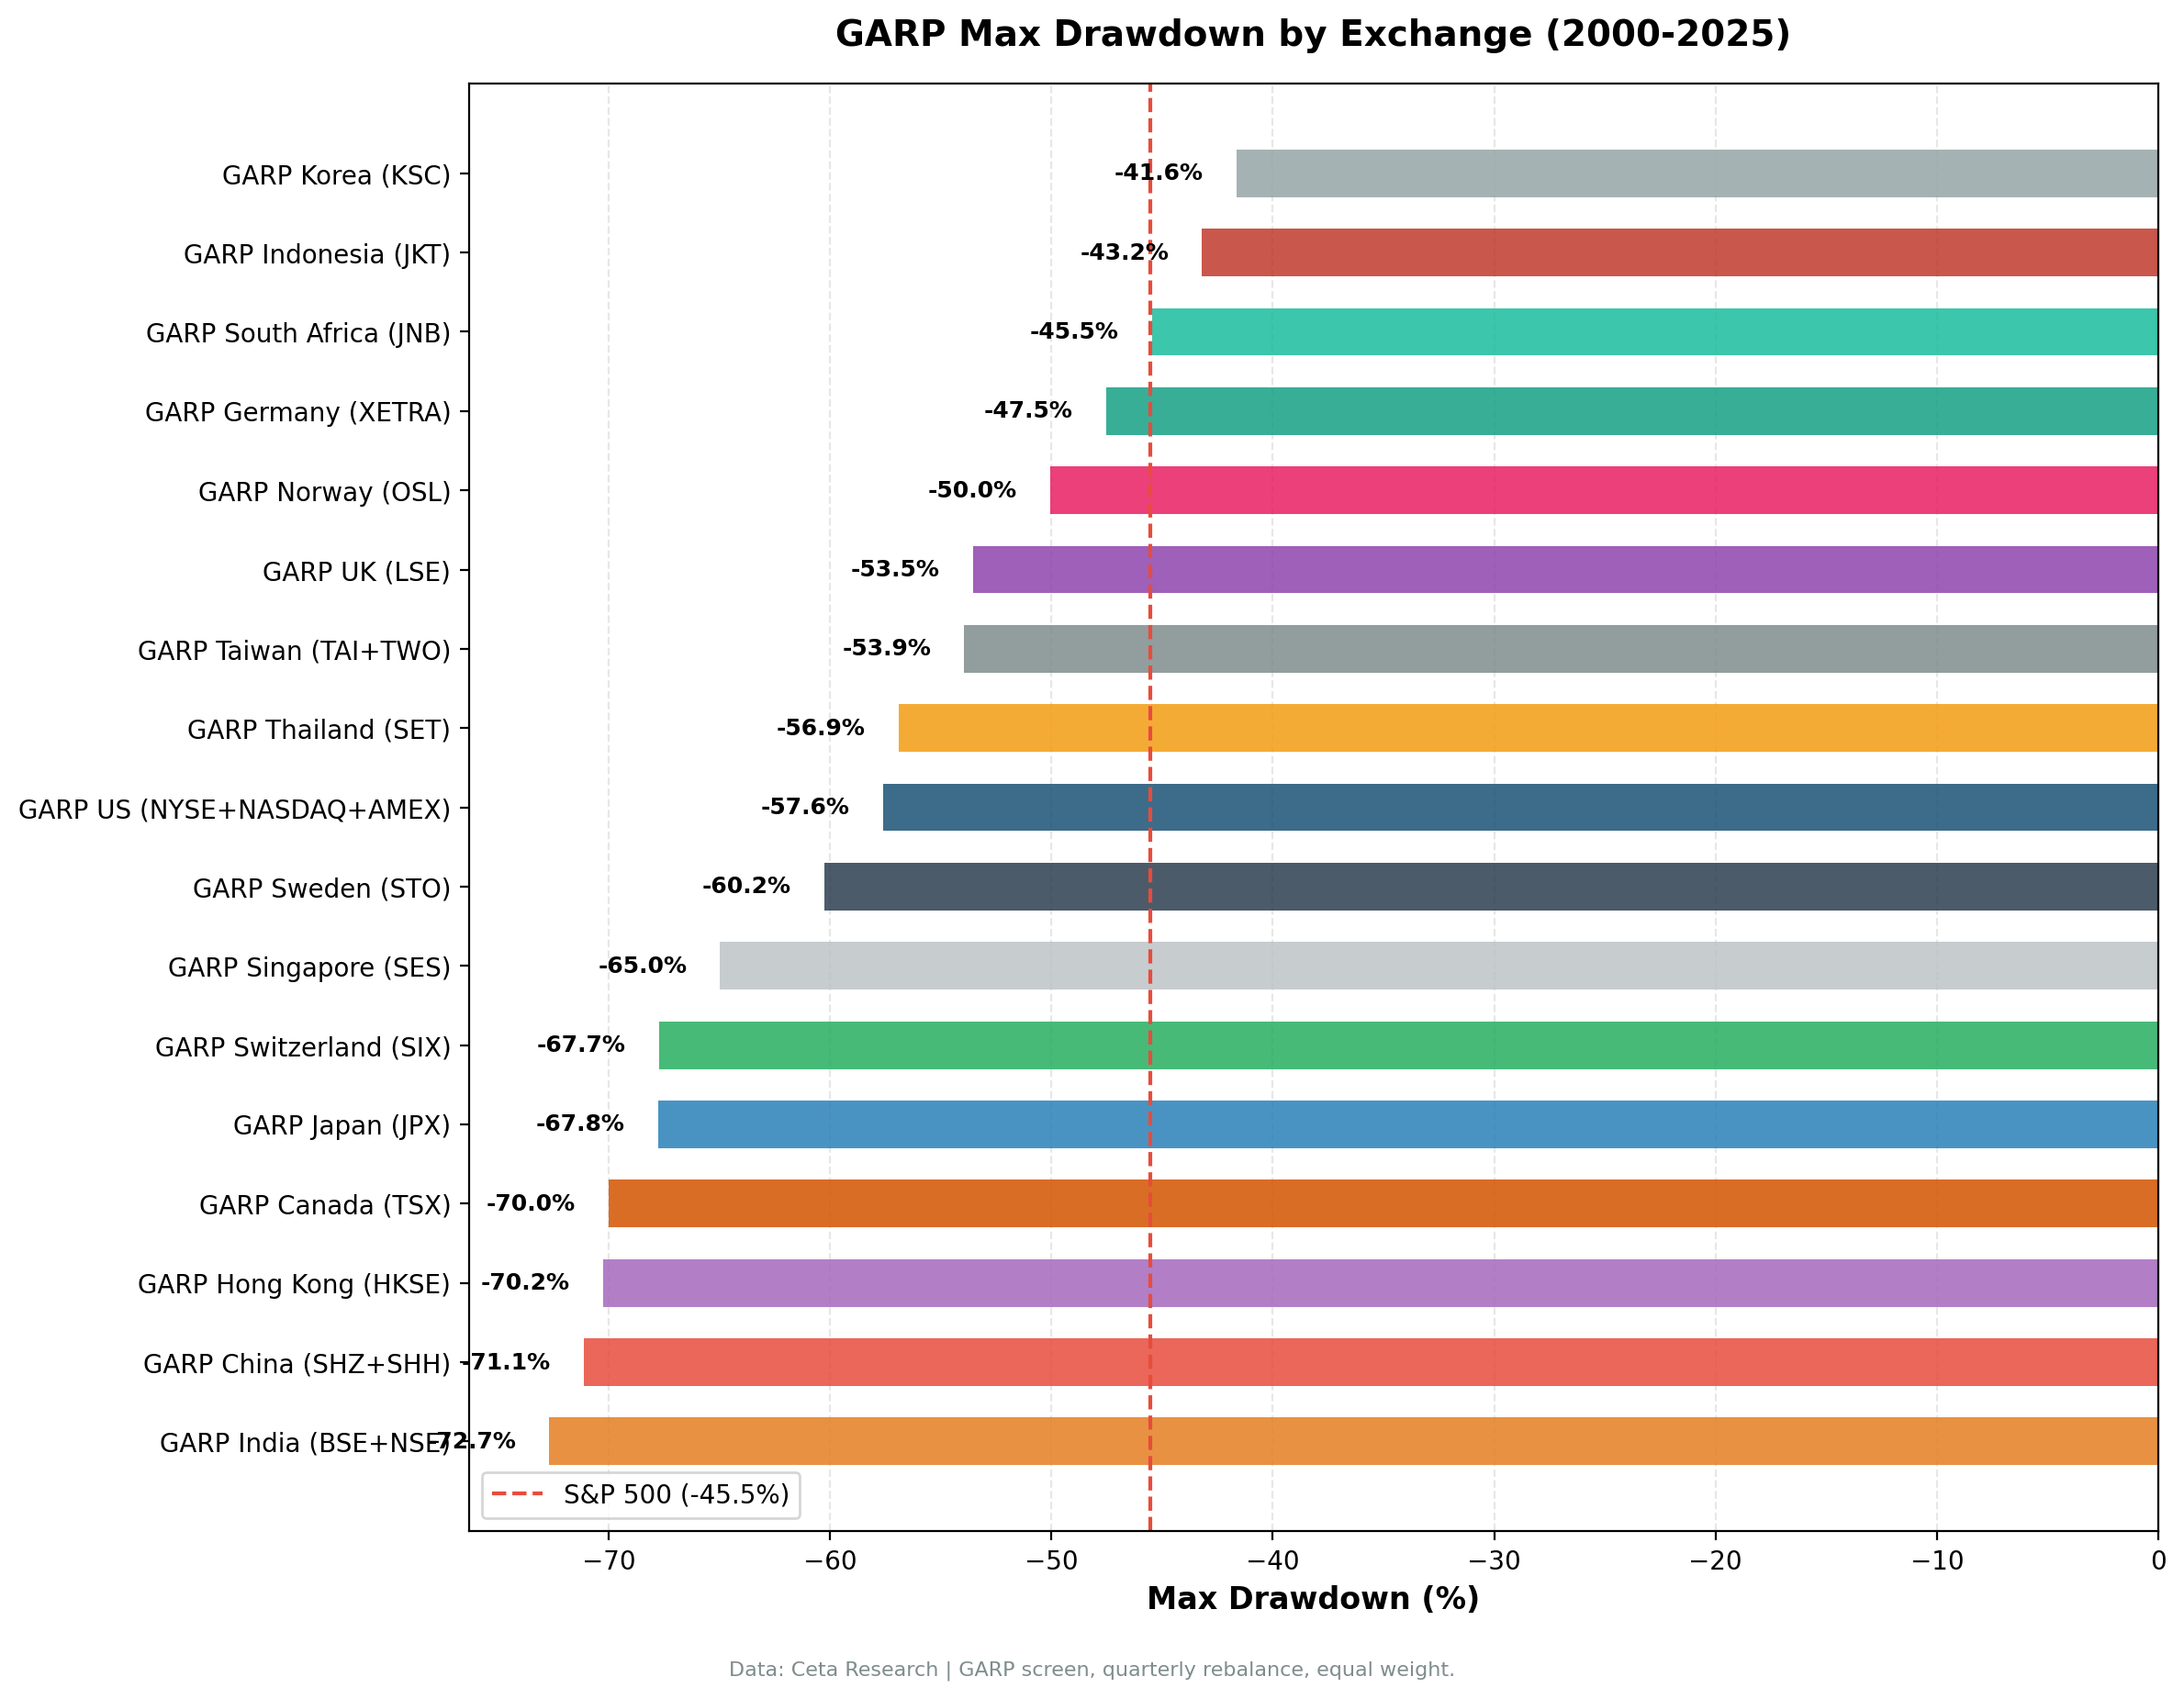
| India (BSE+NSE) | -72.67% | worse |
| China (SHZ+SHH) | -71.11% | worse |
| Canada (TSX) | -69.99% | worse |
| Switzerland (SIX) | -67.71% | worse |
| Japan (JPX) | -67.77% | worse |
| Hong Kong (HKSE) | -70.25% | worse |
| Singapore (SES) | -64.96% | worse |
| Sweden (STO) | -60.25% | worse |
| US (NYSE+NASDAQ+AMEX) | -57.61% | worse |
| Taiwan (TAI+TWO) | -53.93% | worse |
| UK (LSE) | -53.54% | worse |
| Thailand (SET) | -56.89% | worse |
| Norway (OSL) | -50.04% | worse |
| S&P 500 | -45.53% | — |
| South Africa (JNB) | -45.46% | ≈equal |
| Germany (XETRA) | -47.52% | close |
| Indonesia (JKT) | -43.19% | better |
| Korea (KSC) | -41.65% | better |
Most markets delivered worse drawdowns than the S&P 500. Indonesia (-43.19%) and Korea (-41.65%) are the only two with meaningfully shallower crashes, though both also had lower CAGRs. Germany (-47.52%) is close. No market combined lower drawdown with higher return — except India, where the higher return came with a much deeper drawdown.
Cash Periods: Where the Signal Doesn't Fire
Some markets showed high cash usage — quarterly periods when fewer than 10 stocks qualified. High cash means the GARP signal is structurally weak for that market.
| Exchange | Cash Periods | Cash % | Interpretation |
|---|---|---|---|
| Norway (OSL) | 73 of 103 | 71% | Signal rarely fires — small, oil-heavy economy |
| South Africa (JNB) | 32 of 103 | 31% | Thin qualifying universe |
| Indonesia (JKT) | 33 of 103 | 32% | Cyclical, limited depth |
| Sweden (STO) | 33 of 103 | 32% | Small mid-cap universe for GARP |
| Korea (KSC) | 34 of 103 | 33% | Chaebol structure limits PEG candidates |
| India (BSE+NSE) | 21 of 103 | 20% | Cash in 2000–2004 only; consistent since 2005 |
| US (NYSE+NASDAQ+AMEX) | 0 of 103 | 0% | Consistently deep qualifying universe |
| Germany (XETRA) | 0 of 103 | 0% | Consistently invested |
Norway's 71% cash rate means the GARP signal fired in only 30 of 103 quarters. The Norwegian market is concentrated in oil, shipping, and fisheries — sectors where 15% revenue growth and PEG < 1.5 rarely coexist. The result (2.40% CAGR) reflects mostly cash returns, not the strategy's performance.
Why Developed Markets Underperform
The consistent pattern: developed, efficient markets (US, UK, Germany, Japan, Canada, Switzerland) show GARP underperforming by 0.5%–5%. Emerging markets (India being the exception in our favor) are more mixed.
The explanation follows from basic market efficiency. GARP uses publicly available information: PEG ratios, revenue growth, ROE, D/E. In developed markets, this information is rapidly incorporated into prices by institutional investors running similar systematic screens. By the time a stock passes GARP's filters, the information is already reflected in the price.
The US market has thousands of quantitative funds running factor strategies. The moment a company shows PEG < 1.5 with 15%+ revenue growth, it gets bought — by machines, by quantitative analysts, by growth-value hybrid funds. The signal is correct but priced in.
In India, the same information exists but moves slower. Domestic retail investors dominate a larger share of trading volume. Analyst coverage is thinner on mid-cap stocks. A company showing PEG 0.8 and 25% revenue growth may genuinely be undervalued because fewer systematic buyers have identified it yet. The signal is correct and not yet fully priced in.
The China Exception
China (SHZ+SHH) returned 4.53% CAGR — well below SPY. But China's annual returns include one year that deserves a note: 2007, when the portfolio returned +223.9%.
Shanghai's Composite index rose 97% in 2007, driven by the pre-Olympics speculative bubble. A concentrated portfolio of 26 high-growth Chinese companies amplified that move significantly. 2007 is not a signal — it's a bubble. The 10-year trailing return for China GARP, excluding 2007, is substantially lower.
This isn't a data artifact. Chinese markets did experience a speculative bubble in 2007. The GARP screen happened to be fully invested in high-growth stocks when the bubble inflated, and the results reflect that.
The Japan Finding
Japan (JPX) returned 3.19% CAGR, underperforming SPY by 4.82 percentage points. Japan had 23% cash periods. The country's corporate culture has historically produced companies with strong revenue stability but weak ROE (excessive asset bases, low return targets, cross-shareholding). The ROE > 10% filter eliminates many Japanese companies that would otherwise pass on PEG and growth criteria.
Japan's GARP performance may improve as corporate governance reforms (shareholder return mandates, share buybacks, unwinding cross-shareholdings) take hold. The 2000–2025 period captured a Japan still in the middle of that transition.
What the Pattern Suggests
Run GARP in a market where:
- Growth information is not yet fully priced. Analyst coverage is thinner, institutional participation is lower, and systematic buyers haven't yet captured the opportunity.
- Revenue growth above 15% is genuinely predictive. In high-growth economies, early-stage growth is more durable and more predictive of future earnings. In mature economies, it's more likely to mean-revert.
- PEG ratios below 1.5 represent real undervaluation. In efficient markets, PEG < 1.5 is the market saying "this growth rate is already priced in." In less efficient markets, it can represent genuine undervaluation.
India checks all three boxes. Most developed markets check none.
Limitations
Currency. Each market's returns are in local currency. Cross-currency comparison to SPY (USD) doesn't adjust for exchange rate movements. A market in local currency can outperform SPY in USD while an international investor loses to USD strength.
Exchange-specific market cap thresholds. We use exchange-appropriate minimums (not a flat $1B USD), which affects the qualifying universe size per market.
Survivorship bias. Company profiles use current exchange listings. Delistings, bankruptcies, and mergers aren't tracked through terminal events.
25-year period. The 2000–2025 window includes multiple regime changes. Results could differ significantly over shorter or different time windows.
High-cash exchanges. Norway (71%), South Africa (31%), Indonesia, Sweden, and Korea (32–33%) all had substantial cash periods. Results for these markets reflect a mix of cash returns and strategy returns.
Takeaway
We tested GARP across 17 stock exchanges. India is the only market where the strategy meaningfully outperforms (+3.11% excess CAGR). Germany, South Africa, and the US are within 1% either way. Everything else underperforms by 2%–7%.
The finding isn't that GARP is a bad strategy. It's that the signal requires informational inefficiency to generate alpha. In a world where every institutional investor can compute PEG ratios in real time, the edge disappears in efficient markets. It survives where coverage is thinner and institutional capital is slower to move.
For global investors: India stands out. For developed-market investors: GARP is a structured way to run a quality-growth equity portfolio, but don't expect to beat the index. Germany's 78% down capture and zero cash periods make it a reasonable core strategy even without the alpha.
Run the global GARP screen on Ceta Research
Individual Exchange Posts
- GARP on US Stocks — Fully invested 25 years, still underperforms
- GARP on Indian Stocks — The only outperformer, asymmetric capture ratios
- GARP on German Stocks — Near-benchmark returns, best Sharpe of the group
References
- Lynch, P. (1989). One Up on Wall Street. Simon & Schuster.
- Fama, E. & French, K. (1998). "Value Versus Growth: The International Evidence." Journal of Finance, 53(6), 1975–1999.
- Rouwenhorst, K. (1999). "Local Return Factors and Turnover in Emerging Stock Markets." Journal of Finance, 54(4), 1439–1464.
- Griffin, J., Ji, X. & Martin, S. (2003). "Momentum Investing and Business Cycle Risk: Evidence from Pole to Pole." Journal of Finance, 58(6), 2515–2547.
Data: Ceta Research, FMP financial data warehouse. All exchanges, quarterly rebalance, equal weight, transaction costs included, 2000–2025. Returns in local currency.