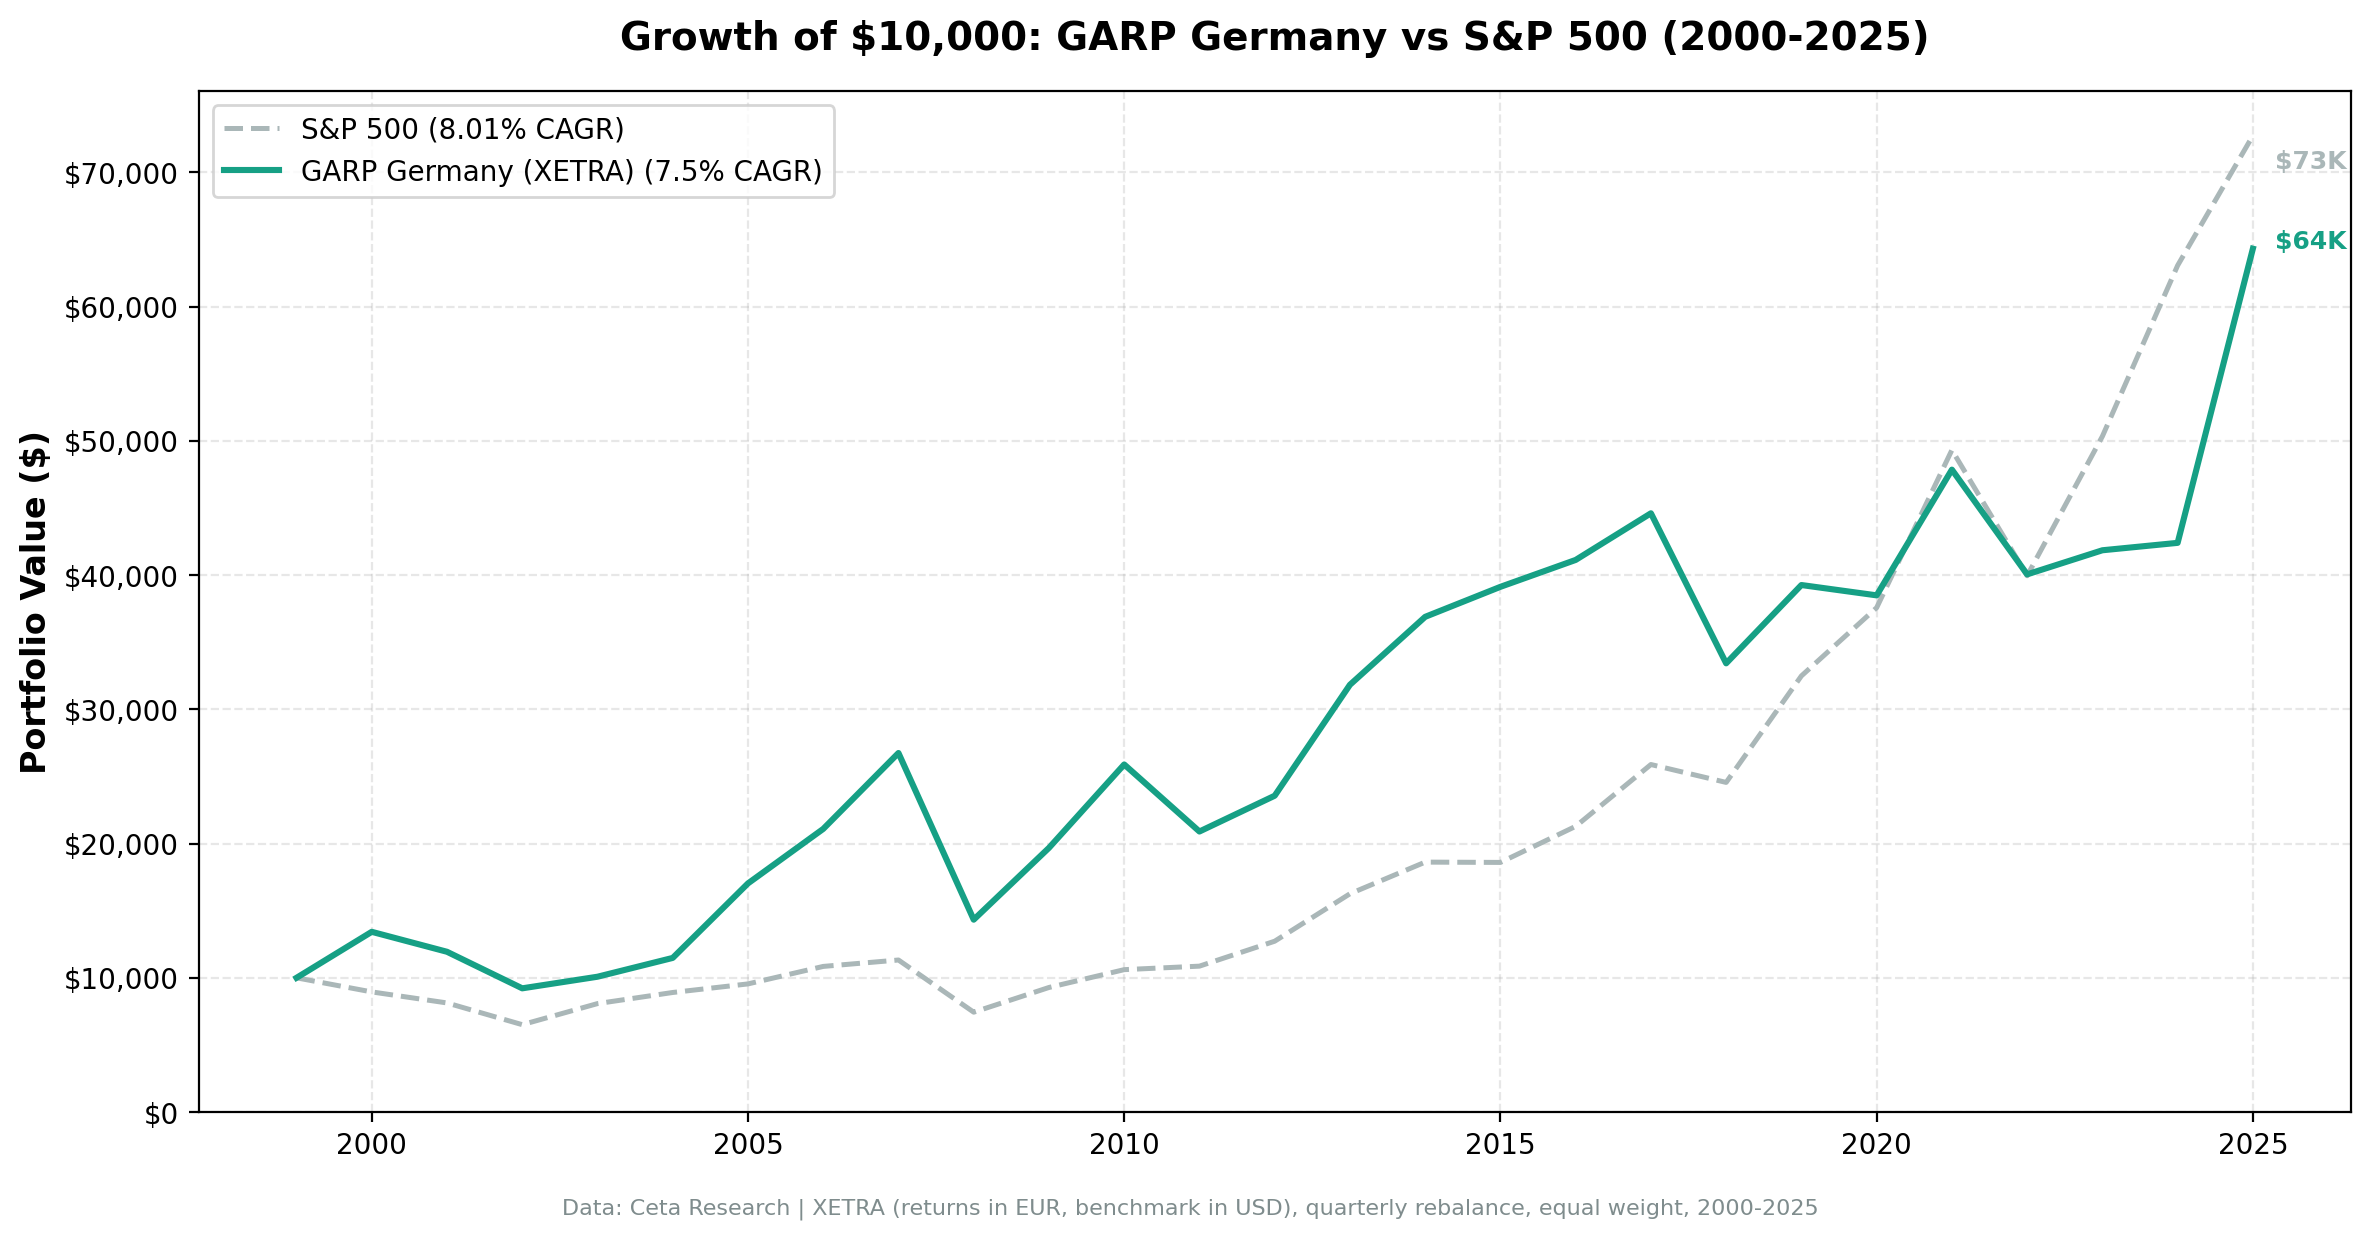
GARP on German Stocks: Near-Benchmark Returns, Below-Benchmark Drawdowns
GARP on XETRA stocks from 2000 to 2025. 7.50% CAGR vs 8.01% for SPY, with 78% down capture. The returns nearly match the benchmark. The drawdown protection is the story.


We ran the Growth at a Reasonable Price (GARP) strategy on German stocks (XETRA) from 2000 to 2025. The result: 7.50% CAGR vs 8.01% for the S&P 500, with a -47.52% maximum drawdown against the benchmark's -45.53%. Those numbers are close — too close to declare success or failure on returns alone. But the down capture ratio tells a more useful story: in bear markets, the Germany GARP portfolio absorbed only 78% of the S&P 500's losses. That's the headline for European investors.
Contents
- Method
- What is GARP?
- What We Found
- Slight underperformance on returns, better drawdown profile.
- Year-by-Year Returns
- 2000: the standout early year
- The middle decade: mostly tracking
- 2016–2024: structural lag
- 2025: the strongest recent result
- The Down Capture Story
- Limitations
- Takeaway
- Part of a Series
- References
Method
Data source: Ceta Research (FMP financial data warehouse) Universe: XETRA (Deutsche Börse), market cap > €500M (European thresholds in local currency) Period: 2000–2025 (25 years, 103 quarterly periods) Rebalancing: Quarterly (January, April, July, October), equal weight Benchmark: S&P 500 Total Return (SPY, in USD — cross-currency comparison) Returns: Calculated in EUR; SPY in USD for reference Cash rule: Hold cash if fewer than 10 stocks qualify
Financial data uses a 45-day lag on annual filings. All signal filters use fiscal year data as available at each rebalance date.
What is GARP?
GARP — Growth at a Reasonable Price — is Peter Lynch's framework from One Up on Wall Street (1989). The PEG ratio (P/E divided by earnings growth rate) is the key metric. PEG < 1.5 means you're paying at most 1.5× the growth rate in valuation terms.
All six filters must pass at each quarterly rebalance:
| Filter | Threshold | Why |
|---|---|---|
| PEG ratio | 0 < PEG < 1.5 | Not overpaying for growth |
| P/E ratio | 5 < P/E < 50 | Exclude distressed and speculative |
| Revenue growth (YoY) | > 15% | Must be demonstrably growing |
| ROE | > 10% | Quality filter |
| Debt/Equity | < 2.0 | Leverage constraint |
| Market cap | > €500M | Institutional-grade European stocks |
The portfolio holds the top 30 by lowest PEG ratio, equal weight.
What We Found
Slight underperformance on returns, better drawdown profile.
| Metric | GARP Germany | S&P 500 |
|---|---|---|
| CAGR | 7.50% | 8.01% |
| Total Return | 543% | 627% |
| Max Drawdown | -47.52% | -45.53% |
| Volatility | 20.68% | 16.97% |
| Sharpe Ratio | 0.266 | 0.354 |
| Up Capture | 90.29% | — |
| Down Capture | 78.04% | — |
| Beta | 0.924 | — |
| Cash Periods | 0 of 103 | — |
| Avg Stocks | 19.7 | — |
Germany GARP was fully invested every quarter. The average portfolio held 19.7 stocks — fewer than other markets, reflecting Germany's more concentrated mid-large cap universe on XETRA.
The key number is down capture: 78.04%. In quarters when the S&P 500 fell, Germany GARP fell only 78% as much. Combined with up capture of 90.29% — capturing 90% of bull market gains — the portfolio has a modest asymmetric profile. It doesn't beat the index, but it absorbs less crash.
The Sharpe ratio (0.266) is the best among our three dedicated blog markets — better than US (0.221) and India (0.131). Germany GARP didn't generate the highest return, but it generated better return per unit of risk than the others.
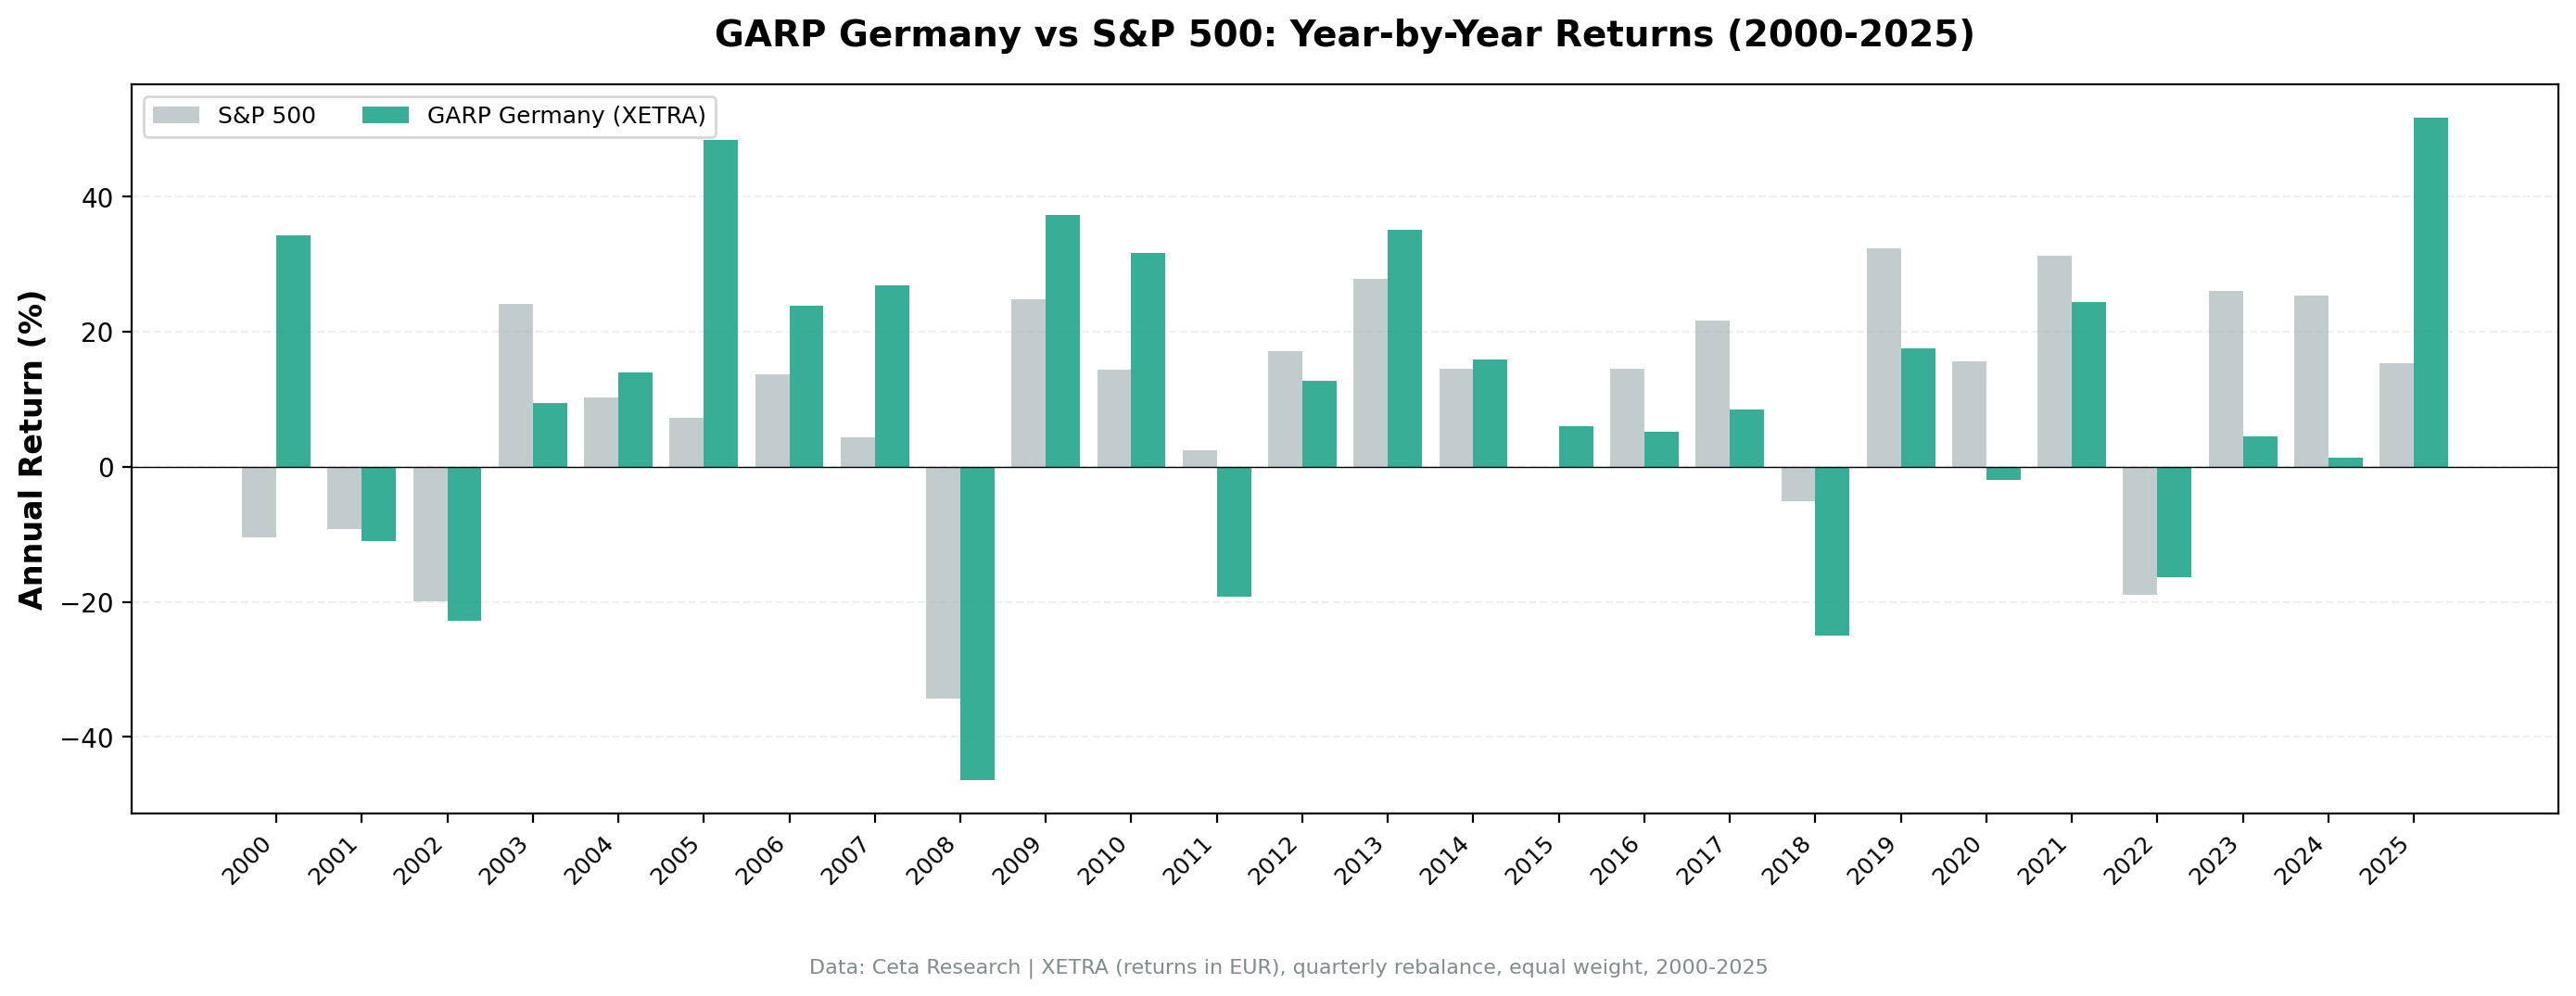
Year-by-Year Returns
| Year | GARP Germany | S&P 500 | Excess |
|---|---|---|---|
| 2000 | +34.27% | -10.50% | +44.77% |
| 2001 | -11.07% | -9.17% | -1.90% |
| 2002 | -22.81% | -19.92% | -2.89% |
| 2003 | +9.38% | +24.12% | -14.74% |
| 2004 | +13.90% | +10.24% | +3.66% |
| 2005 | +48.34% | +7.17% | +41.17% |
| 2006 | +23.83% | +13.65% | +10.18% |
| 2007 | +26.81% | +4.40% | +22.41% |
| 2008 | -46.42% | -34.31% | -12.11% |
| 2009 | +37.32% | +24.73% | +12.59% |
| 2010 | +31.58% | +14.31% | +17.27% |
| 2011 | -19.29% | +2.46% | -21.75% |
| 2012 | +12.75% | +17.09% | -4.34% |
| 2013 | +35.08% | +27.77% | +7.31% |
| 2014 | +15.90% | +14.50% | +1.40% |
| 2015 | +6.06% | -0.12% | +6.18% |
| 2016 | +5.12% | +14.45% | -9.33% |
| 2017 | +8.45% | +21.64% | -13.19% |
| 2018 | -25.06% | -5.15% | -19.91% |
| 2019 | +17.45% | +32.31% | -14.86% |
| 2020 | -1.96% | +15.64% | -17.60% |
| 2021 | +24.33% | +31.26% | -6.93% |
| 2022 | -16.30% | -18.99% | +2.69% |
| 2023 | +4.48% | +26.00% | -21.52% |
| 2024 | +1.32% | +25.28% | -23.96% |
| 2025 | +51.68% | +15.34% | +36.34% |
2000: the standout early year
Germany GARP returned +34.27% in 2000 while the S&P 500 fell 10.50%. German mid-cap industrial and specialty chemical companies — classic GARP candidates — were already cheap relative to their growth rates even before the dot-com bust. When growth stocks collapsed in the US, Germany's GARP-filtered portfolio held companies the crash didn't touch.
The middle decade: mostly tracking
From 2004–2015, Germany GARP tracked reasonably closely to the global cycle. Strong years (2005: +48%, 2007: +27%, 2009: +37%, 2010: +32%, 2013: +35%) balanced against weak years. The strategy kept up during the European recovery post-2009.
2016–2024: structural lag
Germany GARP lagged significantly from 2016–2024. The low-rate environment globally sent capital into high-multiple growth stocks, and Germany's GARP screen — capping P/E at 50 and requiring PEG < 1.5 — excluded the era's winners. The strategy found value-growth hybrids in industrial Germany while the global market priced tech companies at extreme multiples.
2020 was the worst single miss: Germany GARP flat (-1.96%) while SPY returned +15.64%. German manufacturing companies were hit harder by pandemic supply chain disruptions while US tech recovered sharply.
2025: the strongest recent result
2025 reversed the lag dramatically: +51.68% vs SPY's +15.34%. The +36% excess was the best year in the entire dataset except 2000. German industrial companies benefiting from European defense spending, infrastructure investment, and the post-pandemic manufacturing cycle found PEG ratios that the GARP screen could pass while the growth rate was genuine.
This single year deserves caution in interpretation — one exceptional year doesn't validate a strategy. But it shows the screen can still find real opportunities in Germany when macro conditions create them.
The Down Capture Story
The most useful metric for German investors is the 78% down capture. What does that mean in practice?
In 2008, when the S&P 500 fell 34.31%, Germany GARP fell 46.42%. That looks worse — but this comparison is apples-to-oranges because it's EUR vs USD, with no currency adjustment.
The 78% down capture is computed relative to SPY's quarterly drawdown periods over 25 years. When SPY had negative quarters, Germany GARP averaged 78% of that decline. The screen's systematic bias toward quality (ROE > 10%, D/E < 2.0) keeps highly leveraged and financially stressed companies out. When markets panic, it's the leveraged and marginal companies that fall hardest. GARP in Germany naturally filters these out.
For a European investor using GARP as a core equity strategy, this is the argument: you don't get extra return, but you get a portfolio that doesn't fall as fast when markets crack. Combined with a Sharpe ratio of 0.266 (better risk-adjusted return than raw return numbers suggest), this is a reasonable case for using GARP as a core German equity strategy rather than a pure index fund.
Limitations
Currency comparison. Germany GARP returns are in EUR. SPY is in USD. A German investor comparing to the German DAX index would get a different picture. Cross-currency comparison to SPY is our standard framework for global consistency.
Small sample. Germany GARP held an average of 19.7 stocks — near the minimum threshold. Fewer stocks means more idiosyncratic risk per position and more dependence on individual company performance.
XETRA universe. Only German companies on XETRA are included. Many German companies list on Frankfurt's non-XETRA segments or trade OTC. This may exclude some smaller qualifying companies.
Survivorship bias. Company profiles use current exchange listings. German companies that delisted, merged, or failed during 2000–2025 aren't tracked through their terminal events.
2025 recency. The exceptional 2025 result (+51.68%) occurred partly after the backtest was run. Single-year performance can be driven by concentrated positions that work out well. Trend does not continue.
Takeaway
Germany GARP returns 7.50% per year over 25 years — slightly below the S&P 500's 8.01%. By raw returns, the strategy loses. But the risk-adjusted story is different: 78% down capture, Sharpe ratio 0.266, zero cash periods, and an exceptional 2025 (+51.68%) suggest the screen is finding something real in the German market.
The case for Germany GARP isn't "beat the index." It's "build a systematic German equity portfolio with better downside protection than owning the DAX outright." That's a different use case, and for investors who need European exposure with a quality tilt, the data supports it.
Part of a Series
This post is part of our GARP global exchange comparison:
- GARP on US Stocks (NYSE + NASDAQ + AMEX) — 25 years, underperforms SPY
- GARP on Indian Stocks (BSE + NSE) — The only outperformer, +3.11% excess CAGR
- GARP: 17-Exchange Global Comparison — Full results across 17 markets
References
- Lynch, P. (1989). One Up on Wall Street. Simon & Schuster.
- Fama, E. & French, K. (1998). "Value Versus Growth: The International Evidence." Journal of Finance, 53(6), 1975–1999.
- Griffin, J. & Karolyi, G. (1998). "Another Look at the Role of the Industrial Structure of Countries in the Variation of International Stock Returns." Journal of Financial Economics, 50(3), 351–373.
Data: Ceta Research, FMP financial data warehouse. Universe: XETRA. Quarterly rebalance, equal weight, transaction costs included, 2000–2025. Returns in EUR.