
EV/EBITDA Value Backtest: Sweden (STO), 2000–2024


EV/EBITDA Backtest: Sweden (STO), 2000–2024
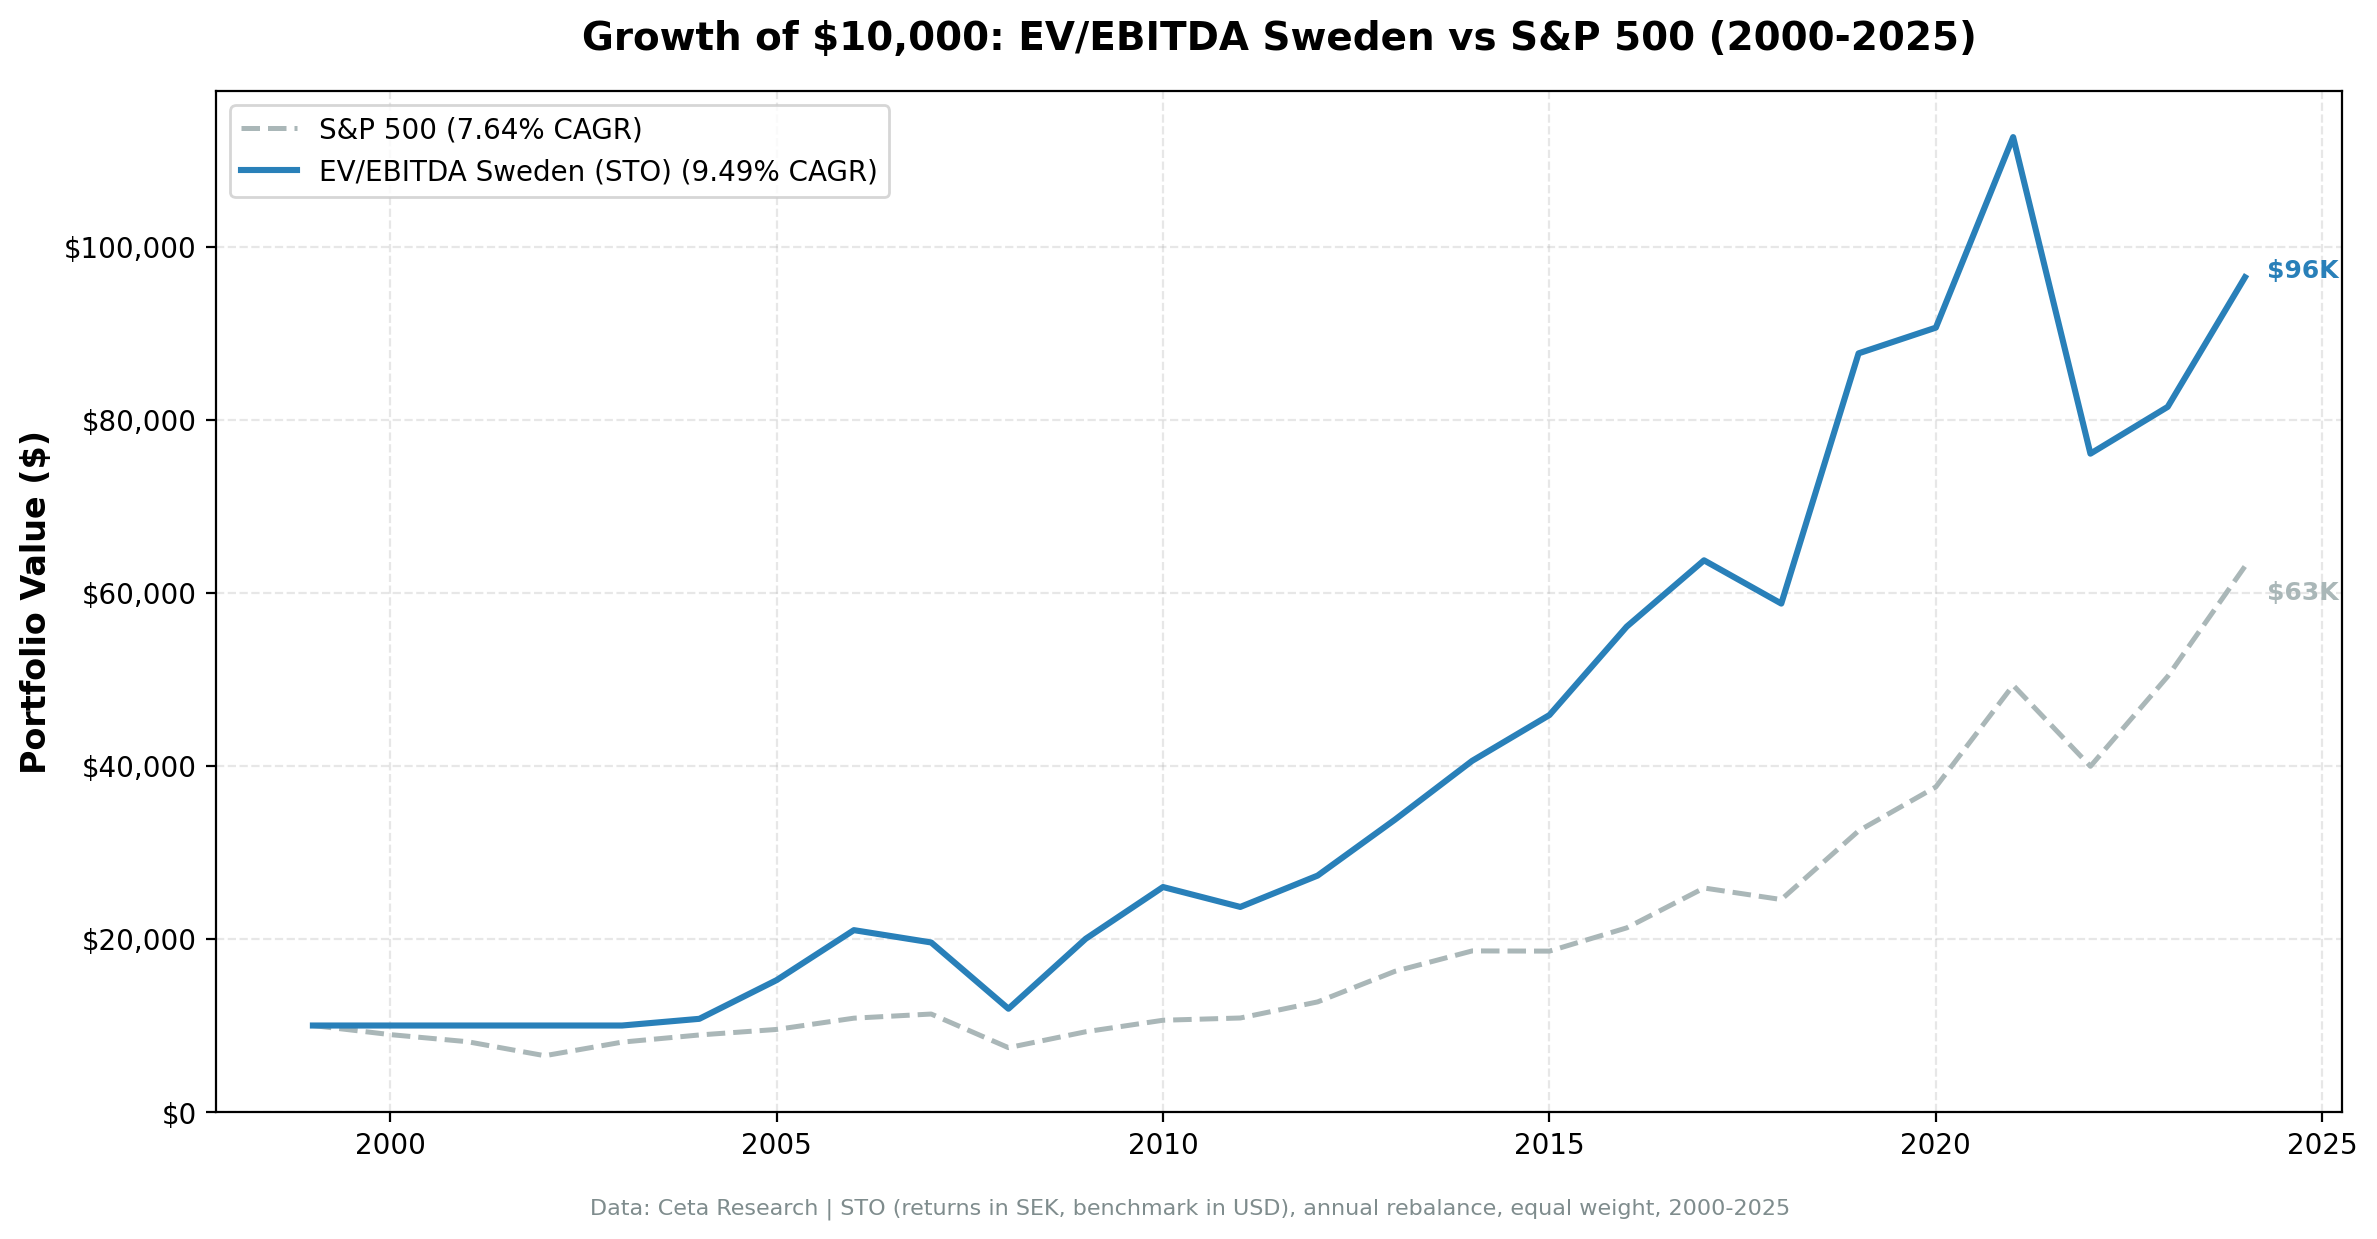
Sweden has one of the more interesting profiles for a simple value screen. The Stockholm exchange is heavy in industrials, engineering, and materials. These sectors tend to have lower EV/EBITDA multiples than tech-heavy markets, which means the screen has plenty to work with. Over 25 years, the strategy returned 9.74% CAGR versus 2.95% for the OMX Stockholm 30, outperforming in 76% of years. A real gap, built on consistent annual edges rather than a handful of lucky years.
Contents
Method
Each January, rank Stockholm-listed stocks by EV/EBITDA (ascending). Filter: EV/EBITDA between 0 and 10, ROE above 10%, market cap above 5B SEK. Hold the cheapest 30 qualifying stocks for the year. If fewer than 5 qualify, hold cash. Rebalance annually. Execution uses next-day close prices (MOC) to avoid look-ahead bias on the rebalance signal.
Returns are in SEK. The benchmark is the OMX Stockholm 30 (^OMXS30), also in SEK. This is a direct, currency-neutral comparison.
What We Found
The EV/EBITDA screen on Stockholm delivered a 9.74% CAGR over 25 years, versus 2.95% for the OMX Stockholm 30. That's a 6.79 percentage point annual edge, and the strategy outperformed in 76% of years.
| Metric | EV/EBITDA (STO) | OMX Stockholm 30 |
|---|---|---|
| CAGR | 9.74% | 2.95% |
| Sharpe | 0.331 | — |
| Max Drawdown | -43.21% | -57.52% |
| Sortino | 0.686 | — |
| Calmar | 0.225 | — |
| Alpha | 6.85% | — |
| Beta | 0.931 | — |
| Up Capture | 134.5% | — |
| Down Capture | 50.7% | — |
| Win Rate | 76% | — |
| Avg Stocks | 26.7 | — |
| Cash Periods | 4/25 | — |
The Sortino ratio of 0.686 stands out. Despite the -43.21% max drawdown (which is actually shallower than OMX30's -57.52%), the downside volatility is well-controlled. The strategy captures 134.5% of up moves and only 50.7% of down moves against the local index. That asymmetry is the core of the return story.
Year-by-Year
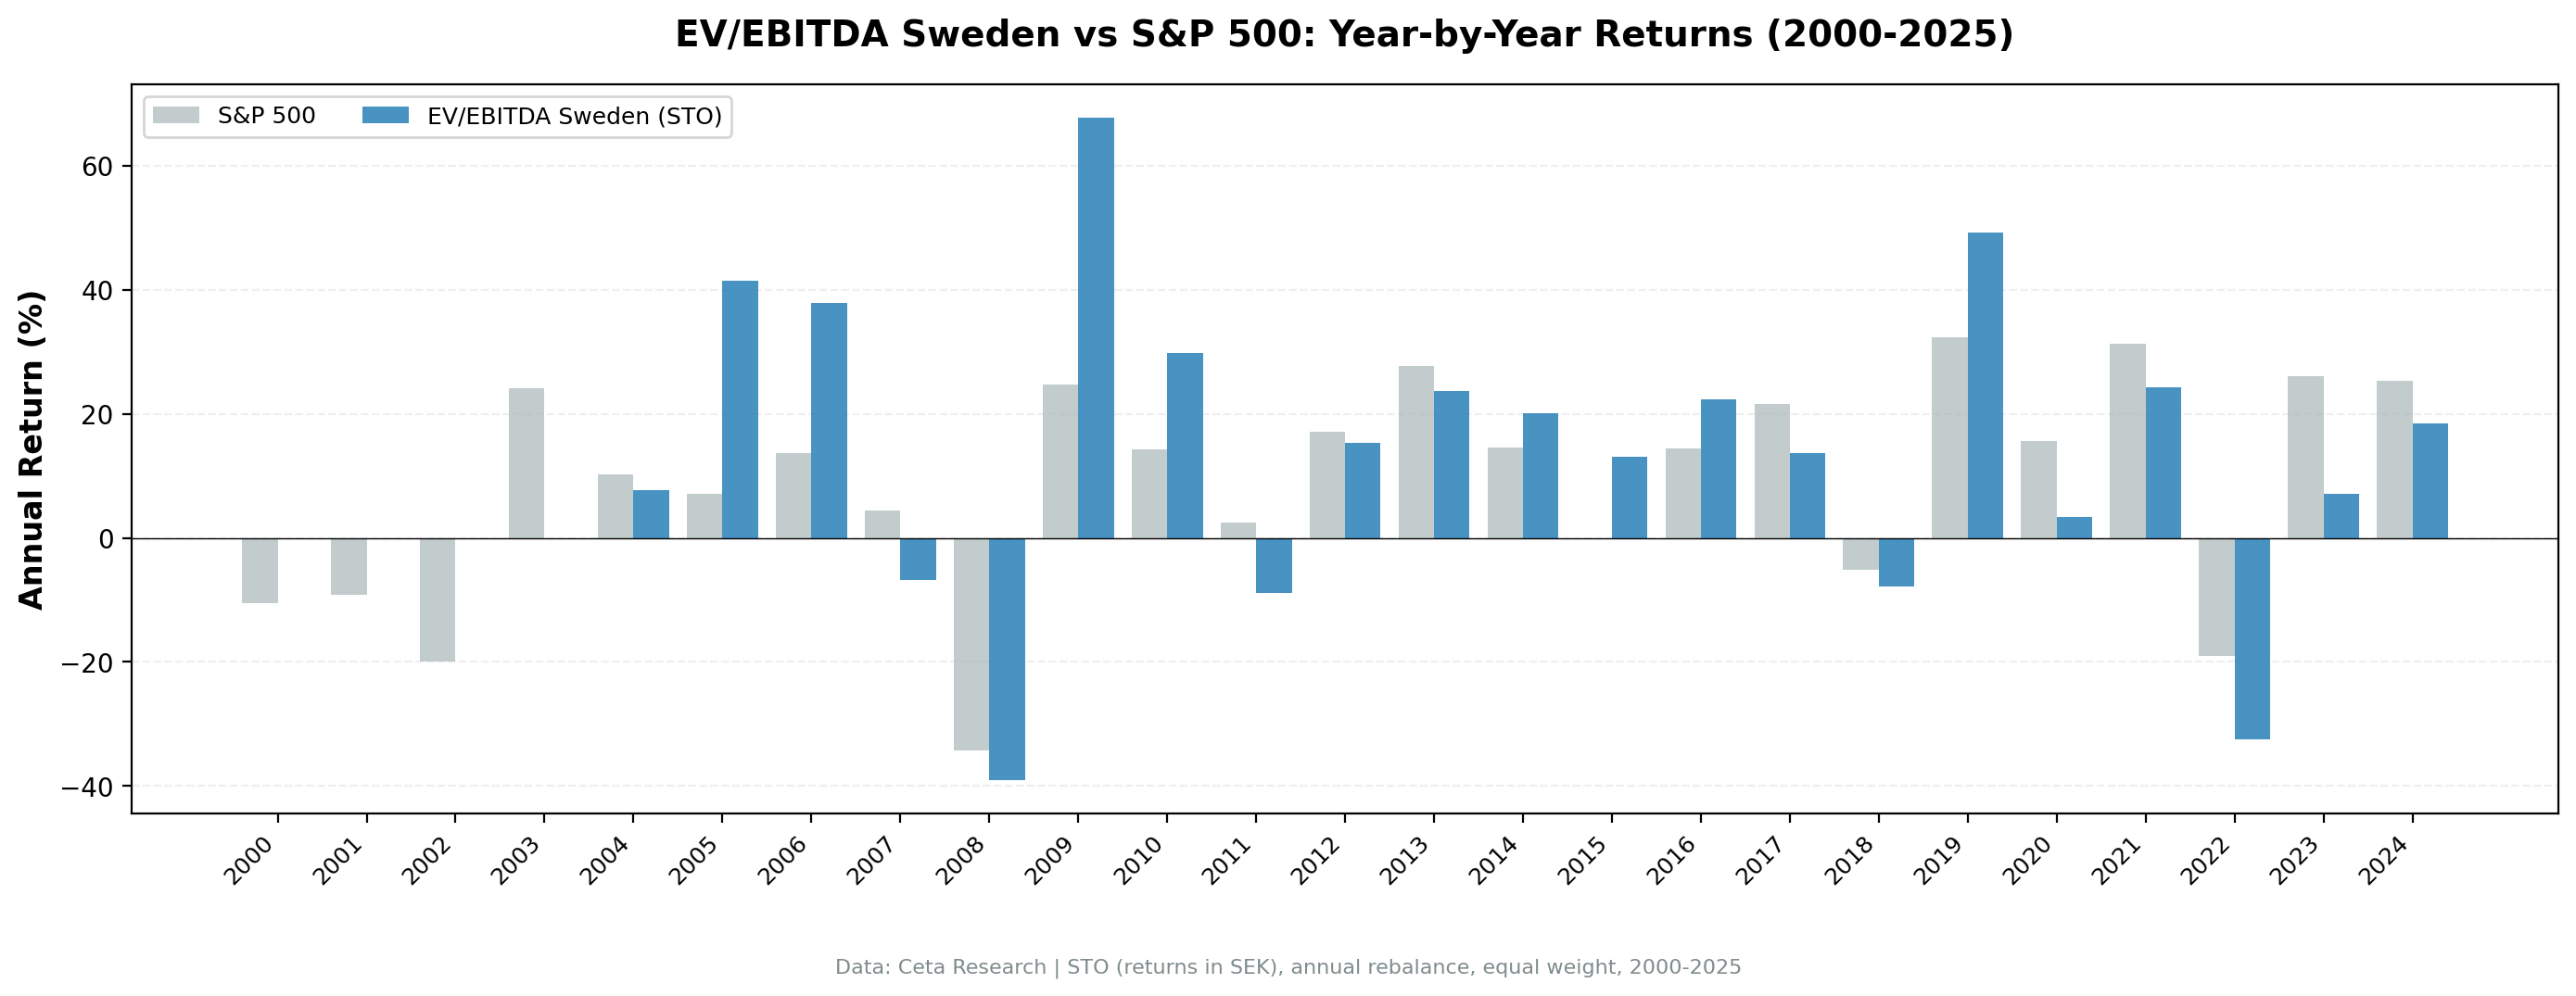
The strategy sat in cash for the first four years (2000–2003). The Stockholm universe at that time didn't have enough stocks meeting the size and EV/EBITDA thresholds simultaneously. That means 21 invested years, not 25.
Once the strategy started running in 2004, it built momentum quickly. The 2005 and 2006 years, +41.5% and +37.9%, reflected a broad European value rally where Swedish industrials led. Both crushed the OMX30 (2005: +28.8%, 2009: +38.9%). Then 2007 was a flat-to-down year, and 2008 hit hard (-39.1%).
The standout year is 2019: +46.0% vs OMX30's +28.6%. Swedish industrials and materials were in a recovery phase after a difficult 2018, and the EV/EBITDA screen caught the right sectors.
The worst relative year was 2022: -32.5% vs OMX30 -15.1%. Sweden's market took a harder hit during the rate-tightening cycle. The SEK weakened and Swedish housing and credit markets added domestic pressure on top of global macro headwinds. The strategy's drawdown was still better than OMX30's worst year during the financial crisis (-57.52% peak-to-trough).
| Year | Strategy | OMX Stockholm 30 |
|---|---|---|
| 2000–2003 | 0% (cash) | varies |
| 2005 | +41.5% | +28.8% |
| 2006 | +37.9% | +13.7% |
| 2008 | -39.1% | varies |
| 2009 | +67.8% | +38.9% |
| 2019 | +46.0% | +28.6% |
| 2022 | -32.5% | -15.1% |
| 2024 | +18.4% | +25.3% |
Why Sweden Works for Value Screens
The Stockholm exchange has a structural advantage for EV/EBITDA screening. The market's largest sectors, industrials (Atlas Copco, Sandvik, SKF), materials (Boliden), and financials, generate consistent operating earnings and carry lower enterprise value multiples than comparable US firms. Growth stock premiums are more muted. That means the cheapest EV/EBITDA decile actually contains quality businesses, not just distressed ones.
The 50.7% down-capture ratio supports this. Swedish value stocks don't crash as hard as the OMX30 in downturns because they started cheaper. The premium you're paying for expected earnings is lower, so the compression when sentiment shifts is also lower. The strategy's -43.21% max drawdown compares favorably to the OMX30's -57.52%.
The 76% win rate against the local index is strong. The strategy outperformed the OMX30 in 19 of 25 years (including cash years where it avoided OMX30 declines). The alpha of 6.85% is real and consistent, not just driven by a few outlier years.
Run It Yourself
Current cheap EV/EBITDA stocks on Stockholm:
SELECT
    k.symbol,
    p.companyName,
    p.sector,
    ROUND(k.evToEBITDATTM, 2)            AS ev_ebitda,
    ROUND(k.returnOnEquityTTM * 100, 1)  AS roe_pct,
    ROUND(k.marketCap / 1e9, 2)          AS mktcap_b
FROM key_metrics_ttm k
JOIN profile p ON k.symbol = p.symbol
WHERE k.evToEBITDATTM > 0
  AND k.evToEBITDATTM < 10
  AND k.returnOnEquityTTM > 0.10
  AND k.marketCap > 5000000000
  AND p.exchange IN ('STO')
QUALIFY ROW_NUMBER() OVER (PARTITION BY k.symbol ORDER BY k.evToEBITDATTM ASC) = 1
ORDER BY k.evToEBITDATTM ASC
LIMIT 30
Run this query on Ceta Research
Replicate the full backtest:
python run_backtest.py --strategy ev-ebitda --exchange STO --start 2000 --end 2024
Limitations
Returns and benchmark are both in SEK, so the comparison is currency-neutral.
The four cash years (2000–2003) reduce the effective sample. The strategy has 21 invested years, not 25. Compounding over cash years flatters the CAGR slightly relative to a strategy that was always invested.
Market cap threshold of 5B SEK is fixed in nominal terms. In real purchasing power, 5B SEK in 2000 is worth more than 5B SEK in 2024. This means the universe naturally expands over time as more companies cross the threshold, slightly increasing diversification in later years.
The backtest uses MOC (market-on-close) execution: signals are generated from prior-year data and trades execute at next-day close prices. This avoids look-ahead bias but assumes close-price fills are achievable. Swedish mid-cap stocks can have meaningful bid-ask spreads. Live implementation on a similarly-sized portfolio would reduce returns.
No survivorship bias correction. Delisted stocks are excluded, which likely overstates returns modestly.
Data: Ceta Research (FMP financial data warehouse), 2000–2025. Full methodology: backtests/METHODOLOGY.md. Backtest code: backtests/ev-ebitda/.


