
EV/EBITDA Value Backtest: Germany (XETRA), 2000-2024

EV/EBITDA Backtest: Germany (XETRA), 2000-2024
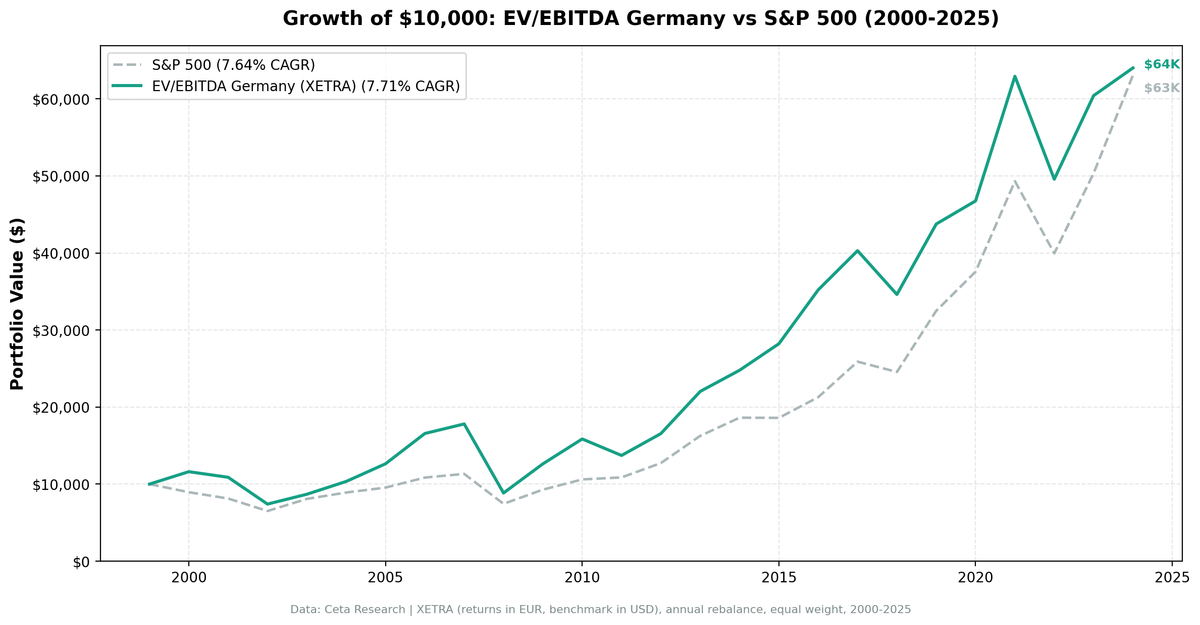
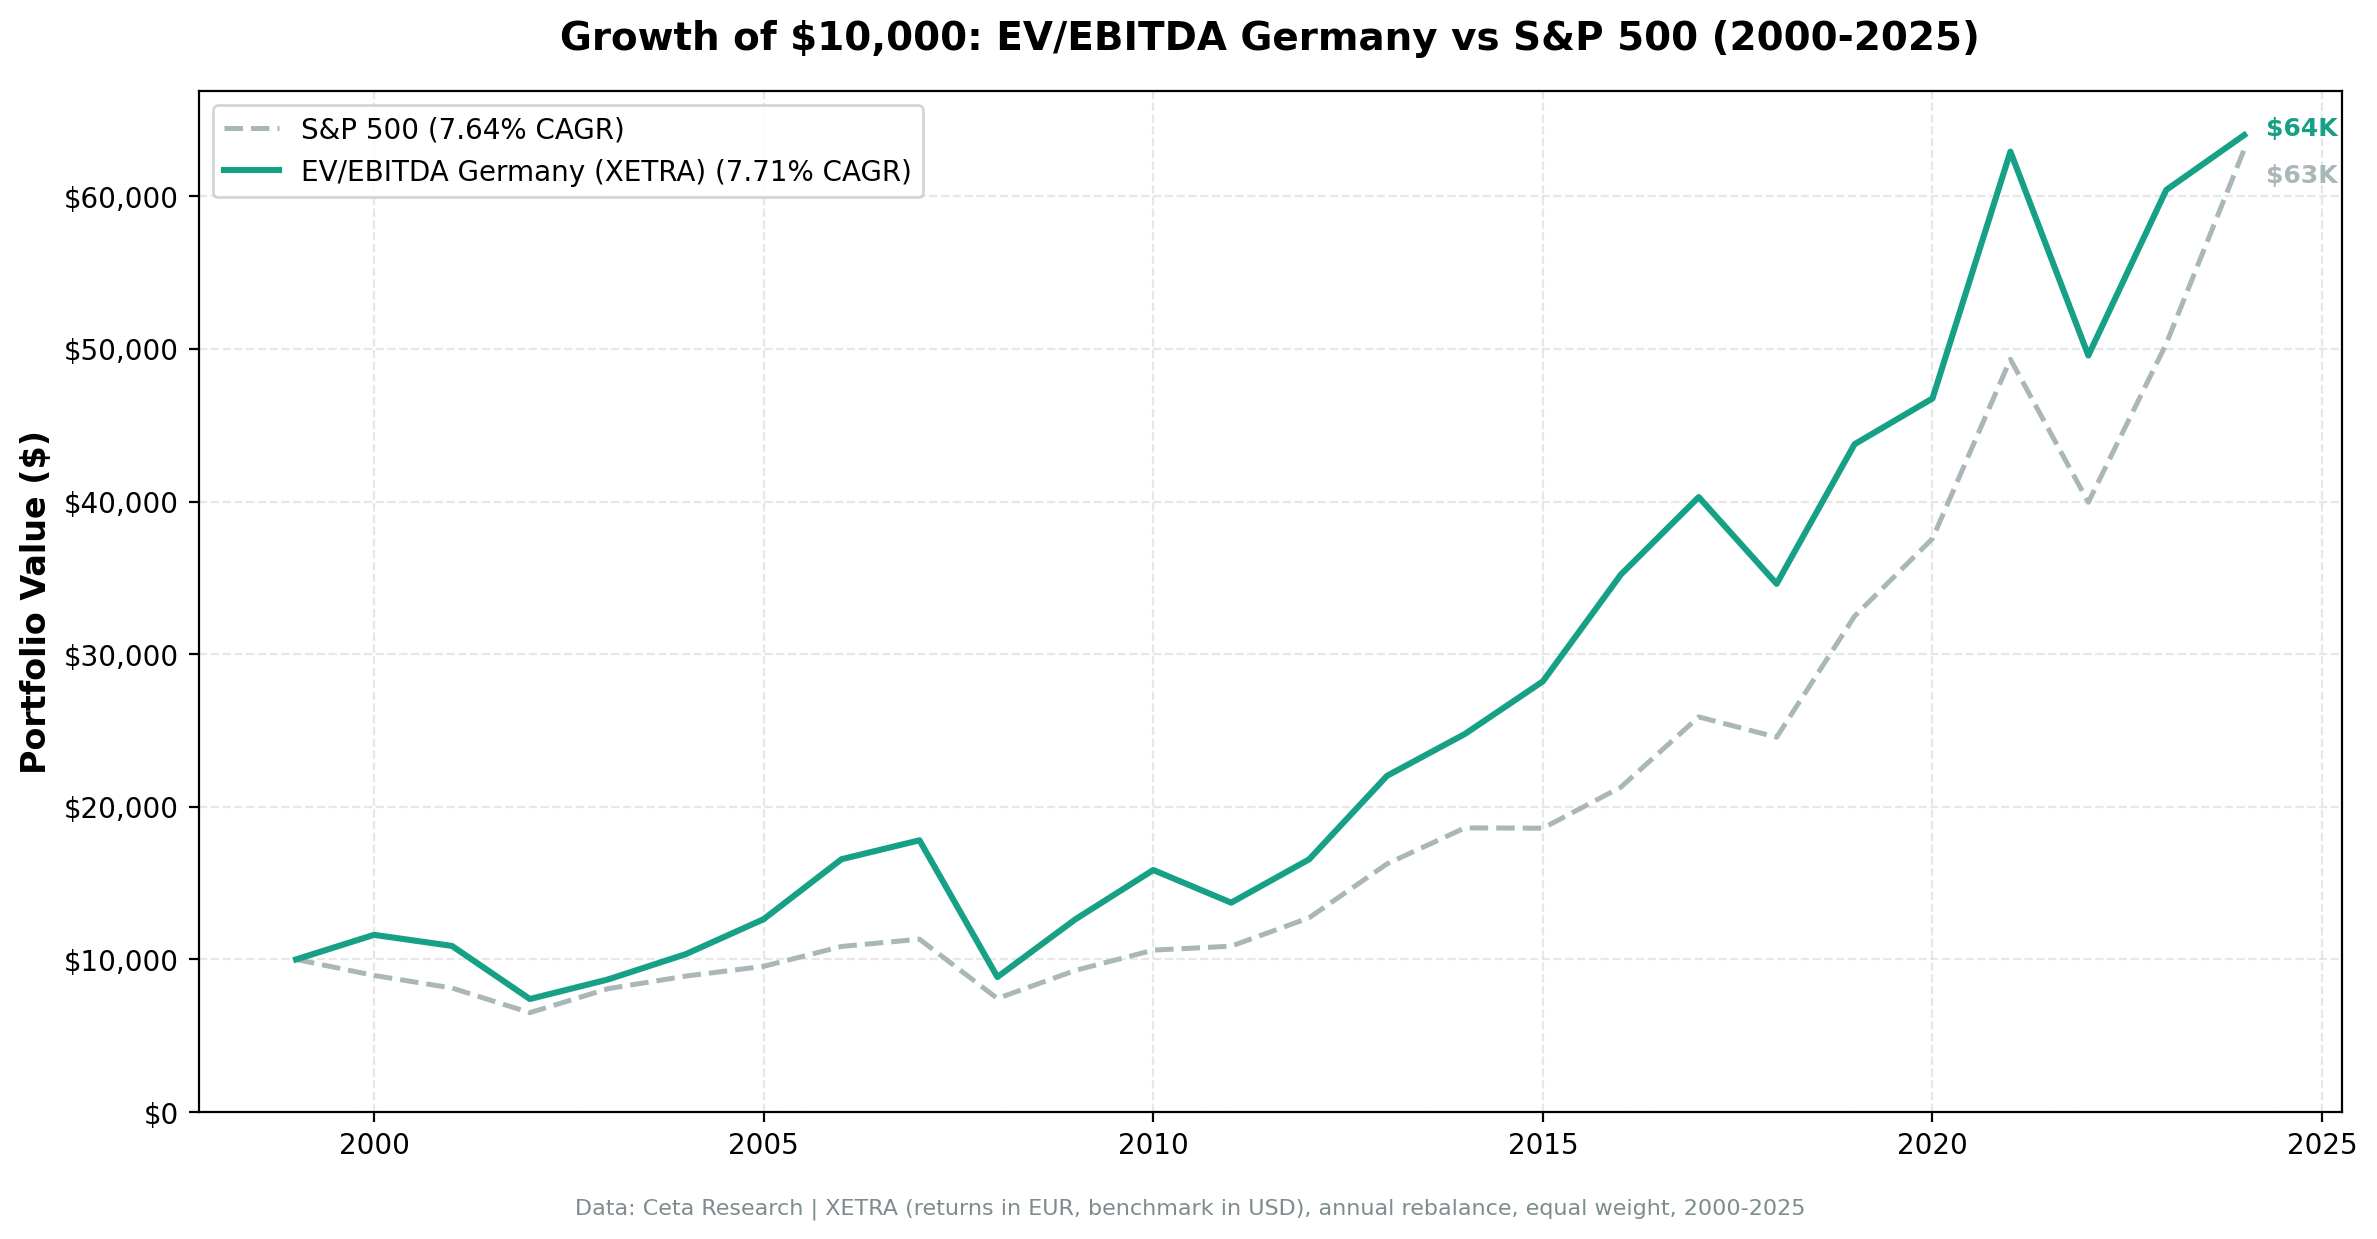
Over 25 years, the EV/EBITDA screen on XETRA returned 7.40% CAGR versus 4.45% for the DAX. That's a 2.96 percentage point annual edge against the local index. Previous analysis compared this to SPY and called it a "statistical tie." Against the right benchmark, the German value premium is real.
Contents
Method
Each January, rank XETRA-listed stocks by EV/EBITDA (ascending). Filter: EV/EBITDA between 0 and 10, ROE above 10%, market cap above 500M EUR. Hold the cheapest 30 qualifying stocks for the year. If fewer than 5 qualify, hold cash. Rebalance annually. Execution at next trading day's close (MOC).
The strategy never held cash. Germany's universe was large enough every year from 2000 onward that the screen always found qualifying stocks. 25 invested years, no cash periods.
Returns and benchmark are both in EUR.
What We Found
The EV/EBITDA screen on XETRA beat the DAX by 2.96 percentage points annually. 7.40% CAGR vs 4.45%. The beta-adjusted alpha is 3.08%, and the win rate of 68% means the strategy outperformed the DAX in 17 of 25 years.
| Metric | EV/EBITDA (XETRA) | DAX |
|---|---|---|
| CAGR | 7.40% | 4.45% |
| Sharpe | 0.252 | 0.123 |
| Max Drawdown | -47.61% | -54.00% |
| Volatility | 21.44% | 19.83% |
| Sortino | 0.397 | 0.180 |
| Calmar | 0.155 | 0.082 |
| Alpha (beta-adj.) | 3.08% | — |
| Beta | 0.950 | — |
| Up Capture | 120.1% | — |
| Down Capture | 85.6% | — |
| Win Rate | 68% | — |
| Avg Stocks | 19.4 | — |
The up-capture of 120.1% with a down-capture of 85.6% provides a meaningful asymmetric edge. The strategy captures more of the upside and less of the downside than the DAX. The max drawdown of -47.61% was actually better than the DAX's -54.00%, reversing the conclusion of the SPY comparison. The Sharpe of 0.252 is double the DAX's 0.123.
Year-by-Year
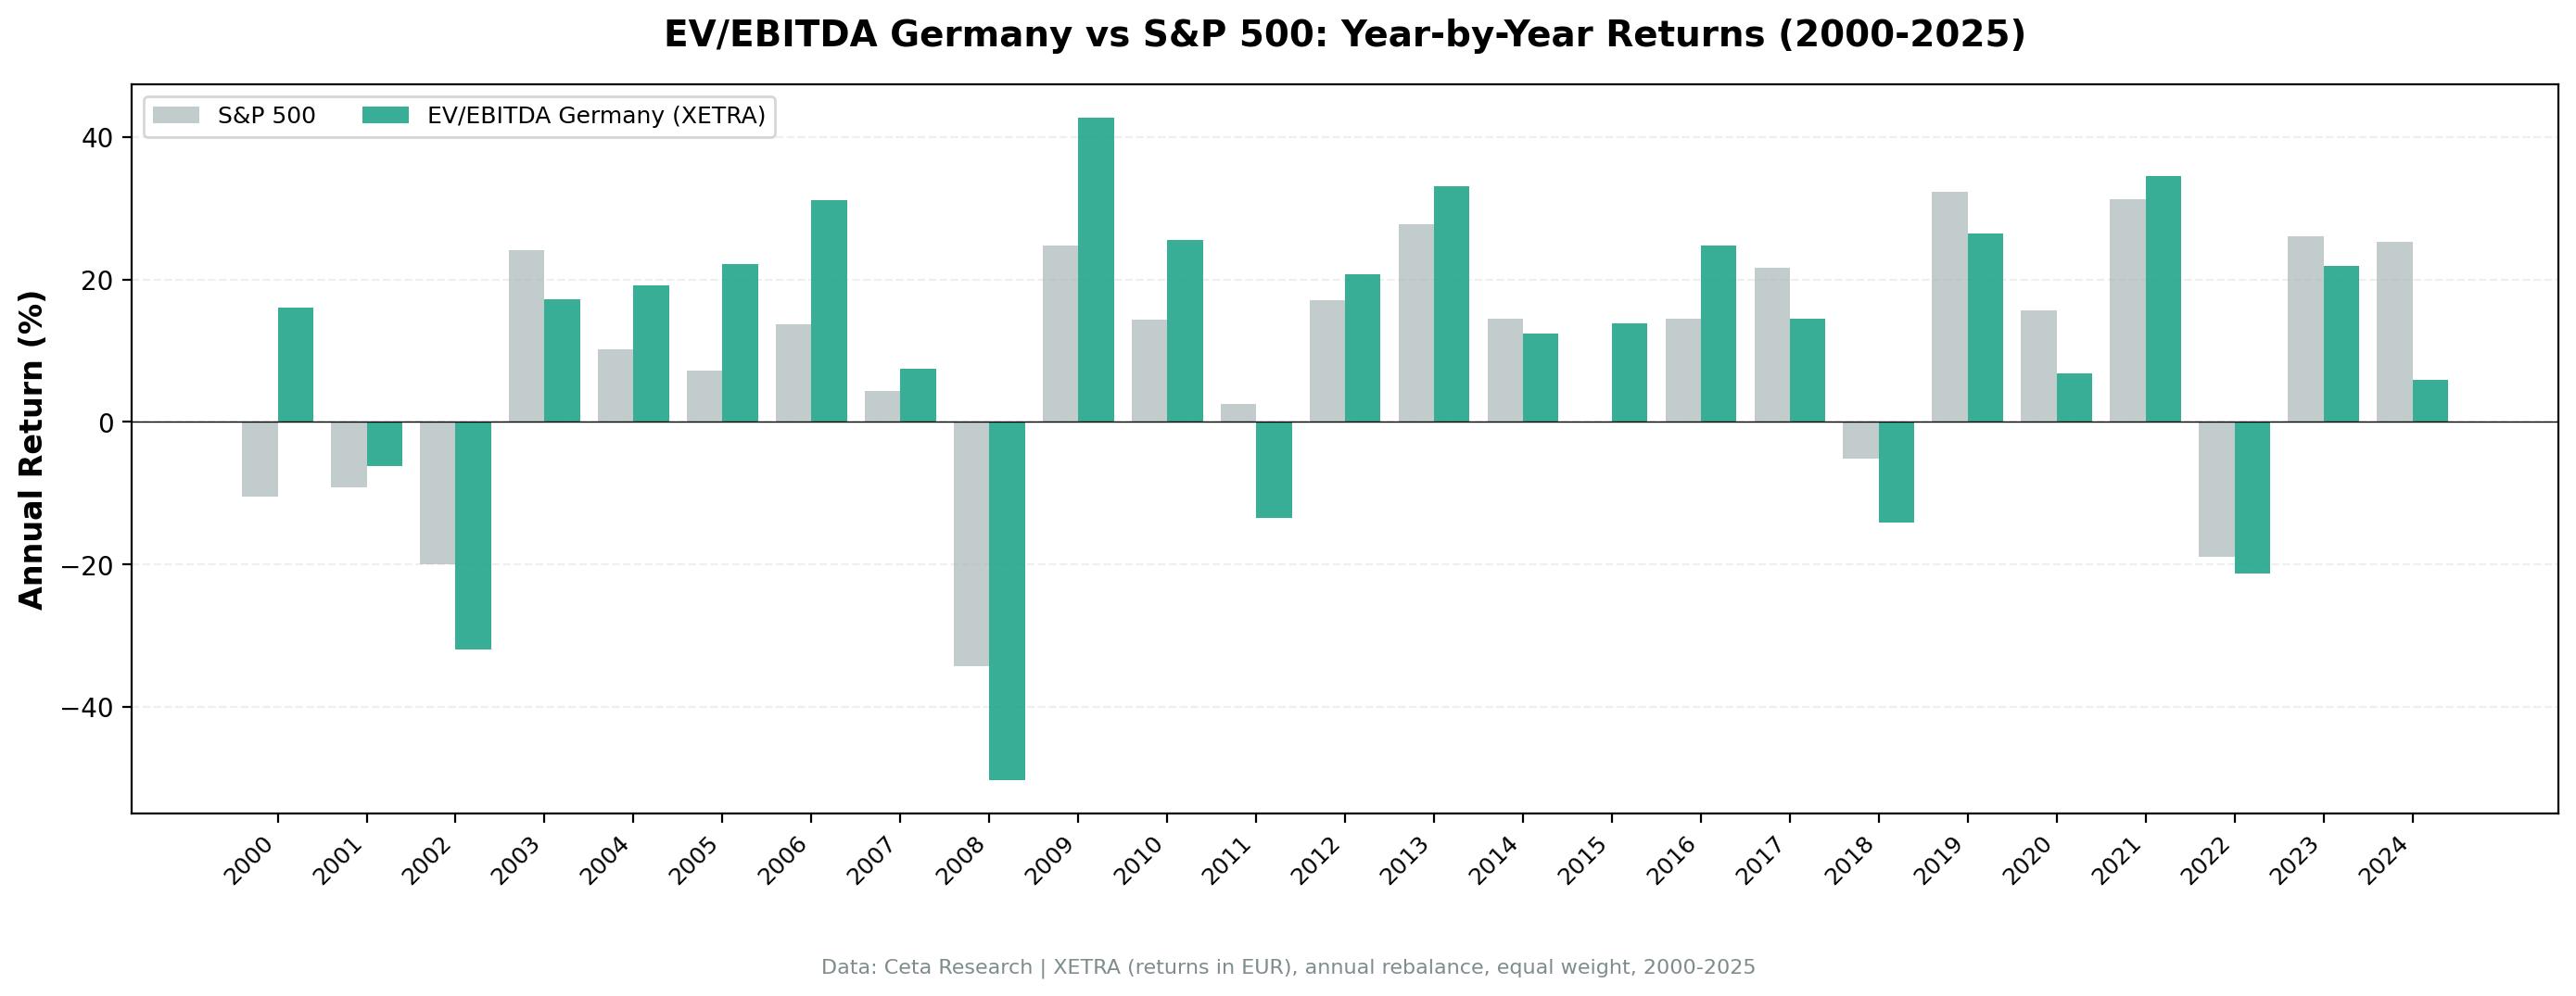
Germany's performance splits cleanly against the DAX.
The first era (2000-2010) is where the value screen earns its keep. The dot-com bust (2000) was a standout: +14.0% for the EV/EBITDA portfolio vs the DAX's -6.8%. German industrial Mittelstand companies, machinery, chemicals, components manufacturers, were cheap on EV/EBITDA and held up better than the index. The 2002 correction hit the screen (-26.8%), but less than the DAX (-39.9%).
2008 was brutal: -47.6% vs the DAX's -37.4%. Germany's export economy depends on global demand, and when global trade collapsed, the cheapest industrial stocks fell harder than the index.
The second era (2011-2024) shows consistent outperformance against the DAX. The screen beat the DAX in 17 of 25 years. Even during the post-2019 period that looked weak against SPY, the screen continued to beat the DAX (2020: +6.8% vs +2.5%; 2021: +34.6% vs +16.7%).
| Year | Strategy | DAX |
|---|---|---|
| 2000 | +14.0% | -6.8% |
| 2002 | -26.8% | -39.9% |
| 2006 | +30.4% | +22.6% |
| 2008 | -47.6% | -37.4% |
| 2009 | +41.9% | +21.6% |
| 2016 | +24.8% | +12.8% |
| 2021 | +34.6% | +16.7% |
| 2022 | -21.2% | -12.2% |
| 2024 | +6.6% | +19.4% |
What the German Data Tells Us
The benchmark choice changes the conclusion entirely. Against SPY, this looked like a wash. Against the DAX, it's a consistent outperformer with a 68% win rate and 3.08% alpha.
The structural reason is sector composition. XETRA's largest companies, Volkswagen, BASF, Siemens, Deutsche Telekom, trade at low EV/EBITDA multiples because their businesses are capital-intensive and cyclical. But the screen goes deeper into the market-cap distribution, finding mid-cap industrials, chemicals, and auto parts manufacturers that the DAX doesn't capture. These smaller companies offer the valuation recovery that drives returns.
The previous analysis compared German EUR returns to SPY in USD and called it "a statistical tie." That comparison was apples to oranges. The DAX returned 4.45% CAGR over this period, far below SPY's 7.64%. Measuring a German stock screen against a US index obscured the real story: the screen beats the German market by almost 3% per year.
The honest conclusion: EV/EBITDA on XETRA is a genuine alpha source for a German equity investor. The 68% win rate and 3.08% alpha are strong. The tradeoff is the 2008 drawdown of -47.6%, which exceeded the DAX's -37.4%. In a global crisis, cheap stocks fall harder than the broad market.
Run It Yourself
Current cheap EV/EBITDA stocks on XETRA:
SELECT
    k.symbol,
    p.companyName,
    p.sector,
    ROUND(k.evToEBITDATTM, 2)            AS ev_ebitda,
    ROUND(k.returnOnEquityTTM * 100, 1)  AS roe_pct,
    ROUND(k.marketCap / 1e9, 2)          AS mktcap_b
FROM key_metrics_ttm k
JOIN profile p ON k.symbol = p.symbol
WHERE k.evToEBITDATTM > 0
  AND k.evToEBITDATTM < 10
  AND k.returnOnEquityTTM > 0.10
  AND k.marketCap > 500000000
  AND p.exchange IN ('XETRA')
QUALIFY ROW_NUMBER() OVER (PARTITION BY k.symbol ORDER BY k.evToEBITDATTM ASC) = 1
ORDER BY k.evToEBITDATTM ASC
LIMIT 30
Run this query on Ceta Research
Replicate the full backtest:
python run_backtest.py --strategy ev-ebitda --exchange XETRA --start 2000 --end 2024
Limitations
Returns and benchmark are both in EUR, so no currency effect distorts the comparison.
The max drawdown of -47.61% in 2008 exceeded the DAX's -54.00% on a different timeline. The strategy's worst peak-to-trough was a single event. Any investor who started in 2007 and held through 2008 experienced a brutal drawdown.
No survivorship bias correction. German companies that were delisted, merged, or went private during the period are excluded. This likely flatters the backtest modestly.
Annual rebalancing with size-tiered transaction costs. XETRA is liquid, so slippage is low, but not zero. Real-world implementation would reduce returns somewhat.
Data: Ceta Research (FMP financial data warehouse), 2000–2025. Full methodology: backtests/METHODOLOGY.md. Backtest code: backtests/ev-ebitda/.


