
EV/EBITDA Below 10x on the TSX: 25-Year Canada Backtest

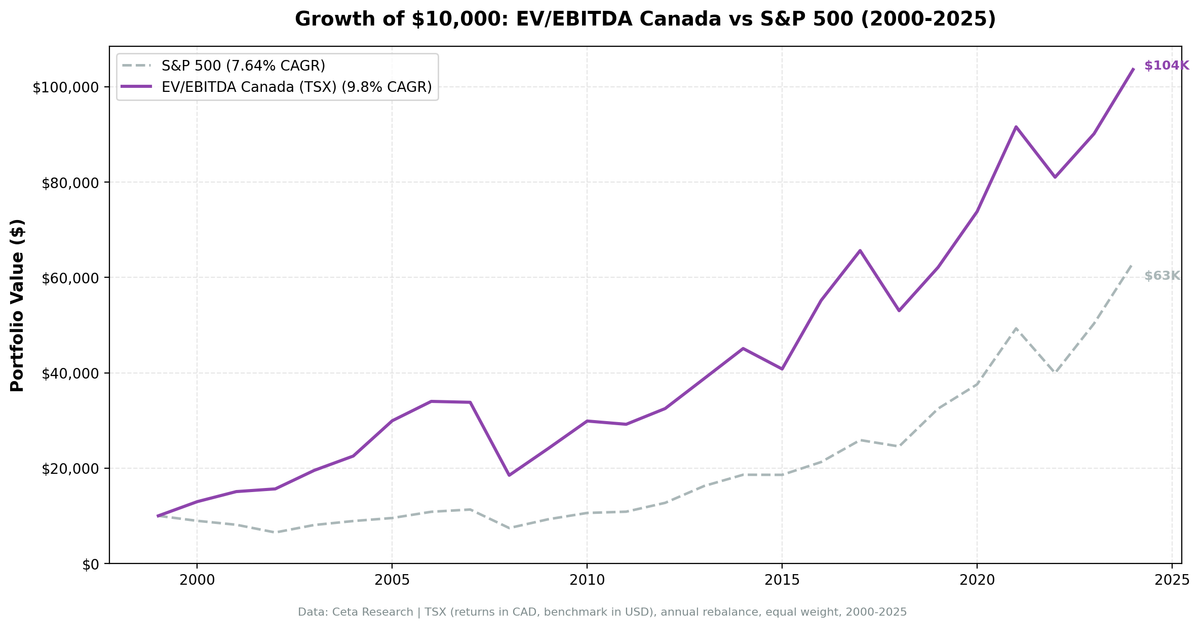
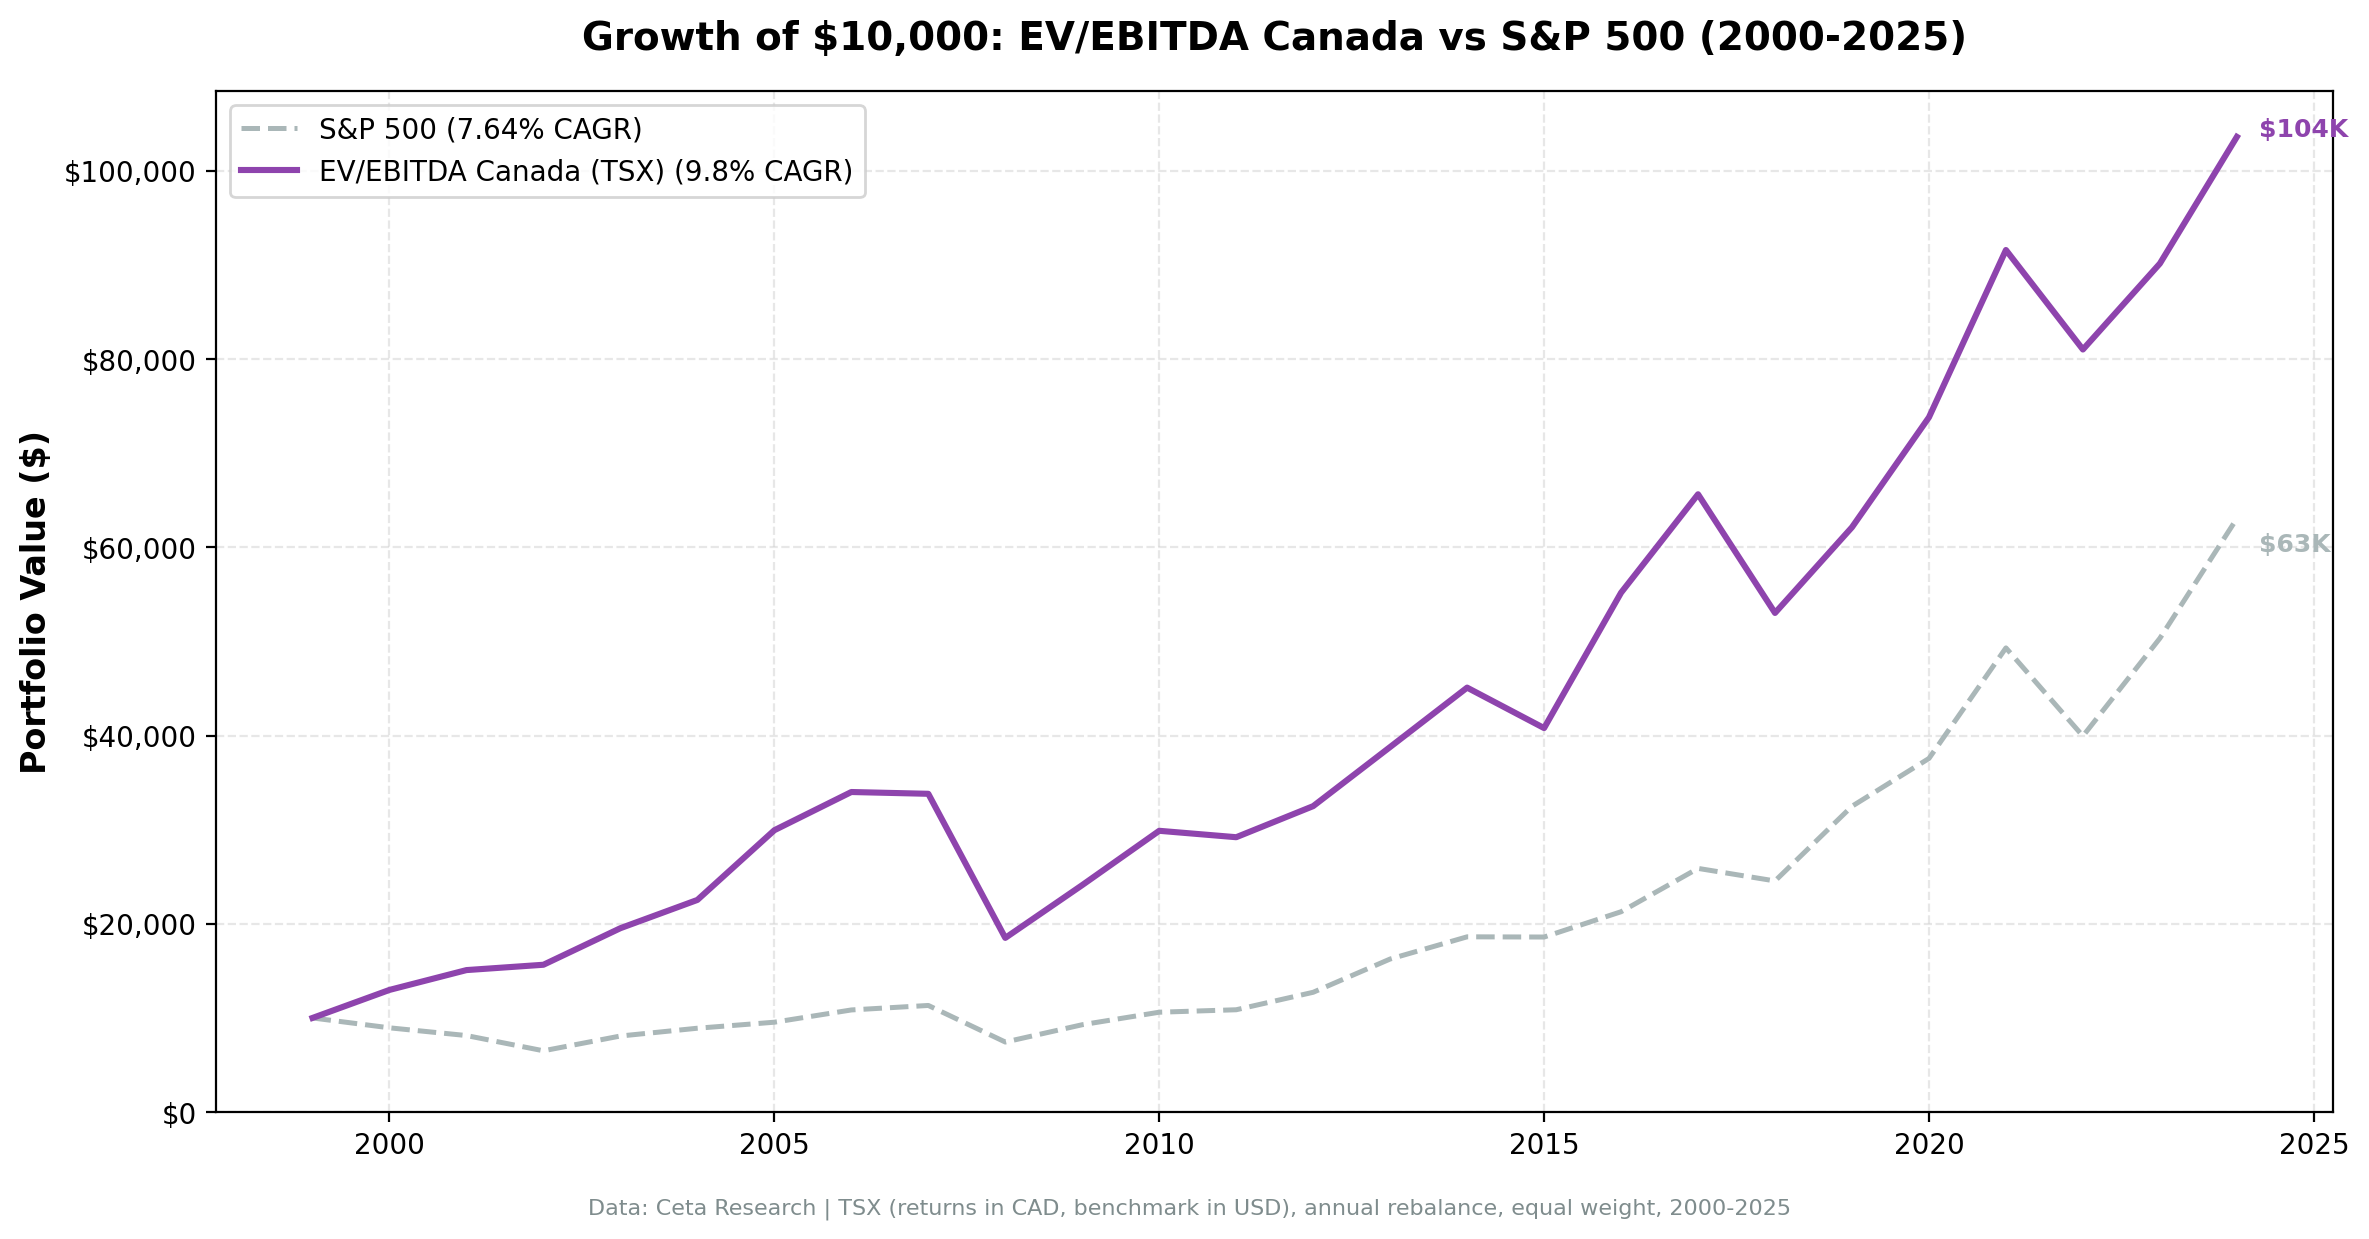
The TSX is structurally different from most equity indices. About 25% energy, 25% financials, 15% materials. These are capital-intensive businesses with real EBITDA, and EV/EBITDA is exactly the right metric to price them. We ran the same EV/EBITDA screen that we used on US, Indian, and European exchanges on Canadian stocks from 2000 to 2024. The strategy returned 9.84% CAGR versus the TSX Composite's 4.44%, outperforming in 76% of years.
Contents
Method
Signal: EV/EBITDA (trailing twelve months) below 10x, with ROE above 10% Universe: TSX stocks with market cap above CAD equivalent of $1B USD Period: January 2000 – December 2024 (25 years) Rebalancing: Annual, January Execution: Next-day close (MOC) to avoid look-ahead bias Costs: 0.1% per trade (one-way) Benchmark: S&P/TSX Composite Index (^GSPTSE, in CAD) Data: FMP financial data via Ceta Research warehouse
Returns and benchmark are both in CAD, making this a direct currency-neutral comparison. The strategy was fully invested in all 25 periods, always finding at least 10 qualifying stocks.
What We Found
The Canada strategy returned 9.84% CAGR over 25 years versus the TSX Composite's 4.44%, an excess return of 5.41 percentage points per year.
| Metric | Strategy | TSX Composite |
|---|---|---|
| CAGR | 9.84% | 4.44% |
| Excess Return | +5.41% | — |
| Sharpe Ratio | 0.405 | — |
| Max Drawdown | -45.59% | -33.70% |
| Sortino Ratio | 0.661 | — |
| Calmar Ratio | 0.216 | — |
| Alpha | 5.36% | — |
| Beta | 1.024 | — |
| Win Rate | 76% | — |
| Up Capture | 150.5% | — |
| Down Capture | 67.8% | — |
| Avg Stocks Held | 26.0 | — |
| Cash Periods | 0/25 | — |
The up-capture of 150.5% is the standout number. When the TSX Composite rises 10%, this strategy historically gained 15%. The 76% win rate means the screen outperformed in three out of every four years. Beta of 1.024 against the local index shows the strategy tracks Canadian equity risk closely, as you'd expect when screening TSX stocks against a TSX benchmark. The alpha of 5.36% is the genuine stock-selection edge.
Sharpe of 0.405 is among the best in the series.
Year-by-Year
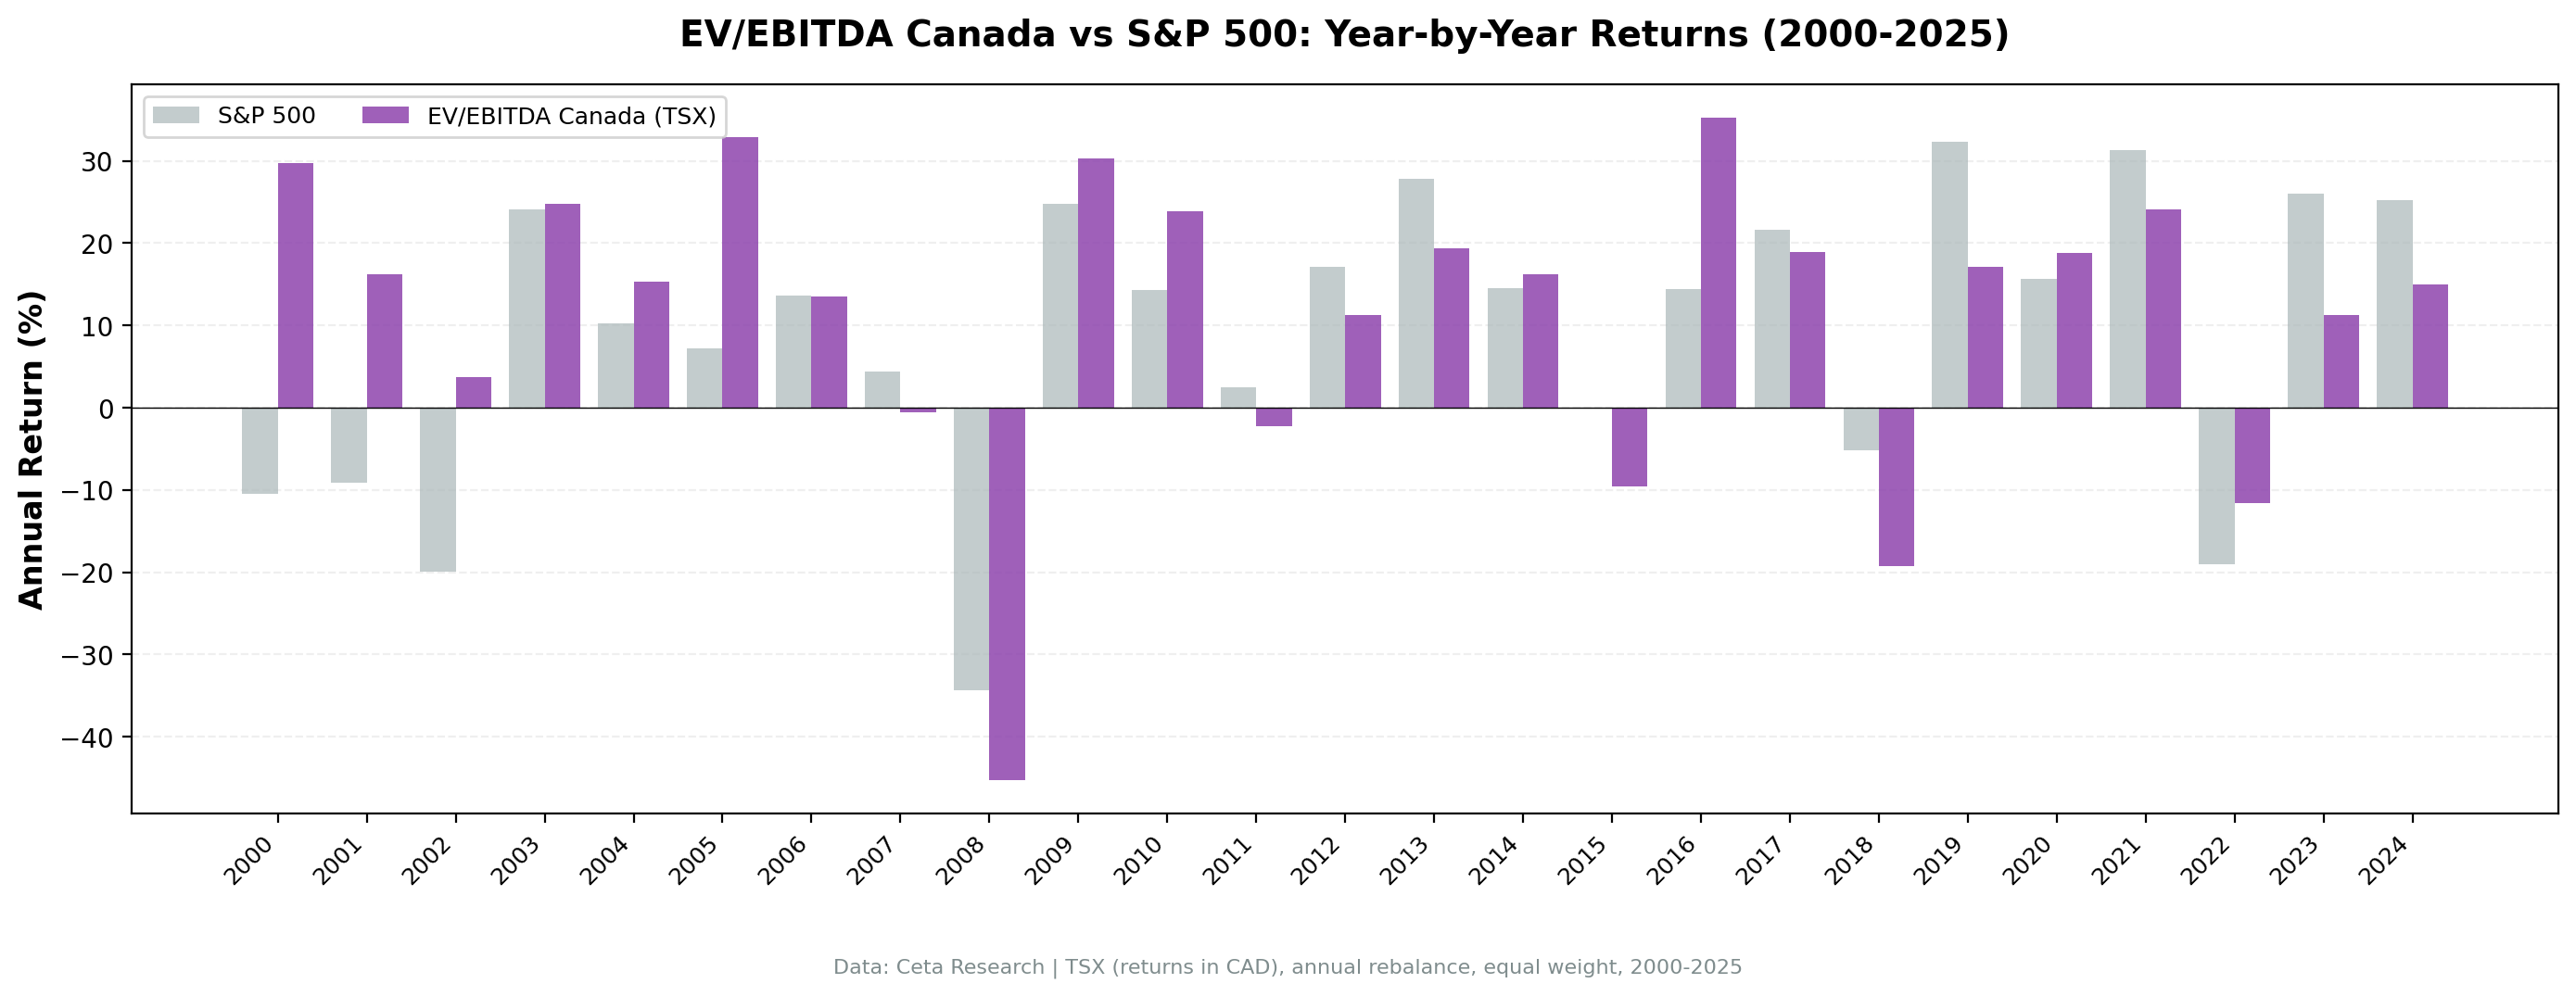
Canada's annual return profile has a distinctive pattern: strong outperformance during dot-com and energy boom years, a brutal 2008 when commodity prices collapsed, and consistent moderate returns thereafter.
| Year | Strategy (CAD) | TSX Composite |
|---|---|---|
| 2000 | +28.2% | +2.3% |
| 2001 | +15.5% | -11.2% |
| 2002 | +3.8% | -19.9% |
| 2005 | +32.9% | +7.2% |
| 2008 | -45.3% | -33.7% |
| 2009 | +30.3% | +24.7% |
| 2016 | +35.3% | +19.2% |
| 2018 | -19.2% | -5.2% |
| 2022 | -11.5% | -8.4% |
| 2023 | +11.3% | +26.0% |
| 2024 | +14.9% | +25.3% |
The 2000–2001 sequence is striking. During the dot-com bust, when the TSX Composite barely broke even (+2.3%) then fell 11.2%, the Canada EV/EBITDA screen returned +28.2% and +15.5%. Canadian energy and materials stocks weren't overvalued tech. They were cheap cyclicals generating real cash flows, and the screen caught them at exactly the right time.
2008 shows what happens when commodities crash: the strategy lost 45.3%, worse than the TSX Composite's 33.7%. When oil prices collapse and credit dries up, cheap energy and mining stocks fall harder than the broad Canadian market.
2016 was another strong year: +35.3% vs TSX Composite's 19.2%, driven by the recovery in oil prices and a reset in Canadian industrials valuations. The energy sector, which had been beaten down in 2014–2015, repriced sharply when commodity prices recovered.
2022 tells a mixed story: down 11.5% while the TSX Composite fell only 8.4%. Against SPY (-19.0%), Canada looked great. Against the local index, not so much. This is why benchmarking against the right index matters.
The 2023–2024 relative lag (11.3% and 14.9% vs TSX Composite's 26.0% and 25.3%) reflects the same mega-cap tech rally that lifted broad indices globally.
Why Canada Works for This Screen
The TSX's sector composition is the explanation. EV/EBITDA is a capital-structure-neutral metric, which makes it ideal for industries that carry debt. Energy companies finance reserves with debt. Mining companies finance mine construction with debt. Pipelines carry permanent leverage. P/E ratios become misleading for these businesses because interest expense varies so much between companies. EV/EBITDA strips that out.
When you screen for EV/EBITDA below 10x on the TSX, you're systematically finding cheap energy, materials, and industrials names. These industries have real, tangible EBITDA. The multiples are low because the market assigns a discount for cyclicality and commodity price risk.
The ROE filter above 10% is doing important work here. It eliminates the lowest-quality cyclicals: the leveraged exploration companies, the loss-making miners, the distressed producers. What's left is cheap AND profitable. That's a meaningfully different portfolio than just cheap.
The 150.5% up-capture ratio tells the story. When the broad TSX rises, the screen's cheap cyclicals rise faster because they have more operating leverage and more room for multiple expansion. The 67.8% down-capture means the strategy does give back some of those gains in downturns, but the asymmetry is still favorable.
The strategy never went to cash. Even in thin markets, the TSX's concentration in capital-intensive industries meant there were always 26 qualifying stocks (average) meeting the EV/EBITDA and ROE criteria.
Run It Yourself
Current Canada screen (live TTM data):
SELECT
  k.symbol,
  p.companyName,
  p.exchange,
  k.evToEBITDATTM,
  k.returnOnEquityTTM,
  k.marketCap
FROM key_metrics_ttm k
JOIN profile p ON k.symbol = p.symbol
WHERE p.exchange IN ('TSX')
  AND k.marketCap > 1000000000
  AND k.evToEBITDATTM > 0
  AND k.evToEBITDATTM < 10
  AND k.returnOnEquityTTM > 0.10
ORDER BY k.evToEBITDATTM ASC
LIMIT 25
Run this query on Ceta Research
Run the backtest locally:
cd backtests/ev-ebitda
python run.py --exchanges TSX --start 2000 --end 2024
Limitations
Benchmark is now local. Returns and benchmark are both in CAD. The comparison to the TSX Composite is currency-neutral, unlike the old SPY comparison.
Commodity concentration. The screen systematically selects energy, materials, and industrials. In a prolonged commodity bear market, this creates sustained underperformance. 2014–2016 showed this dynamic.
2008 drawdown. The 45.59% max drawdown was worse than the TSX Composite's 33.70%. Cheap energy and mining stocks fall harder than the broad Canadian market in commodity crashes.
MOC execution. The backtest uses next-day close prices for rebalancing trades. This avoids look-ahead bias but assumes close-price fills are achievable. For liquid TSX names, this is reasonable.
Survivorship and data quality. Some historical TSX names may have delisting events or data gaps in FMP's coverage. The $1B equivalent market cap floor reduces but doesn't eliminate this risk.
Data: Ceta Research (FMP financial data warehouse), 2000–2025. Full methodology: backtests/METHODOLOGY.md. Backtest code: backtests/ev-ebitda/.


