High Yield Blue Chips in Sweden: 9.6% CAGR Over 25 Years of Stockholm Exchange Data
The Dogs of the Dow adapted for Sweden. Take the 30 largest STO stocks, buy the 10 highest-yielding. 9.6% CAGR over 25 years, +1.9% excess over the S&P 500.

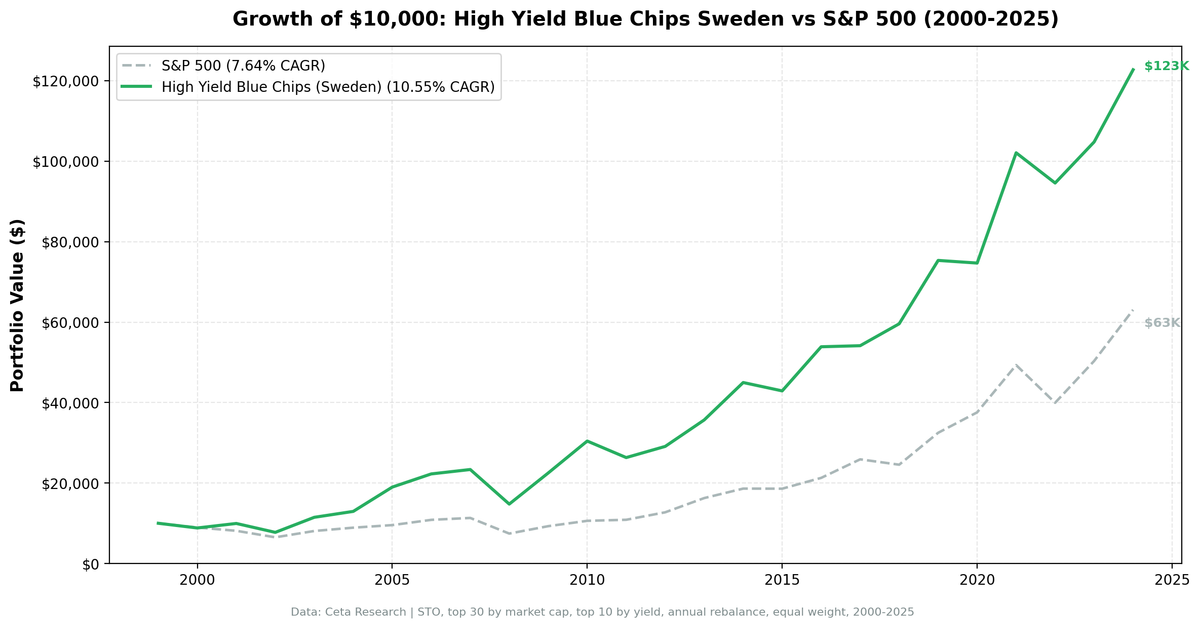
We adapted the Dogs of the Dow for Sweden's Stockholm Exchange. Take the 30 largest STO stocks by market cap (SEK 5B+), buy the 10 highest-yielding, hold for a year, repeat. Over 25 years (2000-2025), this returned 9.6% annually, turning $10,000 into $99,000. That's +1.9% excess over the S&P 500 with a Sharpe ratio of 0.332.
Contents
- Method
- Why Sweden?
- The Screen (SQL)
- What We Found
- Positive excess with comparable risk.
- Sweden's strength is recovery rallies.
- Full annual performance
- Limitations
- Takeaway
Method
Data source: Ceta Research (FMP financial data warehouse) Universe: Stockholm Exchange (STO), top 30 stocks by market cap Period: 2000-2025 (25 annual periods) Rebalancing: Annual (January), equal weight, top 10 by dividend yield Execution: Next-day close (market-on-close) Benchmark: S&P 500 Total Return (SPY, USD) Transaction costs: Size-tiered (0.1% for >$10B, 0.3% for $2-10B, 0.5% for <$2B) Cash rule: Hold cash if fewer than 5 stocks qualify (never triggered)
For the full strategy explanation and US results, see the main Dogs of the Dow post.
Why Sweden?
Sweden is a surprisingly good market for dividend strategies. The Stockholm Exchange hosts global blue chips like Ericsson, Volvo, Atlas Copco, and Investor AB. Swedish companies have a strong dividend culture, many paying out 40-60% of earnings consistently. The market is deep enough (30+ large-cap stocks) to support the strategy, and liquid enough that transaction costs don't eat the returns.
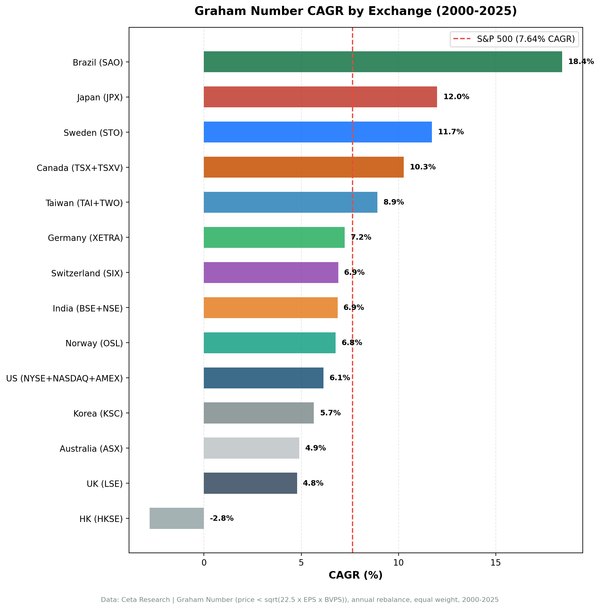
We tested 14 exchanges globally. Sweden produced positive excess returns (+1.9% over SPY) with a Sharpe ratio of 0.332.
The Screen (SQL)
WITH blue_chips AS (
    SELECT k.symbol, p.companyName, k.marketCap
    FROM key_metrics_ttm k
    JOIN profile p ON k.symbol = p.symbol
    WHERE p.exchange = 'STO'
        AND k.marketCap > 5e9
    ORDER BY k.marketCap DESC
    LIMIT 30
)
SELECT
    bc.symbol,
    bc.companyName,
    f.dividendYieldTTM * 100 as dividend_yield_pct,
    bc.marketCap / 1e9 as market_cap_billions,
    f.priceToEarningsRatioTTM as pe_ratio
FROM blue_chips bc
JOIN financial_ratios_ttm f ON bc.symbol = f.symbol
WHERE f.dividendYieldTTM > 0
ORDER BY f.dividendYieldTTM DESC
LIMIT 10
Run this screen on Ceta Research →
What We Found
Positive excess with comparable risk.
| Metric | STO Blue Chips | S&P 500 |
|---|---|---|
| CAGR | 9.6% | 7.6% |
| Total Return | 886% | 531% |
| Sharpe Ratio | 0.332 | 0.322 |
| Sortino Ratio | 0.648 | 0.556 |
| Max Drawdown | -38.4% | -34.9% |
| Volatility | 22.9% | 17.5% |
| Beta | 0.96 | 1.00 |
| Win Rate vs SPY | 52% | -- |
| Negative Years | 7 of 25 (28%) | 7 of 25 (28%) |
Swedish blue chips beat the S&P 500 in 13 of 25 years. The Sortino ratio of 0.648 (vs 0.556 for SPY) shows solid downside-adjusted returns.
Up capture is 116%, down capture 80%. When the market rises, Swedish blue chips outpace it. When it falls, they capture about 80% of the loss.
Sweden's strength is recovery rallies.
The standout year was 2009: +52.4% off the financial crisis bottom, and +41.3% in 2003. The strategy's edge comes from staying invested in quality names and riding recovery cycles.
| Year | STO Blue Chips | S&P 500 | Excess |
|---|---|---|---|
| 2001 | +11.4% | -9.2% | +20.6% |
| 2003 | +41.3% | +24.1% | +17.2% |
| 2005 | +46.6% | +7.2% | +39.5% |
| 2008 | -36.8% | -34.3% | -2.5% |
| 2009 | +52.4% | +24.7% | +27.6% |
| 2010 | +35.3% | +14.3% | +21.0% |
| 2022 | -7.4% | -19.0% | +11.6% |
The 2008 drawdown (-36.8%) was nearly identical to the S&P's (-34.9%). But the recovery was fast: +52.4% in 2009.
Full annual performance
| Year | STO Blue Chips | S&P 500 | Excess |
|---|---|---|---|
| 2000 | -29.2% | -10.5% | -18.7% |
| 2001 | +11.4% | -9.2% | +20.6% |
| 2002 | -21.8% | -19.9% | -1.9% |
| 2003 | +41.3% | +24.1% | +17.2% |
| 2004 | +20.0% | +10.2% | +9.8% |
| 2005 | +46.6% | +7.2% | +39.5% |
| 2006 | +17.3% | +13.6% | +3.6% |
| 2007 | +4.9% | +4.4% | +0.5% |
| 2008 | -36.8% | -34.3% | -2.5% |
| 2009 | +52.4% | +24.7% | +27.6% |
| 2010 | +35.3% | +14.3% | +21.0% |
| 2011 | -13.5% | +2.5% | -16.0% |
| 2012 | +10.5% | +17.1% | -6.6% |
| 2013 | +22.6% | +27.8% | -5.2% |
| 2014 | +26.1% | +14.5% | +11.6% |
| 2015 | -4.6% | -0.1% | -4.5% |
| 2016 | +25.6% | +14.5% | +11.1% |
| 2017 | +0.5% | +21.6% | -21.2% |
| 2018 | +9.7% | -5.1% | +14.9% |
| 2019 | +26.4% | +32.3% | -5.9% |
| 2020 | -0.9% | +15.6% | -16.5% |
| 2021 | +36.7% | +31.3% | +5.4% |
| 2022 | -7.4% | -19.0% | +11.6% |
| 2023 | +10.5% | +26.0% | -15.5% |
| 2024 | +17.2% | +25.3% | -8.1% |
Limitations
Currency risk. Returns are in SEK converted to USD for comparison. The Swedish Krona has been volatile, especially during 2020-2023.
Small blue-chip universe. Sweden has fewer mega-cap stocks than the US. The top 30 by market cap is a reasonable universe, but sector concentration (industrials, financials) is higher.
SPY benchmark. We benchmark against the S&P 500 for cross-market consistency. The OMX Stockholm 30 would be a more natural local benchmark. Results vs OMX30 would differ.
Moderate volatility. 22.9% annualized is higher than the US Dogs (11.7%) and the S&P 500 (17.5%). The Swedish market is more volatile than the US, though less so than emerging markets.
Takeaway
The high-yield blue chip strategy on Sweden's Stockholm Exchange delivered 9.6% CAGR (+1.9% over SPY) with a Sharpe ratio of 0.332. A 52% win rate makes this a modest but positive application of the Dogs concept for investors wanting exposure to European industrial blue chips with a dividend tilt.
For the US results, see the flagship Dogs of the Dow post. For how this strategy performed across all 14 markets, see the global comparison.
Data: Ceta Research (FMP financial data warehouse), 2000-2025. Full methodology: METHODOLOGY.md