Dividend Growth on Swiss Stocks: Low Volatility, Positive Alpha (SIX Backtest)
We ran a dividend growth screen on Swiss stocks (SIX). 3.55% CAGR vs 1.74% for the SMI, with the lowest volatility (11.63%) of any exchange tested. +1.81% annual alpha over the local benchmark.

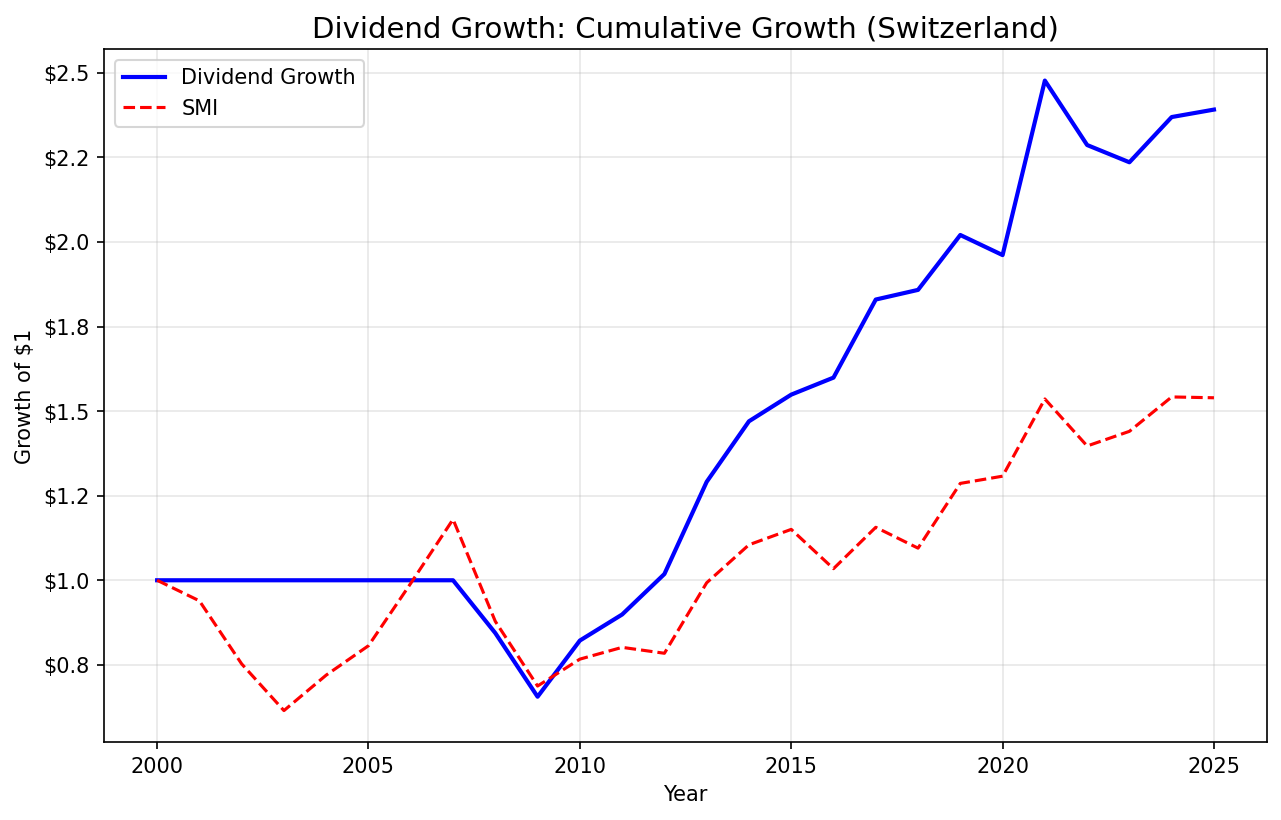
Switzerland is home to some of Europe's most reliable dividend payers. Nestle, Novartis, Roche, ABB. These companies have built multi-decade payout traditions backed by strong free cash flow and conservative capital allocation. We screened SIX-listed stocks for 5+ consecutive years of rising dividends, then held the top 30 by streak length. The result: 3.55% CAGR vs 1.74% for the SMI. Total return of 139%. The strategy beats its local benchmark by +1.81% annually. And the volatility profile makes the case even stronger. At 11.63%, this is the lowest-volatility result of any exchange we tested. Beta of 0.52 means the portfolio moved at roughly half the pace of the SMI. You're buying stability and modest local outperformance, though the universe is thin: it averages just over 10 holdings.
Contents
- Method
- Signal
- Results
- The Cash Period Story
- Annual Returns (Invested Years)
- When It Works
- When It Struggles
- Limitations
- Run This Screen (Switzerland)
- Takeaway
- Part of a Series
- References
Data: FMP financial data warehouse, 2000–2025. Updated June 2026.
Method
Data source: Ceta Research (FMP financial data) Universe: SIX Swiss Exchange stocks with market cap > CHF 500M Period: 2000-2025 (25 years, invested from 2007) Rebalancing: Annual (July)
Signal
| Filter | Threshold |
|---|---|
| Consecutive dividend increases | >= 5 years |
| Payout ratio | 0% to 80% |
| Free cash flow | > 0 |
| Market cap | > CHF 500M |
Portfolio: Top 30 by streak length, equal weight. Cash if fewer than 10 qualify.
For full methodology, see our US analysis.
Results
| Metric | Strategy | SMI |
|---|---|---|
| CAGR | 3.55% | 1.74% |
| Total Return | 139% | 54% |
| Max Drawdown | -34.43% | -41.74% |
| Sharpe Ratio | 0.262 | 0.085 |
| Sortino Ratio | 0.517 | 0.131 |
| Calmar Ratio | 0.103 | -- |
| Win Rate (vs SMI) | 64% | -- |
| Up Capture | 69.74% | -- |
| Down Capture | 22.43% | -- |
| Beta | 0.52 | -- |
| Alpha | 2.40% | -- |
| Volatility | 11.63% | -- |
| Cash Periods | 7/25 (28%) | -- |
| Avg Stocks | 10.2 | -- |
The Sortino of 0.517 is roughly four times the SMI's 0.131, showing far better risk-adjusted downside performance. Up capture of 69.74% vs down capture of 22.43% is the standout number: the portfolio captures most of the upside while blocking nearly 80% of the downside. With a beta of 0.52 and 2.40% annual alpha, you're holding a half-equity position that quietly compounds ahead of its benchmark.
The Cash Period Story
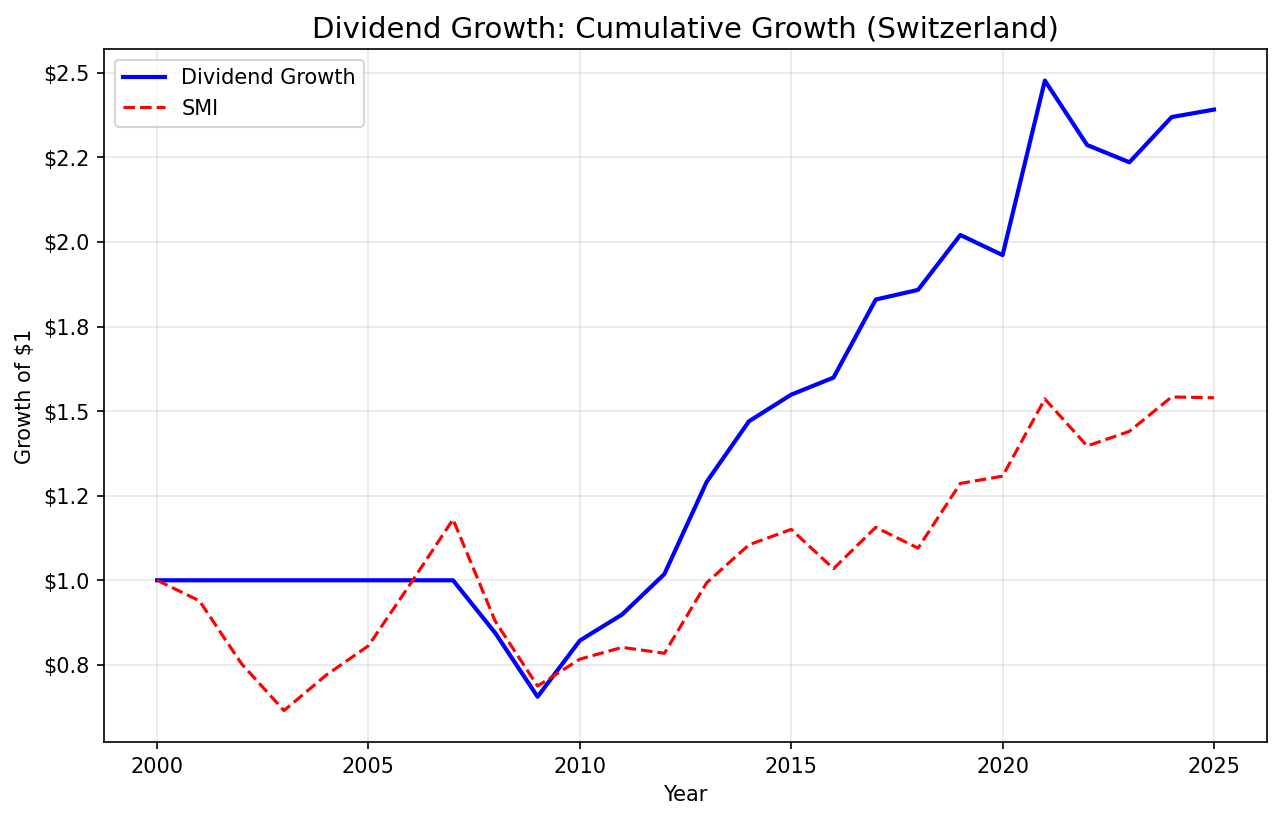
Seven cash periods (2000-2006) all fall at the start of the backtest window. FMP coverage for Swiss dividend data doesn't begin reliably until 2007. This is a data availability issue, not a signal failure. From 2007 onward, the strategy averaged 10.2 qualifying stocks per period. That's far below the 30-stock target and barely above the 10-stock cash threshold, reflecting the smaller Swiss market. Fewer companies meet the five-year streak requirement, so the portfolio runs highly concentrated.
Annual Returns (Invested Years)
| Year | Strategy | SMI | Excess |
|---|---|---|---|
| 2007 | -15.6% | -25.6% | +9.9% |
| 2008 | -22.3% | -21.8% | -0.5% |
| 2009 | +25.3% | +11.6% | +13.8% |
| 2010 | +9.4% | +4.5% | +4.8% |
| 2011 | +13.3% | -2.2% | +15.5% |
| 2012 | +26.8% | +26.6% | +0.2% |
| 2013 | +13.9% | +11.3% | +2.6% |
| 2014 | +5.4% | +4.1% | +1.2% |
| 2015 | +3.3% | -10.1% | +13.3% |
| 2016 | +14.4% | +11.8% | +2.6% |
| 2017 | +1.6% | -5.3% | +6.9% |
| 2018 | +8.7% | +17.5% | -8.8% |
| 2019 | -2.9% | +1.7% | -4.6% |
| 2020 | +26.3% | +17.5% | +8.9% |
| 2021 | -7.7% | -9.1% | +1.4% |
| 2022 | -2.2% | +3.1% | -5.3% |
| 2023 | +6.0% | +7.1% | -1.1% |
| 2024 | +0.9% | -0.2% | +1.1% |
When It Works
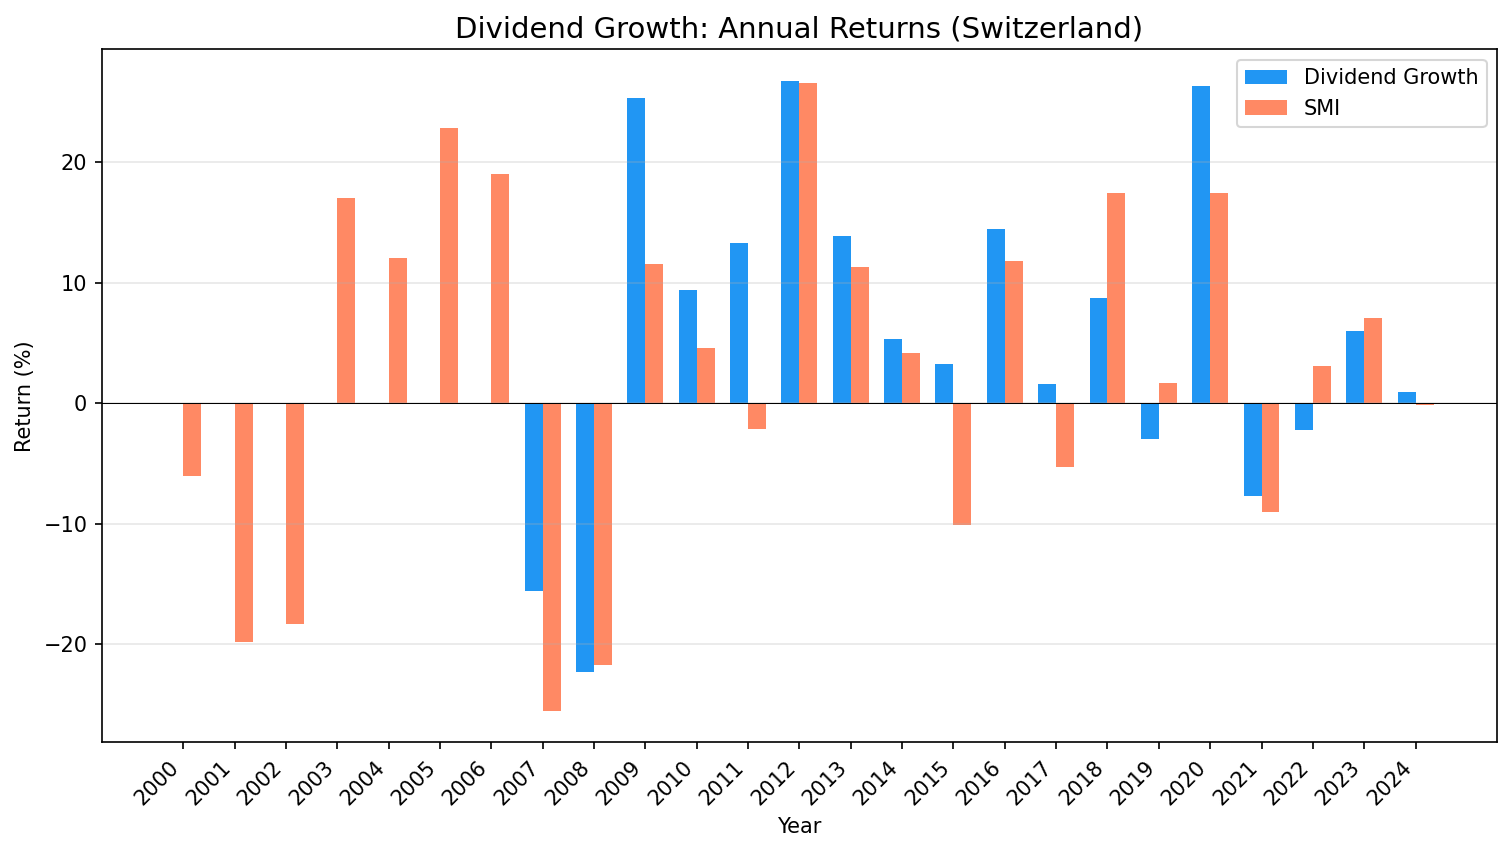
2011: +13.3% vs the SMI's -2.2%. A +15.5% excess during the European debt crisis, the best single year. Swiss quality companies with long payout traditions attracted capital as investors fled risk.
2015: +3.3% vs the SMI's -10.1%. That's +13.3% excess. The SNB abandoned the EUR/CHF floor in January 2015, crashing the SMI. Dividend growers, backed by global revenue streams, held up while the index cratered.
2009 (post-crisis recovery): +25.3% vs the SMI's +11.6%. The strategy captured +13.8% excess as companies that maintained dividends through 2008 were rewarded.
2007-2008 (financial crisis): The portfolio lost -15.6% in 2007 against the SMI's -25.6%, a clear +9.9% edge, then roughly matched the index in 2008 (-22.3% vs -21.8%). Through the worst two-year stretch it held up better overall. Nestle, Novartis, and Roche kept paying because their revenue streams don't disappear in a recession.
2020: +26.3% vs the SMI's +17.5%. A +8.9% excess as Swiss dividend growers led the post-pandemic recovery.
Pattern: the strategy works best during stress, recovery, and periods of franc strength. When investors seek safety, Swiss dividend growers attract capital. The 64% win rate means the strategy beats the SMI in most years.
When It Struggles
2018: +8.7% vs the SMI's +17.5%. A -8.8% gap. The SMI rallied hard on pharma and luxury goods momentum, and dividend growers couldn't keep pace with the broader index surge.
2022: -2.2% vs the SMI's +3.1%. A -5.3% gap. The strategy lost money while the benchmark gained, the widest miss of any recent year.
2019: -2.9% vs the SMI's +1.7%. A -4.6% gap. A flat-to-down year for the portfolio while the index drifted higher.
2023: +6.0% vs the SMI's +7.1%. A -1.1% gap. Essentially flat excess, showing that in calm, broad-based rallies the dividend screen can lag slightly.
Pattern: the strategy lags when the SMI rallies broadly, driven by index heavyweights outside the dividend-growth universe. But the losses are moderate. The worst single-year shortfall is -8.8%, nothing like the double-digit gaps you see with US-benchmarked strategies. With a 64% win rate, you beat the SMI in most years.
Limitations
Small universe: Only 10.2 stocks on average, far below the 30-stock target and barely above the 10-stock cash threshold. The Swiss market has a limited pool of companies that meet the five-year streak requirement. This level of concentration adds meaningful stock-specific risk: a single holding can swing the annual return.
Data starts 2007: FMP Swiss data is sparse before 2007. The 7 cash periods reflect data gaps, not strategy failure. Effective results cover 2007-2024 (18 invested years).
Modest absolute returns: 3.55% CAGR beats the SMI's 1.74%, but it's still a low absolute number. If you're targeting 8%+ annual returns, Swiss dividend growers won't get you there regardless of benchmark.
Concentrated index: The SMI has only 20 constituents. The dividend growth screen overlaps heavily with SMI components, so alpha partly reflects stock selection within a narrow universe rather than a fundamentally different exposure.
Run This Screen (Switzerland)
WITH annual_div AS (
    SELECT symbol,
        EXTRACT(YEAR FROM CAST(date AS DATE)) AS yr,
        SUM(adjDividend) AS total_div
    FROM dividend_calendar
    WHERE adjDividend > 0
        AND symbol IN (SELECT DISTINCT symbol FROM profile WHERE exchange IN ('SIX'))
    GROUP BY symbol, EXTRACT(YEAR FROM CAST(date AS DATE))
),
growth AS (
    SELECT symbol, yr, total_div,
        LAG(total_div) OVER (PARTITION BY symbol ORDER BY yr) AS prev_div
    FROM annual_div
),
last_break AS (
    SELECT symbol, MAX(yr) AS break_yr
    FROM growth
    WHERE prev_div IS NOT NULL AND total_div <= prev_div
    GROUP BY symbol
),
streak AS (
    SELECT g.symbol, COUNT(*) AS consecutive_years,
        MIN(g.yr) AS streak_from, MAX(g.yr) AS streak_to
    FROM growth g
    LEFT JOIN last_break lb ON g.symbol = lb.symbol
    WHERE g.prev_div IS NOT NULL
      AND g.total_div > g.prev_div
      AND (lb.break_yr IS NULL OR g.yr > lb.break_yr)
    GROUP BY g.symbol
    HAVING COUNT(*) >= 5
)
SELECT s.symbol, s.consecutive_years, s.streak_from, s.streak_to,
    ROUND(r.dividendPayoutRatioTTM * 100, 1) AS payout_pct,
    ROUND(k.marketCap / 1e9, 2) AS mktcap_bn,
    ROUND(c.freeCashFlow / 1e6, 0) AS fcf_mm
FROM streak s
JOIN financial_ratios_ttm r ON s.symbol = r.symbol
JOIN key_metrics_ttm k ON s.symbol = k.symbol
JOIN cash_flow_statement_ttm c ON s.symbol = c.symbol
WHERE r.dividendPayoutRatioTTM BETWEEN 0 AND 0.80
  AND c.freeCashFlow > 0
  AND k.marketCap > 500000000
QUALIFY ROW_NUMBER() OVER (PARTITION BY s.symbol ORDER BY s.consecutive_years DESC) = 1
ORDER BY s.consecutive_years DESC, k.marketCap DESC
LIMIT 30
Data: Ceta Research (FMP financial data warehouse). Universe: SIX, market cap > CHF 500M. Backtest: 2000-2025, annual July rebalance. Past performance does not guarantee future results. This is educational content, not investment advice.
Takeaway
Switzerland's dividend growth screen delivers what you'd want from a local equity strategy: positive alpha with low volatility. The 3.55% CAGR beats the SMI's 1.74% by +1.81% annually. Volatility of 11.63% is the lowest of any exchange we tested. The Sortino of 0.517 is roughly four times the SMI's 0.131.
The asymmetric capture ratio is the headline number. Up capture of 69.74% vs down capture of 22.43% means the portfolio participates in rallies but blocks most of the downside. A 64% win rate confirms this isn't a fluke: you beat the SMI in most years. Alpha of 2.40% with a beta of 0.52 is a clean risk-adjusted story.
The limitation is absolute return and a thin universe. 3.55% CAGR won't satisfy investors targeting high growth, and an average of just over 10 holdings means concentration risk is real. But for Swiss equity exposure, the dividend growth screen does what it should: identifies quality companies, reduces drawdowns, and compounds ahead of the index over time.
Part of a Series
This is the Switzerland analysis. See also: - Dividend Growth on US Stocks - full methodology - Dividend Growth on Indian Stocks (NSE) - Dividend Growth on Canadian Stocks (TSX) - Dividend Growth on UK Stocks (LSE) - Dividend Growth on German Stocks (XETRA) - Dividend Growth Across Global Exchanges - full comparison
References
- Lintner, J. (1956). "Distribution of Incomes of Corporations Among Dividends, Retained Earnings, and Taxes." American Economic Review, 46(2), 97-113.
- Arnott, R. & Asness, C. (2003). "Surprise! Higher Dividends = Higher Earnings Growth." Financial Analysts Journal, 59(1), 70-87.