
DCF Threshold in India: 11.12% CAGR Over 20 Invested Years of BSE/NSE Data
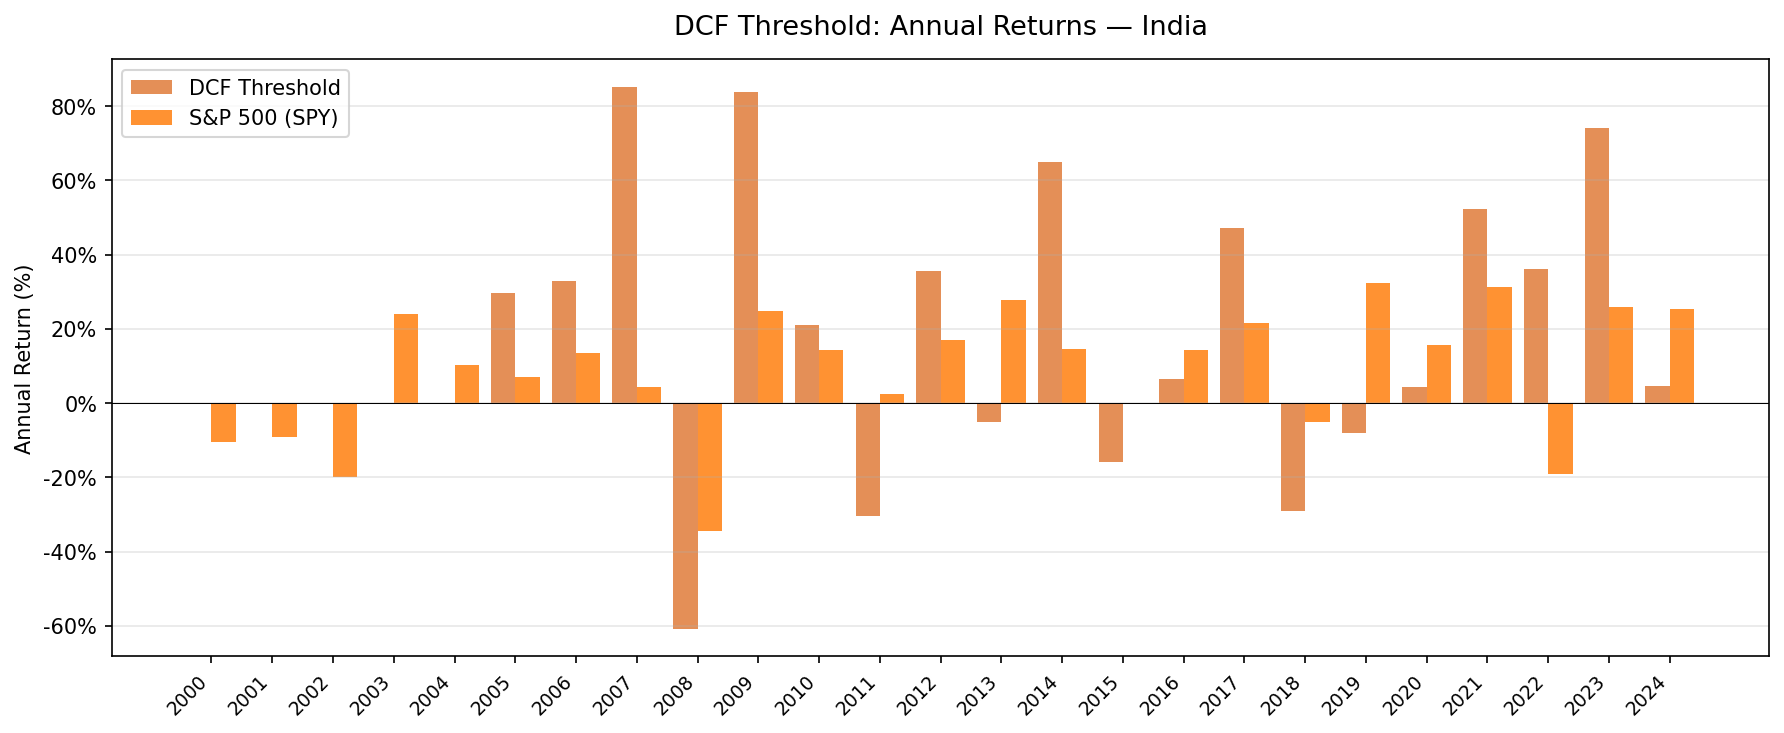
We ran a Gordon Growth DCF screen with quality filters on 25 years of Indian BSE/NSE data. No qualifying stocks 2000–2004. From 2005, the strategy returned 11.12% CAGR vs 7.64% SPY, with explosive swing years — 2007 (+85%), 2009 (+84%), 2022 (+36%) — alongside a -61% max drawdown.

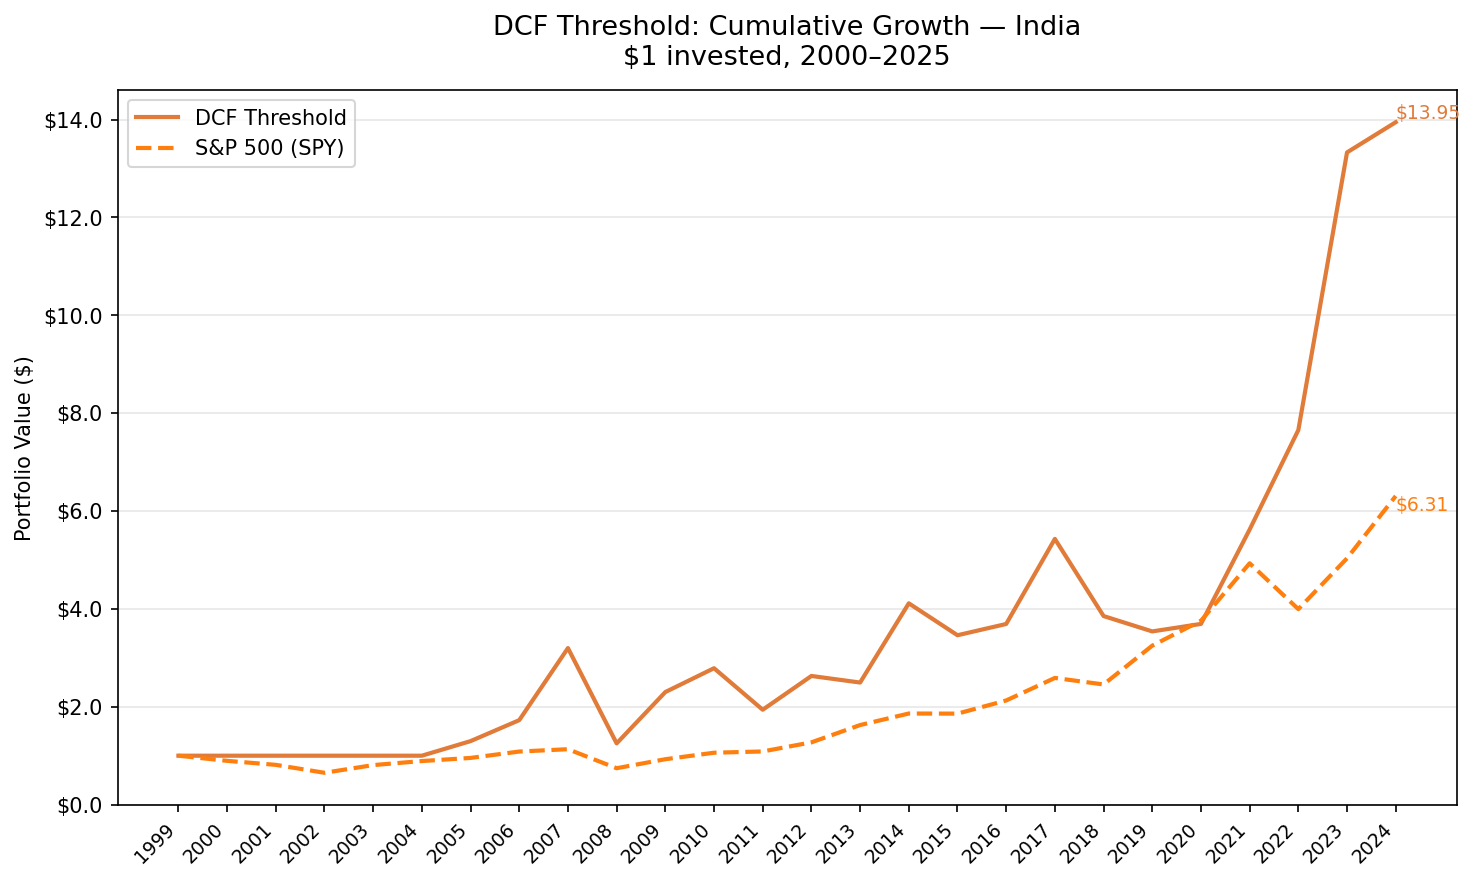
We ran the DCF Threshold screen on 25 years of Indian stocks from BSE and NSE. The signal: buy the 30 most undervalued companies by Gordon Growth DCF discount, filtered for ROE above 8%, D/E below 1.5, and positive operating cash flow. The strategy found no qualifying stocks in the first five years (2000–2004). Once it started firing in 2005, it returned 11.12% annually over the full period — 3.47% above the S&P 500 benchmark — with a pattern of explosive swings that reflect India's market structure.
Contents
- Method
- Why 2000–2004 Was Cash
- What We Found
- High returns. High swings.
- The swing years
- Year-by-year returns
- Where the alpha concentrates
- India: Asymmetric But Investable
- Backtest Methodology
- Limitations
- Conclusion
Data: FMP financial data warehouse, 2000–2025. Updated March 2026.
Method
Data source: Ceta Research (FMP financial data warehouse) Universe: BSE + NSE (Bombay Stock Exchange + National Stock Exchange), market cap > INR 10B (~USD 120M) Period: 2000–2025 (25 annual periods; 20 invested years — 2005–2024) Rebalancing: Annual (January), equal weight, top 30 by highest FCF yield Benchmark: S&P 500 Total Return (SPY) Cash rule: Hold cash if fewer than 10 stocks qualify
The signal is identical to the US version: FCF/MarketCap ≥ 8.78%, which is the price-independent equivalent of a 20% discount to Gordon Growth intrinsic value. The 45-day filing lag and 18-month staleness limit apply identically.
Why 2000–2004 Was Cash
The strategy held cash for the first five years. This is a real data gap in the FMP dataset, not a filter issue. India's financial reporting infrastructure in the early 2000s had thin coverage on the FMP platform — fewer companies with complete FCF, ROE, and D/E records in a single dataset lookup.
It's worth being explicit: the results here reflect 20 invested years, not 25. The CAGR of 11.12% is computed across all 25 periods (including the five cash years), so it's a fair long-run number. But investors evaluating this for capital allocation should treat it as a 20-year sample.
What We Found

High returns. High swings.
| Metric | DCF Threshold (India) | S&P 500 |
|---|---|---|
| CAGR | 11.12% | 7.64% |
| Total Return | 1,294% | 531% |
| Sharpe Ratio | 0.125 | 0.065 |
| Max Drawdown | -60.87% | -34.90% |
| Up Capture | 152.56% | 100% |
| Down Capture | 70.90% | 100% |
| Win Rate vs SPY | 56% | — |
| Cash Periods | 5 of 25 | — |
| Avg Stocks | 24.8 (when invested) | — |
The 11.12% CAGR is strong. The -60.87% max drawdown is large. The Sharpe ratio of 0.125 is low — the excess return came with commensurate volatility. India's market amplifies both the gains and losses.
The 152% up capture means that when SPY rises 10%, this portfolio rises about 15%. The 70.9% down capture means when SPY falls 10%, this portfolio falls about 7%. The asymmetry exists, but the absolute magnitudes are still large in both directions.
The swing years
Indian markets don't grind. They move in large discrete swings:
| Year | DCF Threshold | S&P 500 | Excess |
|---|---|---|---|
| 2005 | +29.8% | +7.2% | +22.6% |
| 2006 | +33.0% | +13.7% | +19.4% |
| 2007 | +85.3% | +4.4% | +80.9% |
| 2008 | -60.9% | -34.3% | -26.6% |
| 2009 | +83.8% | +24.7% | +59.1% |
| 2014 | +64.9% | +14.5% | +50.4% |
| 2018 | -29.0% | -5.2% | -23.9% |
| 2021 | +52.2% | +31.3% | +21.0% |
| 2022 | +36.2% | -19.0% | +55.1% |
| 2023 | +74.1% | +26.0% | +48.1% |
The +85.3% in 2007 was followed by -60.9% in 2008. Then +83.8% in 2009. These aren't unusual for Indian small-to-mid-cap value stocks — they reflect the underlying liquidity dynamics of Indian equity markets during boom/bust cycles.
2022 is notable: the strategy returned +36.2% when SPY fell -19%, a 55.1-point spread. Indian companies generating FCF with quality fundamentals held up through the global rate-rise cycle. This mirrors the US result in 2022, but with larger magnitude.
Year-by-year returns
| Year | DCF Threshold | S&P 500 | Excess |
|---|---|---|---|
| 2000 | 0.0% (cash) | -10.5% | — |
| 2001 | 0.0% (cash) | -9.2% | — |
| 2002 | 0.0% (cash) | -19.9% | — |
| 2003 | 0.0% (cash) | +24.1% | — |
| 2004 | 0.0% (cash) | +10.2% | — |
| 2005 | +29.8% | +7.2% | +22.6% |
| 2006 | +33.0% | +13.7% | +19.4% |
| 2007 | +85.3% | +4.4% | +80.9% |
| 2008 | -60.9% | -34.3% | -26.6% |
| 2009 | +83.8% | +24.7% | +59.1% |
| 2010 | +21.2% | +14.3% | +6.9% |
| 2011 | -30.4% | +2.5% | -32.9% |
| 2012 | +35.6% | +17.1% | +18.5% |
| 2013 | -5.1% | +27.8% | -32.9% |
| 2014 | +64.9% | +14.5% | +50.4% |
| 2015 | -15.9% | -0.1% | -15.7% |
| 2016 | +6.7% | +14.4% | -7.8% |
| 2017 | +47.1% | +21.6% | +25.5% |
| 2018 | -29.0% | -5.2% | -23.9% |
| 2019 | -8.2% | +32.3% | -40.5% |
| 2020 | +4.3% | +15.6% | -11.3% |
| 2021 | +52.2% | +31.3% | +21.0% |
| 2022 | +36.2% | -19.0% | +55.1% |
| 2023 | +74.1% | +26.0% | +48.1% |
| 2024 | +4.6% | +25.3% | -20.7% |
Where the alpha concentrates
The best years by excess return are 2007 (+80.9%), 2009 (+59.1%), 2022 (+55.1%), and 2023 (+48.1%). These are not random. 2007 was the global liquidity peak before the financial crisis — Indian value stocks ran hard. 2009 was the post-crisis recovery. 2022–2023 was the rate-rise period when FCF-generating, low-debt companies globally outperformed.
The loss years are also patterned. 2013 and 2019 underperformed by 32.9% and 40.5% respectively — both years when global growth rallied and Indian cyclicals lagged.
India: Asymmetric But Investable
The pattern here is different from US or UK value investing. India's DCF screen selects companies that are already somewhat mature cash generators, but they operate in a market that moves in large amplitudes. The quality filters (ROE > 8%, D/E < 1.5, OCF > 0) prevent the worst distressed plays, but they can't eliminate the broad market volatility that affects all Indian equities.
The economic story makes sense. India's corporate quality universe — profitable companies with positive FCF and manageable debt — has grown substantially since 2005. The strategy captures that long-run development premium alongside the DCF signal. Companies with genuine cash flows compound in both directions: up faster in bull markets, down further in bear markets, but net ahead over a long period.
The 56% win rate and 11.12% CAGR over 25 years (20 invested) make this a plausible candidate for long-duration portfolio allocation, with the explicit understanding that the path will include -60% drawdowns.
Backtest Methodology
| Parameter | Choice |
|---|---|
| Universe | BSE + NSE, Market Cap > INR 10B |
| Signal | FCF/MCap ≥ 8.78%, ROE > 8%, D/E < 1.5, OCF > 0 |
| Portfolio | Top 30 by FCF yield, equal weight |
| Rebalancing | Annual (January) |
| Cash rule | Hold cash if < 10 qualify |
| Benchmark | S&P 500 Total Return (SPY) |
| Period | 2000–2025 (25 years; 20 invested years from 2005) |
| Data | Point-in-time (45-day lag on FY financial statements) |
| Transaction costs | Size-tiered (0.1%–0.5% one-way) |
Limitations
Max drawdown of -60.87%. This is a large drawdown. An investor who entered in January 2007 experienced a near-61% loss by the end of 2008. Recovery to new highs took several years. This is not a drawdown profile suited to investors without a multi-year time horizon and strong risk tolerance.
20 effective years, not 25. The five cash years from 2000–2004 reduce the sample size. The CAGR figure includes those years but the signal's actual track record begins in 2005.
High volatility. Annualized volatility of 36.79% vs 17.51% for SPY. The strategy takes on more than twice the absolute volatility of the benchmark to generate 3.47% annual excess return.
Concentration risk. India's listed universe qualified an average of 24.8 stocks when invested. With top-30 selection and several cash periods, some years had fewer than 20 actual holdings. This creates idiosyncratic concentration risk that's not fully captured by the CAGR.
Conclusion
India's DCF Threshold result is exactly what you'd expect from a quality FCF screen applied to a high-growth emerging market: strong returns (+11.12% CAGR, +3.47% excess), large swings (max drawdown -60.87%), and meaningful cash periods in early data. The signal works, but with Indian amplitude.
The 2022–2023 performance (+36.2%, +74.1%) is the most recent signal that the quality FCF criterion continues to identify companies that hold up through rate cycles. Combined with the early record (2005–2010), that's a plausible mechanical story for why this approach generates alpha in India.
For investors with a 10+ year horizon and tolerance for large drawdowns, Indian FCF-quality screening has a real track record. The path is not smooth.
Data: Ceta Research (FMP financial data warehouse). Backtest: 2000–2025. Past performance does not guarantee future results. Full methodology at github.com/ceta-research/backtests.


