
DCF Threshold Across 13 Markets: A Consistent Geographic Pattern
We ran the same DCF Threshold screen on 13 global stock exchanges. Seven markets beat SPY. Six underperformed. The dividing line follows a consistent geographic pattern — Western markets work, most Asian markets don't — and the structural reasons are documented.


We ran the same DCF Threshold screen on 13 global stock exchanges. Same signal, same quality filters, same parameters on every market. The pattern that emerged is clear and consistent: the strategy adds value in Western markets and underperforms across most of Asia. The dividing line isn't random.
Contents
- Method
- What We Found
- The results by market
- Positive excess return markets
- Negative excess return markets
- The Geographic Pattern
- English-speaking markets outperform
- Excluded Markets
- What This Tells You About the Signal
- Backtest Methodology
- Limitations
- Conclusion
Data: FMP financial data warehouse, 2000–2025. Updated March 2026.
Method
Data source: Ceta Research (FMP financial data warehouse) Signal: FCF/MarketCap ≥ 8.78% (= 20% Gordon Growth DCF discount) + ROE > 8% + D/E < 1.5 + OCF > 0 Portfolio: Top 30 by FCF yield, equal weight, annual January rebalance Benchmark: S&P 500 Total Return (SPY) Period: 2000–2025 (25 years per exchange) Exchanges tested: 15 total; 13 eligible (SES and JNB excluded — insufficient qualifying stocks)
The Gordon Growth Model:
DCF_value = FCF × (1+g)/(r-g) = FCF × 13.67
20% discount → FCF/MCap ≥ 8.78%
Exchange market cap thresholds:
| Market | Min Market Cap |
|---|---|
| US (NYSE/NASDAQ/AMEX) | USD 1B |
| India (BSE/NSE) | INR 10B (~USD 120M) |
| Canada (TSX) | CAD 500M |
| UK (LSE) | GBP 500M |
| Hong Kong (HKSE) | HKD 2B |
| Germany (XETRA) | EUR 500M |
| Sweden (STO) | SEK 2B |
| Japan (JPX) | JPY 20B |
| Switzerland (SIX) | CHF 500M |
| Thailand (SET) | THB 10B |
| Taiwan (TAI/TWO) | TWD 5B |
| China (SHZ/SHH) | CNY 5B |
| Korea (KSC) | KRW 200B |
What We Found
The results by market
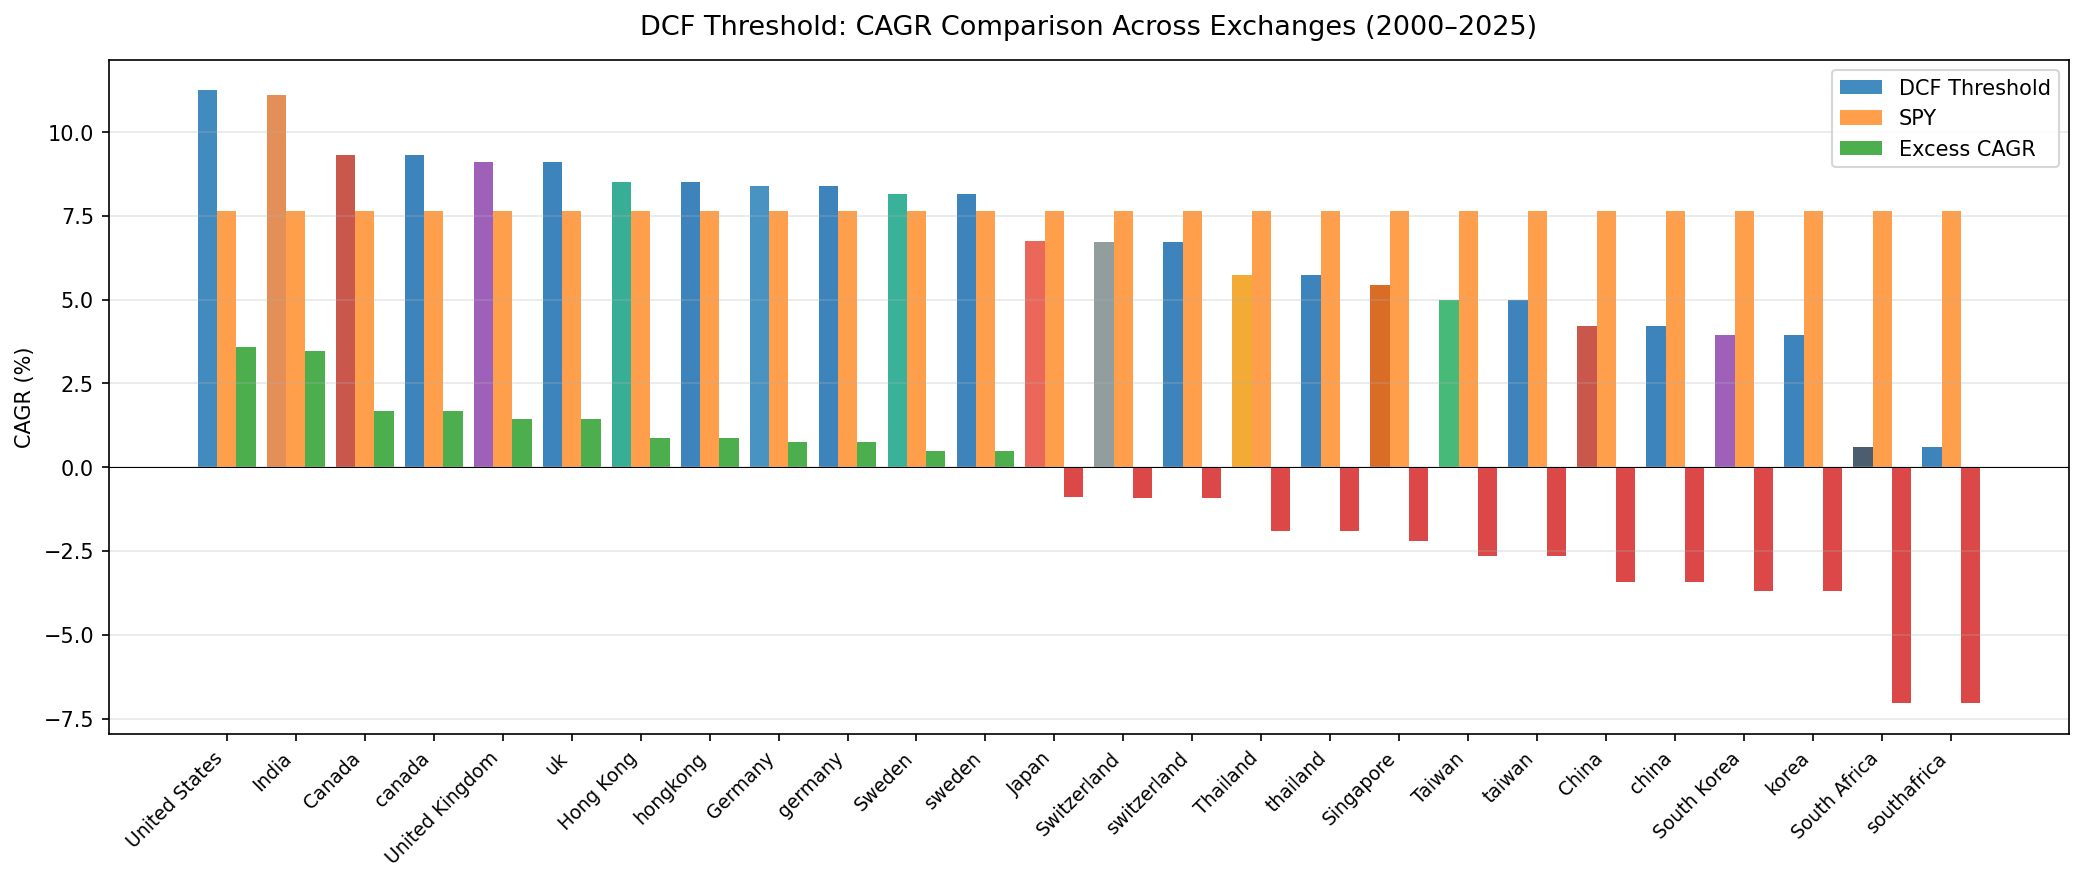
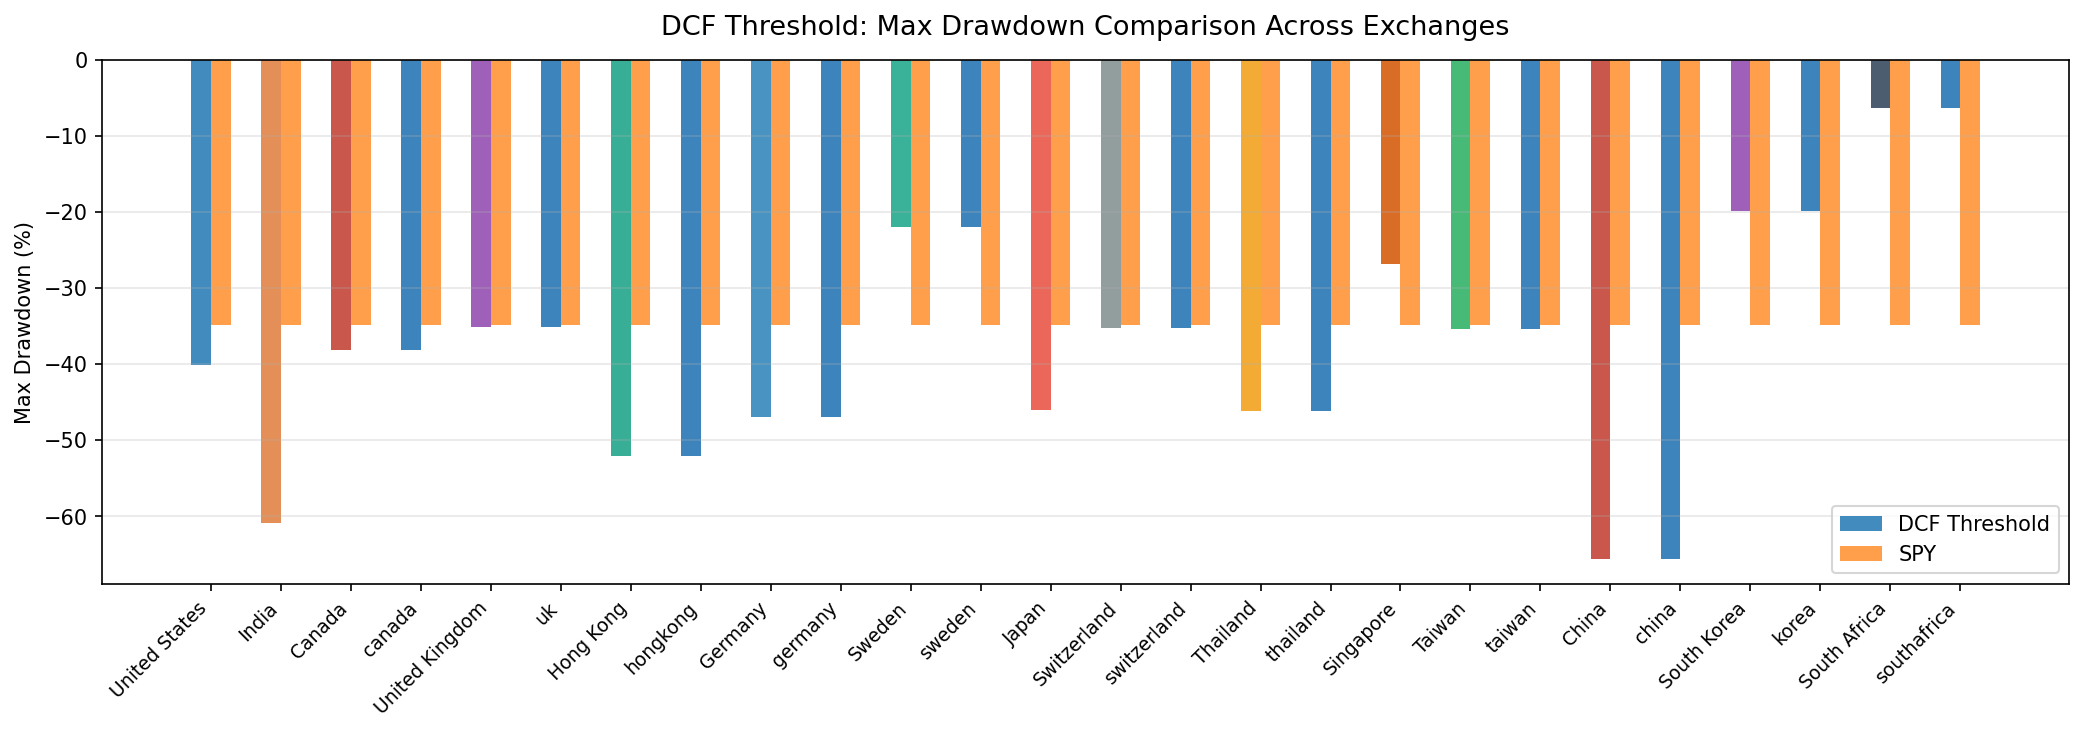
| Exchange | CAGR | Excess | Sharpe | Max Drawdown | Cash% | Down Capture |
|---|---|---|---|---|---|---|
| US (NYSE/NASDAQ/AMEX) | 11.25% | +3.60% | 0.528 | -40.13% | 0% | 38% |
| India (BSE/NSE) | 11.12% | +3.47% | 0.125 | -60.87% | 20% | 71% |
| Canada (TSX) | 9.32% | +1.68% | 0.356 | -38.21% | 0% | -4% |
| UK (LSE) | 9.10% | +1.45% | 0.261 | -35.13% | 16% | 66% |
| Hong Kong (HKSE) | 8.50% | +0.86% | 0.209 | -52.04% | 4% | 79% |
| Germany (XETRA) | 8.39% | +0.74% | 0.304 | -46.96% | 0% | 48% |
| Sweden (STO) | 8.14% | +0.49% | 0.378 | -22.04% | 48% | -3% |
| Japan (JPX) | 6.76% | -0.88% | 0.307 | -46.06% | 20% | 68% |
| Switzerland (SIX) | 6.73% | -0.91% | 0.336 | -35.23% | 12% | 67% |
| Thailand (SET) | 5.74% | -1.91% | 0.151 | -46.22% | 20% | 92% |
| Taiwan (TAI/TWO) | 5.00% | -2.65% | 0.213 | -35.40% | 32% | 66% |
| China (SHZ/SHH) | 4.20% | -3.44% | 0.043 | -65.61% | 8% | 100% |
| Korea (KSC) | 3.95% | -3.70% | 0.070 | -19.84% | 36% | 17% |
Seven markets beat SPY on CAGR. Six markets underperform. The dividing line is remarkably clean.
Positive excess return markets
US (+3.60%): The flagship result. 38% down capture, 68% win rate, Sharpe 0.528. The quality filters work best in a market where ROE and FCF norms are well-established and consistently reported. Zero cash periods — the signal fires every year.
India (+3.47%): Strong CAGR (11.12%) with high volatility. Cash from 2000–2004 reflects sparse early FMP data. From 2005 onward, the signal reliably finds qualifying stocks and generates excess return, with large annual swings.
Canada (+1.68%): The most structurally unusual result. Negative down capture (-4.31%) driven by resource sector concentration. Canadian DCF stocks are heavily energy, materials, and financials — sectors that diverged sharply from US tech in the early 2000s.
UK (+1.45%): Steady excess return from 21 invested years (2004 onward). 56% win rate. Strong recovery years (2006, 2009, 2012, 2021) and an outlier negative year in 2014 from the energy sector collapse.
Hong Kong (+0.86%): The exception among Asian markets. HK-listed companies (many mainland-linked but LSE-traded equivalent) show modest excess return with reasonable stock counts. The 79% down capture is high, limiting the risk-adjusted case.
Germany (+0.74%): Zero cash periods, 0.304 Sharpe. German industrials and engineering companies at FCF yield thresholds generate modest but consistent alpha. The quality filters work well in a market with strong corporate governance norms.
Sweden (+0.49%): The outlier case. 48% cash periods and -3% down capture suggest the Swedish market's DCF-qualifying universe is very thin. The excess return is marginal. Sweden is in the comparison table but not recommended for dedicated allocation.
Negative excess return markets
Japan (-0.88%): Japan is the most studied case of value trap persistence. The same quality screens that work in the US fail in Japan because Japanese corporate culture tolerates structural undervaluation. Cross-shareholding, management entrenchment, and low return-on-equity norms mean that FCF-discounted stocks stay discounted. The 20% cash periods compound the problem.
Switzerland (-0.91%): Swiss companies at high FCF yields tend to be in sectors with limited re-rating potential (industrials, chemicals, commodities). The quality filters find stocks but the DCF discount doesn't close.
Thailand (-1.91%): Southeast Asian markets have different FCF reporting conventions. High down capture (92%) means the strategy participates almost fully in market downturns while trailing in recoveries.
Taiwan (-2.65%): Heavy tech sector (semiconductors, electronics) with compressed margins. ROE thresholds favor the larger profitable names, but FCF yield requirements conflict with high-growth tech multiples. The 32% cash periods signal the mismatch.
China (-3.44%): Sharpe of 0.043 is near zero. Chinese A-share companies with high FCF yield and quality metrics tend to operate in old-economy sectors (industrials, utilities) that the market consistently prices below Western equivalents. The government policy overhang on valuations may explain persistent discount that never closes.
Korea (-3.70%): The worst excess return. 36% cash and a Sharpe of 0.070. Korean conglomerates (chaebols) have structural cross-shareholding discounts that show up as persistent FCF yield without mean reversion. The quality filters find names that look like value but are actually structurally discounted.
The Geographic Pattern
The markets that work: US, India, Canada, UK, Hong Kong, Germany, Sweden. All seven are either English-speaking, Western European, or have significant institutional investor presence with active corporate governance expectations.
The markets that don't: Japan, Switzerland, Thailand, Taiwan, China, Korea.
The hypothesis is not cultural — it's structural. Quality filters define "good businesses" using metrics that assume certain corporate behavior: that a company with ROE > 8%, low debt, and positive FCF is priced temporarily below intrinsic value and will revert. That assumption holds in markets where:
- Shareholders can pressure management to return FCF through dividends or buybacks
- Takeover activity creates a floor on persistent discounts
- Accounting norms produce FCF that reflects real economic cash generation
In markets where these conditions don't hold — persistent cross-shareholding, government influence on pricing, or structural FCF suppression — the discount doesn't close. A stock trading at an 8.78%+ FCF yield in Korea or Japan often stays there because nothing forces the gap to close.
The fact that Hong Kong shows modest positive excess return (+0.86%) while China shows -3.44% is consistent with this framework. HK-listed stocks operate under a more transparent disclosure regime than mainland A-share counterparts, and HK markets have more active foreign institutional participation.
English-speaking markets outperform
The four English-speaking markets in the test (US, India, Canada, UK) are the top four by excess return:
| Market | Excess CAGR |
|---|---|
| US | +3.60% |
| India | +3.47% |
| Canada | +1.68% |
| UK | +1.45% |
India is included in this group for a specific reason: FMP data coverage, disclosure norms, and investor expectations for listed Indian companies follow patterns more similar to Commonwealth markets than to other Asian markets in the dataset.
Excluded Markets
Singapore (SES): 60% cash periods, 7.8 average qualifying stocks when invested. The quality filters eliminate most of Singapore's listed universe. Not enough data to publish.
South Africa (JNB): 84% cash periods, only 4 invested years in 25. ROE > 8% and D/E < 1.5 eliminate nearly all JSE-listed companies. Not statistically meaningful.
Both exclusions are filter-driven, not data quality driven. The FMP data is adequate. The universe is genuinely thin for this signal.
What This Tells You About the Signal
The geographic pattern validates the signal design. If the excess return were random noise, you'd expect roughly half markets to outperform and half to underperform in no particular pattern. Instead, there's a consistent structural cluster: Western markets outperform, East Asian markets underperform.
This is consistent with the broader academic literature on value investing across markets. Fama and French (1998) documented value premium internationally, but with significant regional variation. The specific mechanism — FCF yield with quality filters as a proxy for undervalued businesses — appears to require the market conditions listed above.
Backtest Methodology
Full methodology: github.com/ceta-research/backtests/blob/main/METHODOLOGY.md
| Parameter | Choice |
|---|---|
| Signal | FCF/MCap ≥ 8.78%, ROE > 8%, D/E < 1.5, OCF > 0 |
| Portfolio | Top 30 by FCF yield, equal weight |
| Rebalancing | Annual (January) |
| Cash rule | Hold cash if < 10 qualify |
| Benchmark | S&P 500 Total Return (SPY) |
| Period | 2000–2025 (25 years per exchange) |
| Data | Point-in-time (45-day lag on FY financial statements) |
| Transaction costs | Size-tiered (0.1%–0.5% one-way) |
Limitations
Single signal across diverse markets. The same FCF yield threshold and quality parameters were applied everywhere. Some markets may require calibrated thresholds. A 8.78% FCF yield requirement in Korea may be structurally too strict given different cost-of-capital norms.
SPY as universal benchmark. Comparing Japanese or Korean stocks to the S&P 500 introduces currency and structural bias. Excess return partly reflects cross-market dynamics rather than pure stock selection.
Survivorship bias. Exchange membership is based on current profiles. Companies that delisted during the backtest period are not in the sample, which likely flatters results modestly in all markets.
Data gaps. UK and India had early cash periods (2000–2003 and 2000–2004 respectively) due to sparse FMP coverage. Results for those markets reflect 21 and 20 invested years, not 25.
Conclusion
The DCF Threshold signal produces consistent excess returns in markets where value discount closure is mechanically plausible. The seven outperforming markets share structural characteristics — shareholder activism, transparent disclosure, takeover floors — that the six underperforming markets generally lack.
For global allocation, the evidence points clearly toward US, Canada, and UK as markets where the signal has the strongest empirical support. India shows the highest raw excess return but requires tolerance for -60% drawdowns and high volatility. Germany and Hong Kong show modest positive results with reasonable stock counts.
The Asian underperformers (Japan, Korea, China, Taiwan, Thailand) are not excluded because of data quality. They're excluded from content because the excess return is consistently negative and the structural reasons are well-documented.
Data: Ceta Research (FMP financial data warehouse). Backtest: 2000–2025 across 13 exchanges. Past performance does not guarantee future results. Full methodology at github.com/ceta-research/backtests.


