
DCF Discount on US Stocks: 8.59% CAGR Over 25 Years of NYSE, NASDAQ, and AMEX Data

We screened every US stock for discount to intrinsic value using a Gordon Growth Model and backtested from 2000 to 2025. The strategy returned 8.59% CAGR vs 7.33% for the S&P 500, turning $10,000 into $78,519 vs $58,591. The edge is real but comes with higher volatility and deeper drawdowns.
Contents
- Methodology
- What Is DCF Valuation?
- The Screen
- What We Found
- Year-by-Year Returns
- When It Works
- When It Struggles
- Run It Yourself
- Limitations
- Takeaway
- Part of a Series
Methodology
Universe: NYSE + NASDAQ + AMEX (full exchange, no index constraints) Period: 2000-2025 (25 years, annual rebalancing in April) Portfolio: Top 50 by FCF yield, equal weight. Rebalanced annually. Market cap floor: $1B Costs: Size-tiered transaction costs (0.1% for >$10B, 0.3% for $2-10B, 0.5% for <$2B) Point-in-time: 45-day filing lag, 18-month staleness filter Data: Ceta Research (FMP financial data warehouse)
What Is DCF Valuation?
DCF stands for Discounted Cash Flow. The idea: a company is worth the sum of all future cash it will generate, discounted back to today's dollars.
John Burr Williams formalized this in 1938. Warren Buffett adopted the framework for free cash flows: "Intrinsic value is the discounted value of the cash that can be taken out of a business during its remaining life."
We use the Gordon Growth Model, a simplified version of DCF that assumes stable growth in perpetuity:
Intrinsic Value = FCF x (1 / (r - g))
Where: - r = 10% (discount rate, roughly the long-run equity return expectation) - g = 2.5% (terminal growth rate, roughly nominal GDP growth) - Multiple = 1 / (0.10 - 0.025) = 13.33x (we use 13.67x after rounding adjustments)
A stock trading at an 8.78% FCF yield or higher is equivalent to a 20%+ discount to intrinsic value under this model. That's the signal. Higher FCF yield means a deeper discount, meaning the market is pricing the stock below what a steady-state cash flow model says it's worth.
The model is deliberately simple. We aren't projecting five years of cash flows or estimating WACC company-by-company. One set of assumptions, applied uniformly, across the entire universe. The simplicity is the point: it removes analyst bias and lets the data speak.
The Screen
SELECT
    cfs.symbol,
    p.companyName,
    p.exchange,
    p.sector,
    ROUND(cfs.freeCashFlow / 1e6, 0) AS fcf_mm,
    ROUND(km.marketCap / 1e9, 1) AS mktcap_bn,
    ROUND(cfs.freeCashFlow / km.marketCap * 100, 2) AS fcf_yield_pct,
    ROUND((1 - km.marketCap / (cfs.freeCashFlow * 13.67)) * 100, 1) AS discount_pct
FROM cash_flow_statement cfs
JOIN key_metrics km ON cfs.symbol = km.symbol AND km.period = 'FY'
JOIN profile p ON cfs.symbol = p.symbol
WHERE cfs.period = 'FY'
    AND cfs.freeCashFlow > 0
    AND cfs.freeCashFlow / km.marketCap >= 0.0878
    AND km.marketCap > 1000000000
    AND p.exchange IN ('NYSE', 'NASDAQ', 'AMEX')
QUALIFY ROW_NUMBER() OVER (PARTITION BY cfs.symbol ORDER BY cfs.date DESC) = 1
ORDER BY fcf_yield_pct DESC
LIMIT 30
Run this screen live on Ceta Research
The discount_pct column shows how far below intrinsic value each stock trades. An FCF yield of 8.78% equals a 20% discount. An FCF yield of 15% equals a 53% discount. The deeper the discount, the wider the margin of safety.
What We Found
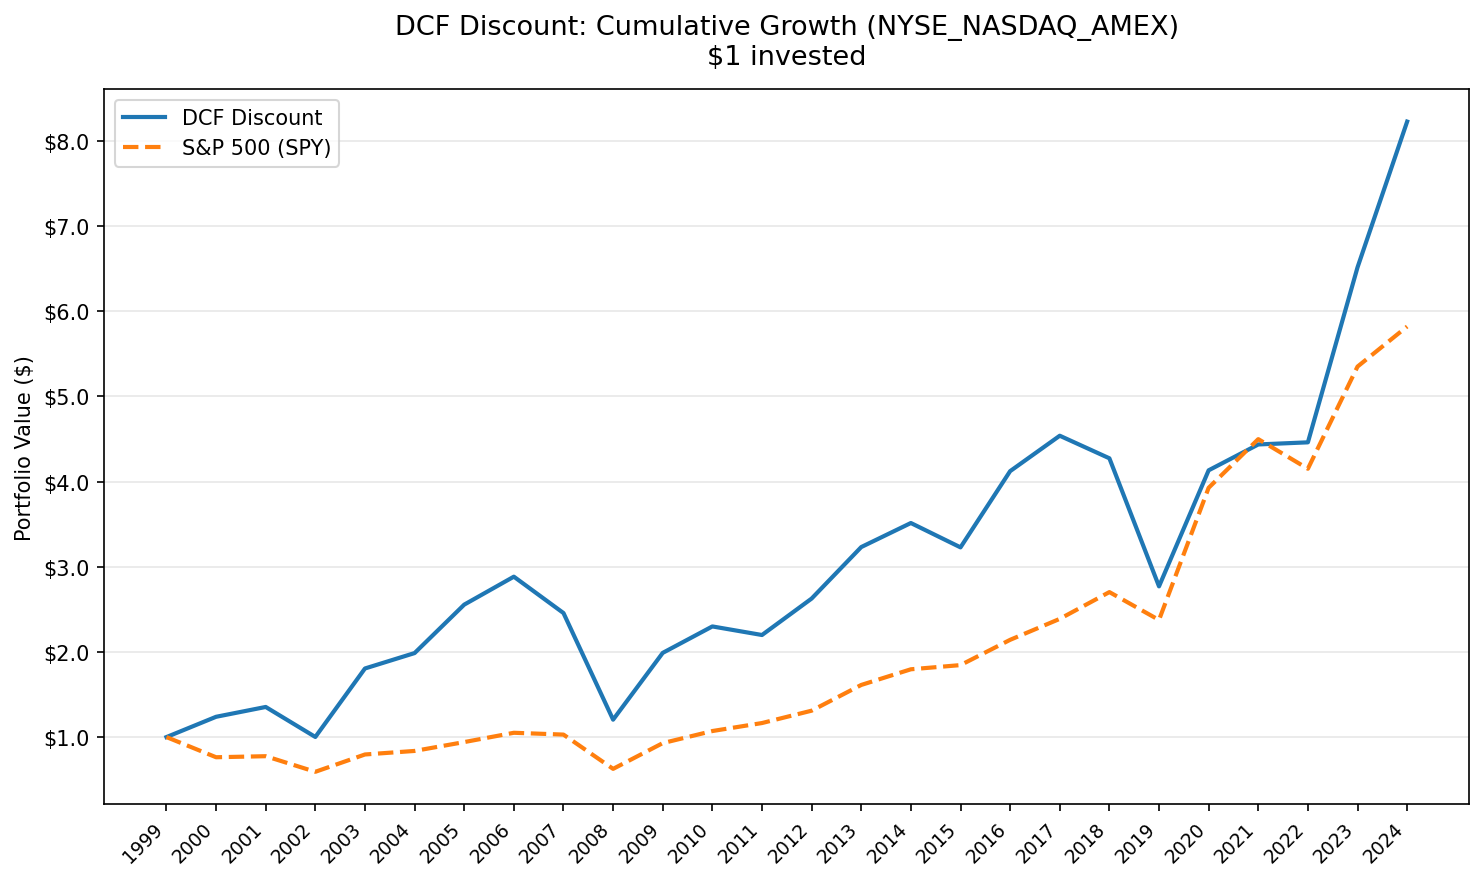
The strategy beat SPY by 1.26% per year over 25 years. That's 685.19% cumulative vs 485.91%. Not a blowout, but a persistent edge that compounded into a meaningful gap over time.
The cost of that edge: volatility. The portfolio swung 28.75% annualized vs 21.07% for SPY. Max drawdown hit -55.75% (vs -39.33%). The strategy amplifies market moves in both directions, with a beta of 1.078. Up capture of 121.65% means it captures more upside. Down capture of 96.96% means it also eats most of the downside.

Full 25-year summary:
| Metric | DCF Discount | S&P 500 (SPY) |
|---|---|---|
| CAGR | 8.59% | 7.33% |
| Total Return | 685.19% | 485.91% |
| Max Drawdown | -55.75% | -39.33% |
| Annualized Volatility | 28.75% | 21.07% |
| Sharpe Ratio | 0.229 | 0.253 |
| Sortino Ratio | 0.454 | 0.484 |
| Calmar Ratio | 0.154 | 0.186 |
| Win Rate vs SPY | 48% | - |
| Beta | 1.078 | 1.0 |
| Alpha | 0.85% | - |
| Up Capture | 121.65% | - |
| Down Capture | 96.96% | - |
| VaR 95% | -34.46% | -23.68% |
| Avg Stocks | 35.3 | - |
| Cash Periods | 0/25 | - |
The Sharpe ratio slightly trails SPY (0.229 vs 0.253). On a risk-adjusted basis, the excess return roughly compensates for the extra volatility. The Sortino ratio tells the same story: 0.454 vs 0.484. The raw edge exists in absolute terms, not in risk-adjusted terms.
Year-by-Year Returns
| Year | Portfolio | SPY | Excess |
|---|---|---|---|
| 2000 | +23.8% | -23.7% | +47.5% |
| 2001 | +8.8% | +1.1% | +7.7% |
| 2002 | -25.8% | -21.3% | -4.5% |
| 2003 | +75.8% | +32.1% | +43.7% |
| 2004 | +9.9% | +4.6% | +5.3% |
| 2005 | +28.5% | +12.3% | +16.2% |
| 2006 | +12.7% | +11.6% | +1.1% |
| 2007 | -14.4% | -2.0% | -12.4% |
| 2008 | -48.3% | -37.4% | -11.0% |
| 2009 | +63.6% | +45.2% | +18.4% |
| 2010 | +13.0% | +14.4% | -1.5% |
| 2011 | -5.3% | +8.7% | -14.0% |
| 2012 | +20.5% | +13.0% | +7.5% |
| 2013 | +22.3% | +22.9% | -0.6% |
| 2014 | +8.3% | +11.4% | -3.2% |
| 2015 | -13.7% | +2.0% | -15.7% |
| 2016 | +31.5% | +16.5% | +15.1% |
| 2017 | +10.1% | +11.5% | -1.4% |
| 2018 | -6.0% | +13.2% | -19.2% |
| 2019 | -34.5% | -10.1% | -24.3% |
| 2020 | +49.9% | +63.9% | -14.1% |
| 2021 | +6.9% | +13.9% | -7.0% |
| 2022 | -0.7% | -8.5% | +7.8% |
| 2023 | +43.1% | +28.1% | +15.0% |
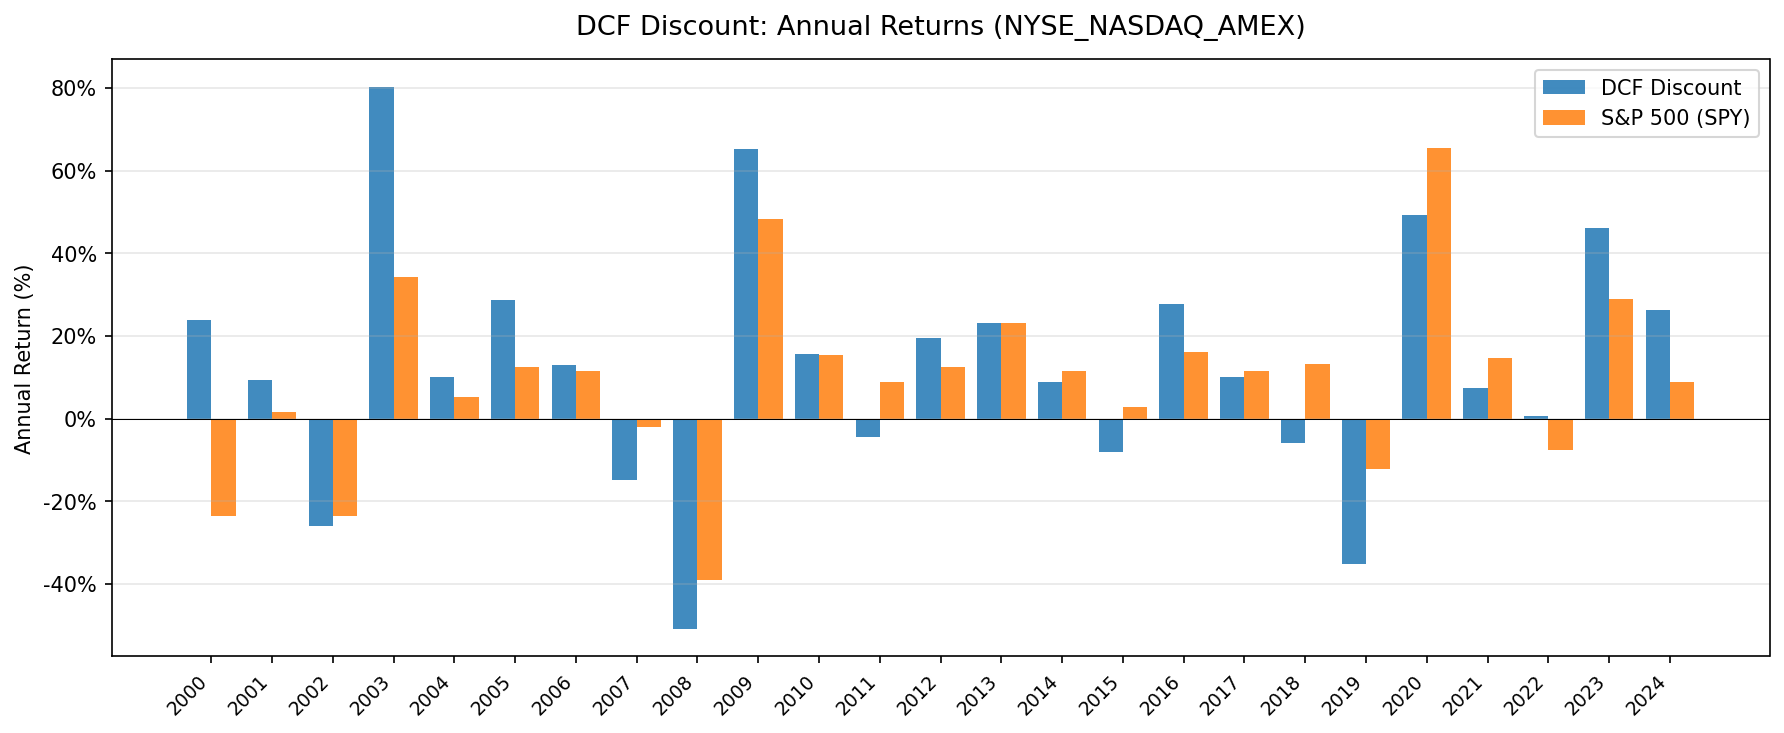
| 2024 | +29.7% | +10.2% | +19.5% |
The pattern jumps out immediately. The strategy's best years are recoveries and value cycles. 2000 (+47.5% excess) caught value stocks rallying while the dotcom bubble burst. 2003 (+43.7% excess) captured the post-crash snap-back. 2009 (+18.4%), 2016 (+15.1%), and 2023-2024 (+15.0%, +19.5%) all follow the same template: cheap stocks getting re-priced after periods of pessimism.
When It Works
Post-crash recoveries. The strongest excess returns cluster around market bottoms. In 2000, SPY lost 23.7% while the portfolio gained 23.8%. In 2003, the portfolio returned 75.8%. These are years when fear was highest and high-FCF-yield stocks were priced for permanent decline. The recovery was violent and rewarded patience.
Value-friendly regimes. 2005 (+16.2%), 2012 (+7.5%), 2016 (+15.1%), 2022 (+7.8%), 2023 (+15.0%), 2024 (+19.5%). When the market rotates toward value, free cash flow yield is a clean signal. These periods often follow rising rate environments or growth stock sell-offs.
Bear markets (partially). The strategy held up in 2000-2001 because high-FCF-yield stocks were already cheap. But 2008 was a different story. Stocks with high cash flow yields in early 2008 included financials and cyclicals that got crushed in the crisis.
When It Struggles
Growth and momentum rallies. 2018 (-19.2% excess), 2019 (-24.3%), 2020 (-14.1%), 2021 (-7.0%). When mega-cap tech dominates returns, the strategy falls behind. Companies like Apple, Microsoft, and Nvidia don't trade at 8.78% FCF yields. They never appear in the portfolio. A strategy that systematically excludes the market's biggest winners will lag when those winners are driving everything.
Financial crises. 2008 was the worst year: -48.3% vs -37.4% for SPY. High-FCF-yield stocks skewed toward financials and cyclicals that were hit hardest. The strategy's higher beta (1.078) means it amplifies drawdowns, not just rallies.
Late-cycle periods. 2007 (-12.4% excess), 2011 (-14.0%), 2015 (-15.7%). As cycles mature, the stocks that screen as cheap are often cheap for fundamental reasons: deteriorating cash flows, industry headwinds, management problems. The model uses trailing FCF, which can overstate the health of a company approaching a downturn.
Run It Yourself
Screen for current US stocks passing the DCF discount filter:
python3 dcf-discount/screen.py -preset us
Full historical backtest:
python3 dcf-discount/backtest.py -preset us -output results/us.json -verbose
Limitations
Higher volatility and deeper drawdowns. 28.75% annualized volatility is a third higher than SPY's 21.07%. The -55.75% max drawdown means an investor who bought at the peak would have lost more than half their portfolio before recovering. That takes real conviction to sit through.
Model sensitivity. The Gordon Growth Model uses fixed assumptions: 2.5% terminal growth, 10% discount rate. Change either by 1% and the implied multiple shifts from 13.67x to somewhere between 10.5x and 18.2x. The "discount" is only as good as the model's assumptions. Two reasonable people can disagree on inputs and get wildly different fair values.
Trailing FCF isn't forward FCF. The screen uses last year's free cash flow. A company with $500M FCF last year might have $200M next year if it's cyclical or facing secular decline. The model treats trailing FCF as a proxy for normalized cash flow. That works on average across a portfolio of 50 stocks, but individual positions can be traps.
Sector concentration. High-FCF-yield stocks tend to cluster in energy, financials, and industrials. The portfolio isn't diversified the way an index is. In years when those sectors underperform, the strategy drags.
No currency hedging. All returns are in USD. ADRs and foreign-listed stocks are excluded by the exchange filter, but companies with international revenue have implicit currency exposure.
Survivorship bias is minimal but present. The $1B market cap floor and broad exchange coverage reduce the risk, but some stocks that delisted during the period may have incomplete data.
Takeaway
Buying US stocks at a discount to intrinsic value, defined by a simple Gordon Growth Model on trailing free cash flow, delivered 8.59% CAGR over 25 years. That's 1.26% per year above SPY, compounding into 685.19% total return vs 485.91%.
The strategy isn't a free lunch. The risk-adjusted performance slightly trails the index. The Sharpe ratio is below SPY (0.229 vs 0.253). You get paid for the extra risk, but not much more than that.
Where this screen earns its keep: as one signal among several. A stock that's cheap on DCF, FCF yield, and P/E simultaneously is more likely genuinely undervalued than a stock cheap on one metric alone. The DCF discount screen is a useful lens, not a standalone system.
The annual return table tells the real story. If you can tolerate -48% in 2008, -35% in 2019, and stretches of multi-year underperformance versus the index, the long-term compounding rewards that patience. If you can't, a blended approach with other factors smooths the ride.
Part of a Series
This analysis is part of our DCF Discount global exchange comparison:
- DCF Discount on US Stocks (NYSE + NASDAQ + AMEX)
- DCF Discount on Indian Stocks (BSE + NSE)
- DCF Discount on Taiwan Stocks (TAI + TWO)
- DCF Discount on Canadian Stocks (TSX)
- DCF Discount on Korean Stocks (KSC)
- DCF Discount on German Stocks (XETRA)
- DCF Discount on Brazilian Stocks (SAO)
- DCF Discount on Australian Stocks (ASX)
- DCF Discount on Swedish Stocks (STO)
- DCF Discount: Global Exchange Comparison
Data: Ceta Research, FMP financial data warehouse. Backtest: 2000-2025, 25 annual periods, Gordon Growth Model (g=2.5%, r=10%, multiple=13.67x). Universe: NYSE + NASDAQ + AMEX, market cap >$1B, positive FCF. Size-tiered transaction costs applied. Full methodology: METHODOLOGY.md


