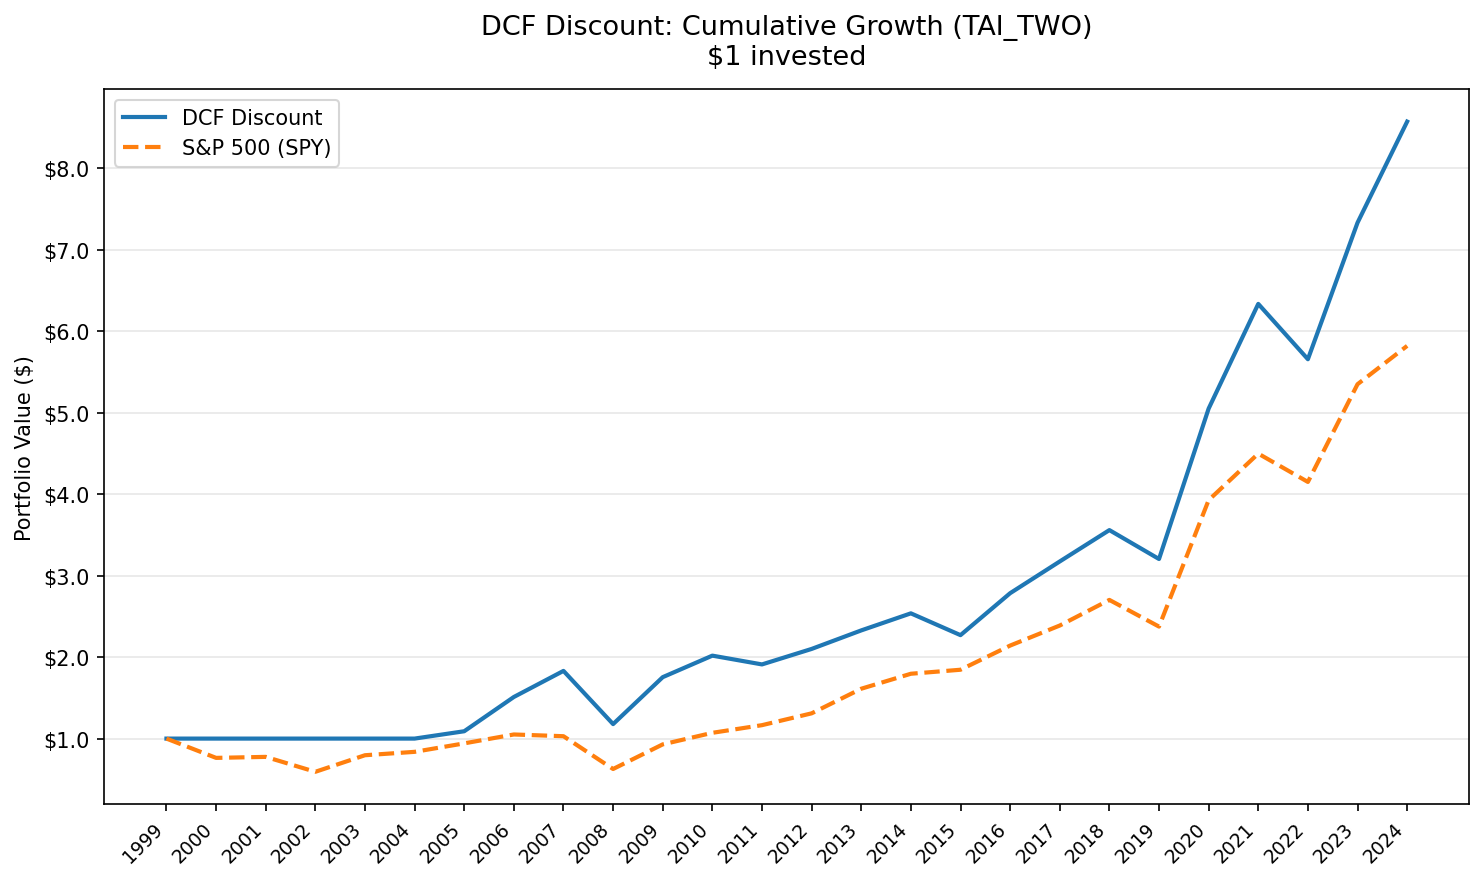
DCF Discount on Taiwanese Stocks: 9.15% CAGR, +6.10% Excess vs TAIEX
Taiwan's DCF discount portfolio returned 9.15% CAGR over 25 years, beating the TAIEX by +6.10% annually. The 0.398 Sharpe, -36.80% max drawdown, and 3.8:1 up/down capture asymmetry show strong risk-adjusted performance.


Taiwan produced strong risk-adjusted returns in our DCF discount backtest. Over 20 invested years (2005-2024), the strategy returned 9.15% CAGR with a 0.398 Sharpe, beating the TAIEX's 3.05% by +6.10% annually. The max drawdown was -36.80%. A beta of 0.644 against the TAIEX captured 103.26% of upside and only 27.35% of downside.
Contents
- Method
- The Screen
- Results
- Year-by-Year
- Key Observations
- The cash years (2000-2004)
- Contained drawdown
- Downside protection without sacrificing upside
- The tech market paradox
- Strong excess return with outstanding risk efficiency
- Limitations
- Takeaway
- Part of a Series
Taiwan's tech-heavy index (TSMC alone is ~30% of the TAIEX) didn't drag this portfolio into semiconductor volatility. The DCF screen found value elsewhere: industrials, materials, financials. Companies generating real free cash flow at reasonable prices.
Method
Signal: FCF/MarketCap >= 8.78% (equivalent to a 20% DCF discount). Gordon Growth Model: g=2.5%, r=10%, multiple=13.67x. Top 50 by FCF yield, equal weight. Universe: TAI + TWO (Taiwan Stock Exchange + Taipei Exchange). Market cap > NT$10B (~$312M USD). Period: 2000-2025 (25 years, annual rebalancing in April). Transaction costs: Size-tiered model applied. Benchmark: TAIEX (^TWII), the local Taiwanese benchmark. Data: Ceta Research (FMP financial data warehouse).
Full methodology: DCF Discount US (flagship post with model details, academic references, and limitations of DCF-based screening).
The Screen
SELECT
    k.symbol,
    p.companyName,
    p.exchange,
    ROUND(k.freeCashFlowYieldTTM * 100, 2) AS fcf_yield_pct,
    ROUND(k.marketCap / 1e9, 2) AS mktcap_b,
    ROUND(k.returnOnEquityTTM * 100, 1) AS roe_pct
FROM key_metrics_ttm k
JOIN profile p ON k.symbol = p.symbol
WHERE k.freeCashFlowYieldTTM >= 0.0878
  AND k.marketCap > 10000000000
  AND p.exchange IN ('TAI', 'TWO')
ORDER BY k.freeCashFlowYieldTTM DESC
LIMIT 50
Run this screen live on Ceta Research
Results
The headline: Taiwan's DCF discount portfolio beat the TAIEX by +6.10% annually. The Sharpe of 0.398 and Sortino of 0.924 strongly favor the portfolio. The TAIEX's Sharpe was just 0.080.
| Metric | DCF Discount Taiwan | TAIEX |
|---|---|---|
| CAGR | 9.15% | 3.05% |
| Total Return | 779.89% | 111.91% |
| Excess CAGR | +6.10% | -- |
| Max Drawdown | -36.80% | -57.10% |
| Annualized Volatility | 20.82% | 25.56% |
| Sharpe Ratio | 0.398 | 0.080 |
| Sortino Ratio | 0.924 | 0.144 |
| Calmar Ratio | 0.249 | 0.053 |
| Beta (vs TAIEX) | 0.644 | 1.0 |
| Alpha (annualized) | 7.18% | -- |
| Up Capture | 103.26% | -- |
| Down Capture | 27.35% | -- |
| Win Rate | 56% | -- |
| Information Ratio | 0.288 | -- |
| Cash Periods | 5/25 | 0 |
| Avg Stocks (invested) | 44.4 | -- |
The up/down capture ratio is the clearest way to read Taiwan's character. The portfolio captured 103.26% of the TAIEX's gains but only 27.35% of its losses. That 3.8:1 asymmetry is strong. Most value strategies on other exchanges run 1:1 or worse.
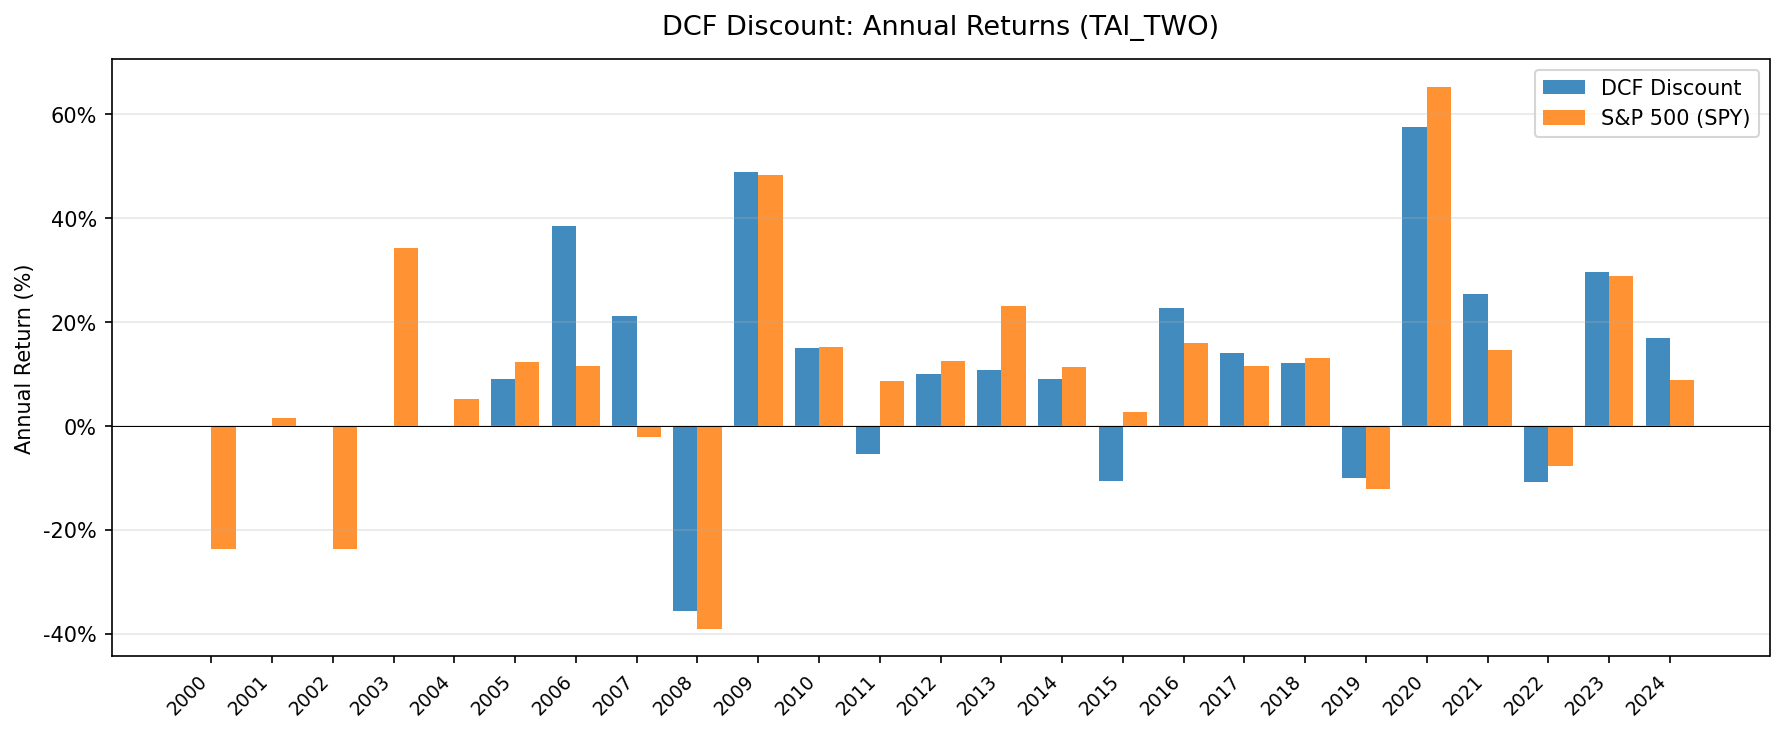
Year-by-Year
| Year | Portfolio | TAIEX | Excess |
|---|---|---|---|
| 2000 | 0.0% (cash) | -44.2% | +44.2% |
| 2001 | 0.0% (cash) | +11.3% | -11.3% |
| 2002 | 0.0% (cash) | -30.9% | +30.9% |
| 2003 | 0.0% (cash) | +51.8% | -51.8% |
| 2004 | 0.0% (cash) | -8.0% | +8.0% |
| 2005 | +10.1% | +10.7% | -0.6% |
| 2006 | +38.6% | +18.4% | +20.2% |
| 2007 | +23.4% | +9.1% | +14.2% |
| 2008 | -36.8% | -36.4% | -0.4% |
| 2009 | +46.9% | +46.6% | +0.3% |
| 2010 | +15.9% | +10.3% | +5.6% |
| 2011 | -6.2% | -11.2% | +5.0% |
| 2012 | +9.7% | +0.6% | +9.1% |
| 2013 | +10.9% | +12.5% | -1.7% |
| 2014 | +9.3% | +7.8% | +1.5% |
| 2015 | -11.5% | -11.3% | -0.2% |
| 2016 | +22.8% | +16.9% | +5.9% |
| 2017 | +13.9% | +9.4% | +4.5% |
| 2018 | +12.6% | -1.8% | +14.4% |
| 2019 | -9.2% | -8.2% | -1.0% |
| 2020 | +58.7% | +68.8% | -10.1% |
| 2021 | +30.4% | +6.4% | +24.1% |
| 2022 | -11.7% | -10.3% | -1.4% |
| 2023 | +30.0% | +29.5% | +0.5% |
| 2024 | +17.8% | +4.1% | +13.7% |
Key Observations
The cash years (2000-2004)
The portfolio sat in cash for the first five years. There weren't enough Taiwanese stocks above NT$10B market cap with sufficient FCF data on TAI+TWO to build a 10-stock portfolio. Taiwan's listed universe was smaller then, and FMP coverage of Taiwanese companies before 2005 is thin.
This creates a data artifact: the strategy missed the 2003 TAIEX rally (+51.8%) and avoided the 2000-2002 drawdowns. From 2005 onward, the portfolio was fully invested every year with an average of 44.4 stocks. All the return and risk numbers reflect this 20-year invested period.
Contained drawdown
The worst year was 2008: -36.8%. The TAIEX fell -36.4%, so the portfolio tracked the market almost exactly during the crisis. Taiwan's -36.8% in a single year drove the -36.80% max drawdown. That's much shallower than the TAIEX's own -57.10% max drawdown, since the portfolio was in cash during earlier TAIEX crashes.
Why did Taiwan hold up relatively well? Taiwanese value stocks tilted toward cash-rich industrials and electronics manufacturers with strong balance sheets. Taiwan's economy contracted but the export machine bounced back fast. The portfolio recovered fully by mid-2009 (+46.9%).
Downside protection without sacrificing upside
The 0.644 beta means the portfolio moved about 64% as much as the TAIEX in either direction. But the capture ratios tell a different story. Up capture of 103.26% means it captured more upside than beta alone would predict. Down capture of 27.35% means it participated in barely a quarter of the TAIEX's losses.
That asymmetry is the core finding. Taiwan's DCF discount portfolio didn't just dampen volatility. It did so asymmetrically, giving up far less downside than upside. The Sortino ratio of 0.924 (which penalizes only downside deviation) confirms this, more than 6x the TAIEX's 0.144.
The tech market paradox
Taiwan's TAIEX is dominated by semiconductor and electronics companies. TSMC alone is a massive portion of the index. You'd expect a value screen on a tech-heavy market to either miss the best performers (underweight tech) or get dragged into cyclical semiconductor downturns.
Neither happened. The DCF screen selected companies generating high free cash flow relative to market cap. In Taiwan, those tend to be component manufacturers, industrial conglomerates, financial holding companies, and mid-cap electronics firms. Not the TSMC-tier headline names, but the companies supplying the supply chain. These businesses are less volatile than the flagship semiconductor stocks, and their cash flows are more predictable.
Strong excess return with outstanding risk efficiency
The +6.10% excess CAGR is substantial. Taiwan delivered those returns with lower risk than the benchmark. The Calmar ratio (CAGR/MaxDD) of 0.249 is nearly 5x the TAIEX's 0.053. Volatility of 20.82% is lower than the TAIEX's 25.56%. Taiwan's DCF discount portfolio was less volatile than its benchmark, a rare result.
Limitations
Cash drag and data coverage. Five years of cash (2000-2004) mean the 25-year CAGR blends invested and uninvested periods. The 20-year invested CAGR (2005-2024) would be higher than the reported 9.15%. The early cash years reflect FMP's coverage gap for Taiwanese stocks, not a signal failure.
Currency exposure. Returns are in TWD (Taiwan Dollar). The TWD has been relatively stable against the USD over this period, trading between roughly 31 and 33 TWD/USD for most of the backtest window. FX impact is smaller here than for India or Korea, but it's still present. A USD-based investor buying Taiwanese equities directly would see slightly different returns depending on entry and exit timing.
Benchmark choice. We compare against the TAIEX as the local Taiwanese benchmark. The +6.10% annual excess captures the strategy's performance relative to the broad Taiwanese market.
Concentration risk. 44.4 stocks on average, but Taiwan's listed universe is smaller than the US or India. Sector concentration toward industrials and electronics component makers is inherent in what the screen selects.
Survivorship and delisted companies. FMP includes delisted Taiwanese stocks (partially addressing survivorship bias), but coverage quality for smaller TAI/TWO listings before 2010 is less comprehensive than for the US.
Takeaway
Taiwan produced one of the most risk-efficient DCF discount portfolios of any market we tested. The 0.398 Sharpe, 0.924 Sortino, and -36.80% max drawdown show strong risk-adjusted performance. The up/down capture asymmetry (103.26% / 27.35%) shows the strategy does what value investing is supposed to do: participate in gains, protect against losses.
The +6.10% annual excess return vs the TAIEX is substantial. This is a steady, risk-aware value portfolio on a market that sits at the center of global semiconductor supply chains, but whose value stocks are the quieter companies making the whole thing run.
Part of a Series
This analysis is part of our DCF Discount global exchange comparison:
- DCF Discount on US Stocks (NYSE + NASDAQ + AMEX)
- DCF Discount on Indian Stocks (BSE + NSE)
- DCF Discount on Taiwan Stocks (TAI + TWO)
- DCF Discount on Canadian Stocks (TSX)
- DCF Discount on Korean Stocks (KSC)
- DCF Discount on German Stocks (XETRA)
- DCF Discount on Brazilian Stocks (SAO)
- DCF Discount on Australian Stocks (ASX)
- DCF Discount on Swedish Stocks (STO)
- DCF Discount: Global Exchange Comparison
Data: Ceta Research (FMP financial data warehouse), TAI+TWO, 2000-2025. Returns in TWD. Full methodology: METHODOLOGY.md. Backtest code: backtests/dcf-discount/.