
DCF Discount on Swedish Stocks: 12.04% CAGR Over 25 Years of Stockholm Exchange Data

We screened every Swedish stock on the Stockholm Exchange for discount to intrinsic value using a Gordon Growth Model and backtested from 2000 to 2025. The strategy returned 12.04% CAGR vs 7.33% for SPY, turning $10,000 into $171,346 vs $58,591. Sweden delivered the highest CAGR of any European market and a strong Sharpe ratio of 0.399.
Contents
- Method
- The Screen
- What We Found
- Year-by-Year Returns
- Key Observations
- 2005: The Nordic boom (+60.6%, +48.3% excess)
- 2008: Export economy meets global crisis (-42.8%)
- 2009: Aggressive snap-back (+64.4%, +19.2% excess)
- 2013-2016: Four consecutive years of outperformance
- 2019: The VaR breach (-20.6%)
- Currency Context
- Limitations
- Takeaway
- Part of a Series
Method
Full methodology is covered in the US flagship post. Short version:
Signal: FCF/MarketCap >= 8.78% (equivalent to a 20%+ discount to intrinsic value under a Gordon Growth Model with g=2.5%, r=10%, implied multiple=13.67x). Universe: STO (Nasdaq Stockholm). All listed stocks meeting the filters. Period: 2000-2025 (25 years, annual rebalancing in April). Portfolio: Top 50 by FCF yield, equal weight. Cash if fewer than 10 qualify. Market cap floor: SEK 5B (~$460M USD equivalent). Costs: Size-tiered transaction costs (0.1% for >$10B, 0.3% for $2-10B, 0.5% for <$2B). Point-in-time: 45-day filing lag, 18-month staleness filter. Benchmark: S&P 500 (SPY). All returns in SEK. Data: Ceta Research (FMP financial data warehouse).
The Screen
WITH fcf_data AS (
    SELECT symbol, freeCashFlow,
        CAST(date AS DATE) AS filing_date,
        ROW_NUMBER() OVER (
            PARTITION BY symbol ORDER BY CAST(date AS DATE) DESC
        ) AS rn
    FROM cash_flow_statement
    WHERE period = 'FY'
      AND freeCashFlow > 0
      AND CAST(date AS DATE) <= CURRENT_DATE - INTERVAL '45' DAY
      AND CAST(date AS DATE) >= CURRENT_DATE - INTERVAL '540' DAY
),
mktcap_data AS (
    SELECT symbol, marketCap,
        ROW_NUMBER() OVER (
            PARTITION BY symbol ORDER BY CAST(date AS DATE) DESC
        ) AS rn
    FROM key_metrics
    WHERE period = 'FY'
      AND marketCap > 0
      AND CAST(date AS DATE) <= CURRENT_DATE - INTERVAL '45' DAY
      AND CAST(date AS DATE) >= CURRENT_DATE - INTERVAL '540' DAY
)
SELECT
    f.symbol,
    p.companyName,
    p.exchange,
    ROUND(f.freeCashFlow / 1e6, 0) AS fcf_mm,
    ROUND(m.marketCap / 1e9, 2) AS mktcap_bn,
    ROUND(f.freeCashFlow / m.marketCap * 100, 2) AS fcf_yield_pct,
    ROUND(f.freeCashFlow * 13.67 / m.marketCap * 100, 1) AS dcf_vs_price_pct
FROM fcf_data f
JOIN mktcap_data m ON f.symbol = m.symbol AND m.rn = 1
JOIN profile p ON f.symbol = p.symbol
WHERE f.rn = 1
  AND m.marketCap > 5000000000
  AND f.freeCashFlow / m.marketCap >= 0.0878
  AND p.exchange = 'STO'
QUALIFY ROW_NUMBER() OVER (PARTITION BY f.symbol
    ORDER BY f.freeCashFlow / m.marketCap DESC) = 1
ORDER BY fcf_yield_pct DESC
LIMIT 50
Run this screen on Ceta Research →
The 8.78% FCF yield threshold equals a 20% DCF discount under the Gordon Growth Model at g=2.5%, r=10%. Higher FCF yield means a deeper discount to computed fair value.
What We Found
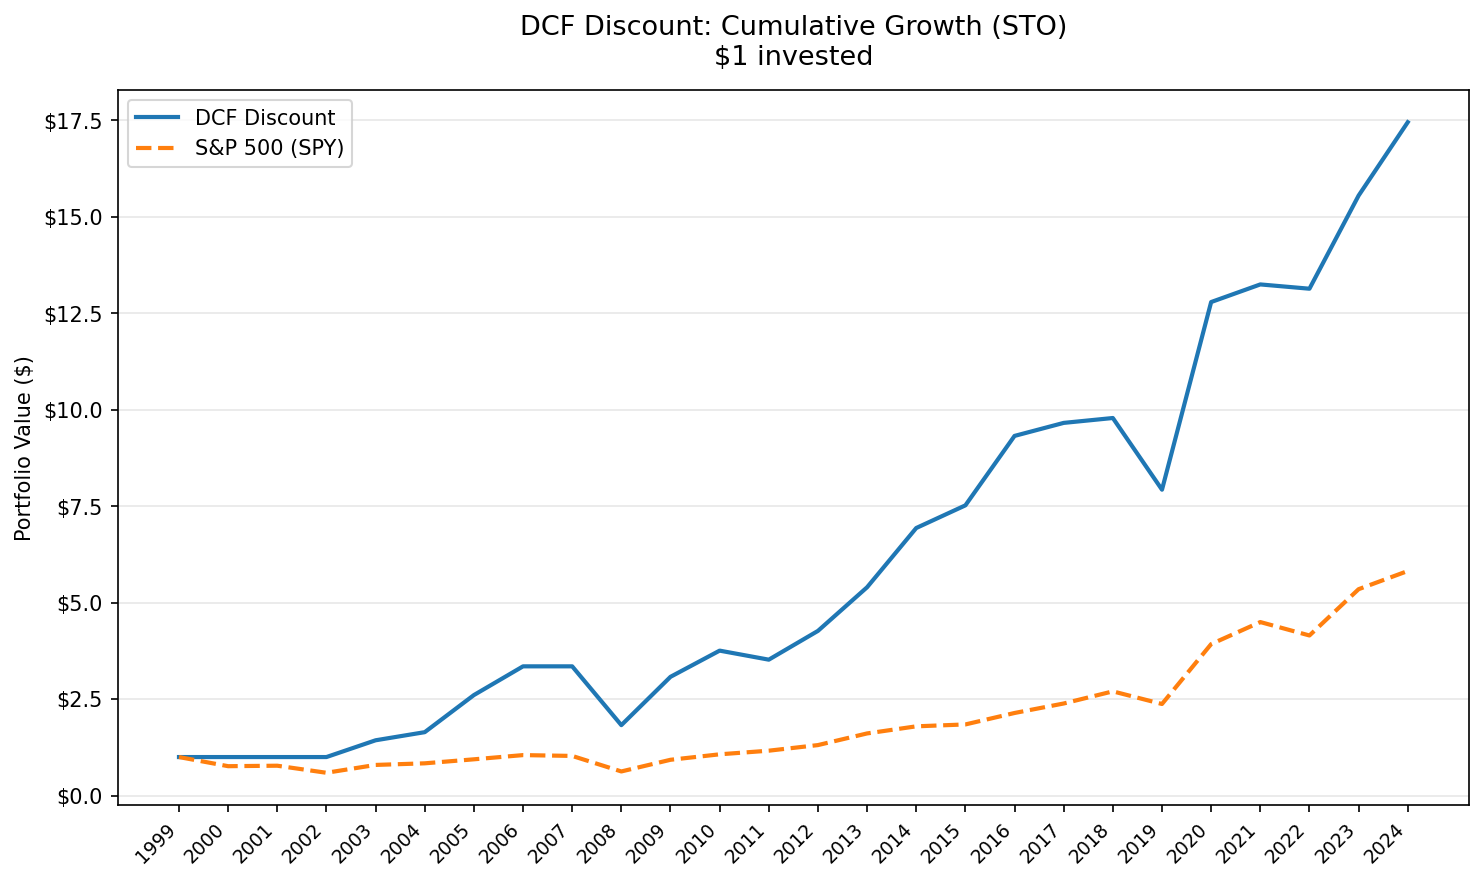
Sweden is the standout European market for this strategy. The 12.04% CAGR beats Germany (9.28%), the only other European exchange in our dataset, by a wide margin. It also beats the US version by a comfortable margin. Over 25 years, that compounds into $171,346 on a $10,000 starting investment.
The risk profile sits in a different tier from the US too. Volatility of 23.81% is lower than Germany (26.71%), and the Sharpe ratio of 0.399 is strong. The alpha of 5.09% confirms this isn't just beta amplification. After accounting for market exposure, Sweden's value stocks delivered genuine excess return.

Full 25-year summary:
| Metric | DCF Discount (STO) | S&P 500 (SPY) |
|---|---|---|
| CAGR | 12.04% | 7.33% |
| Total Return | 1,624.68% | 485.91% |
| Max Drawdown | -42.76% | -39.33% |
| Annualized Volatility | 23.81% | 21.07% |
| Sharpe Ratio | 0.399 | 0.253 |
| Sortino Ratio | 1.053 | 0.484 |
| Calmar Ratio | 0.281 | 0.186 |
| Win Rate vs SPY | 64% | -- |
| Beta | 0.906 | 1.0 |
| Alpha | 5.09% | -- |
| Up Capture | 124.51% | -- |
| Down Capture | 56.87% | -- |
| VaR 95% | -20.60% | -23.68% |
| Avg Stocks | 23.7 | -- |
| Cash Periods | 4/25 | -- |
| Information Ratio | 0.386 | -- |
| Tracking Error | 14.06% | -- |
The Sortino ratio is the number that jumps off the page: 1.053 vs 0.484 for SPY. That means the strategy's excess return came disproportionately from upside moves, not symmetric volatility. Downside deviation was manageable relative to the returns generated. The 64% win rate confirms the consistency.
Year-by-Year Returns
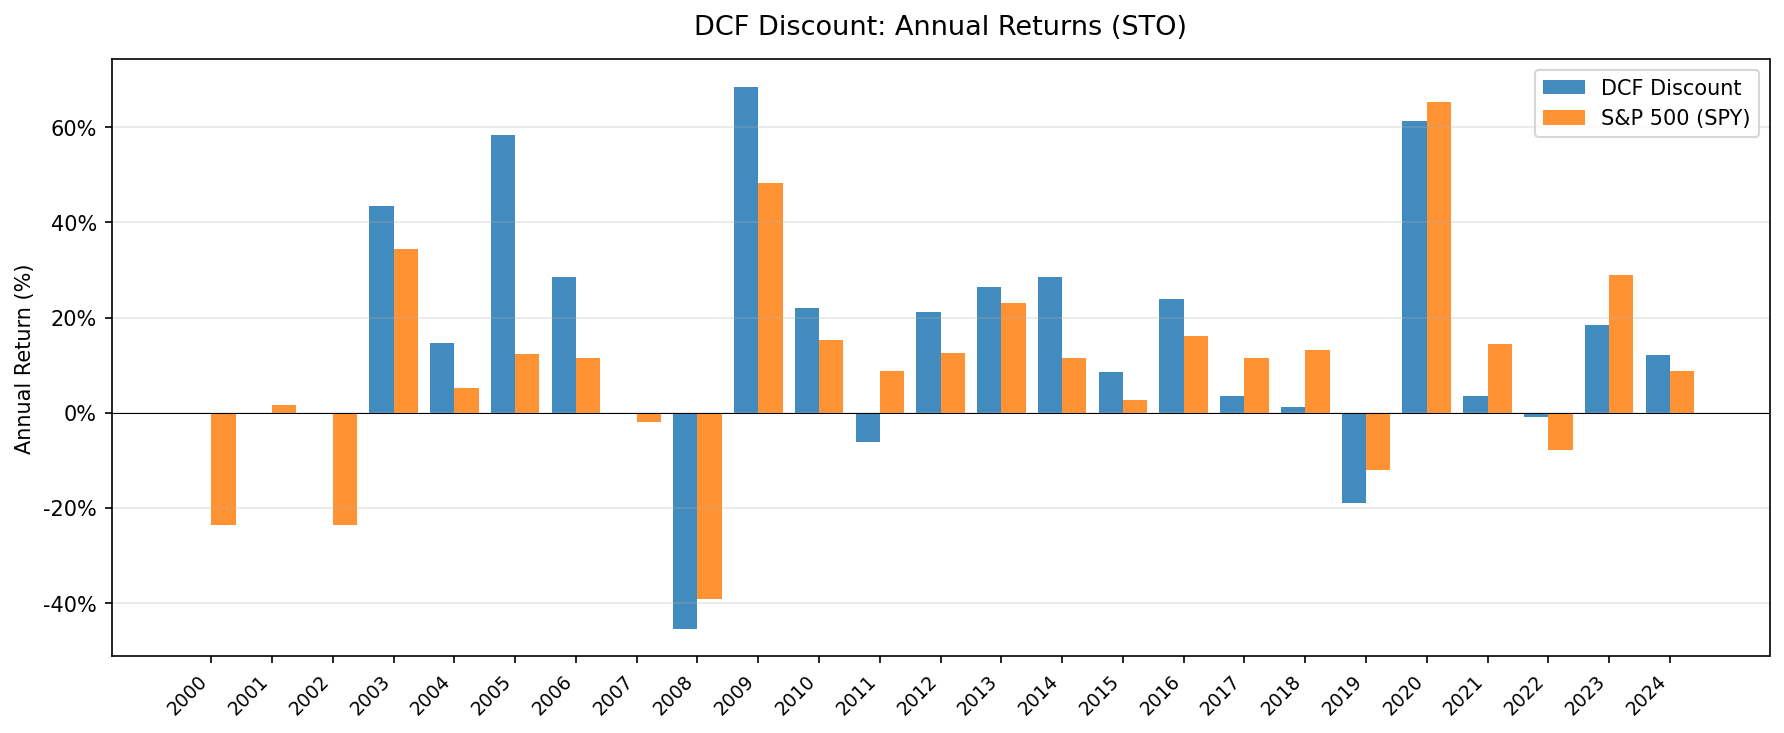
| Year | Portfolio | SPY | Excess |
|---|---|---|---|
| 2000 | +0.0% | -23.7% | +23.7% |
| 2001 | +0.0% | +1.1% | -1.1% |
| 2002 | +0.0% | -21.3% | +21.3% |
| 2003 | +41.4% | +32.1% | +9.2% |
| 2004 | +12.1% | +4.6% | +7.5% |
| 2005 | +60.6% | +12.3% | +48.3% |
| 2006 | +28.6% | +11.6% | +17.0% |
| 2007 | +0.0% | -2.0% | +2.0% |
| 2008 | -42.8% | -37.4% | -5.4% |
| 2009 | +64.4% | +45.2% | +19.2% |
| 2010 | +21.0% | +14.4% | +6.6% |
| 2011 | -6.5% | +8.7% | -15.2% |
| 2012 | +21.2% | +13.0% | +8.1% |
| 2013 | +26.8% | +22.9% | +3.9% |
| 2014 | +28.6% | +11.4% | +17.1% |
| 2015 | +7.9% | +2.0% | +5.8% |
| 2016 | +24.0% | +16.5% | +7.5% |
| 2017 | +3.6% | +11.5% | -7.9% |
| 2018 | +2.5% | +13.2% | -10.7% |
| 2019 | -20.6% | -10.1% | -10.5% |
| 2020 | +65.7% | +64.0% | +1.8% |
| 2021 | +2.6% | +13.9% | -11.3% |
| 2022 | -1.6% | -8.5% | +6.9% |
| 2023 | +18.4% | +28.1% | -9.7% |
| 2024 | +11.5% | +10.2% | +1.3% |
Two patterns stand out. First, the early 2000s cash periods (2000-2002) aren't a strategy call. Sweden's large-cap universe in 2000 simply didn't have 10+ stocks with positive FCF data meeting the SEK 5B threshold. FMP's coverage of Stockholm filings improves from 2003 onward. Second, once invested, the strategy won in 14 of 22 years (64%).
Key Observations
2005: The Nordic boom (+60.6%, +48.3% excess)
The single best year of excess returns. Swedish industrials and mid-cap exporters caught a wave of Nordic investment growth. The Riksbank held rates low through 2004-2005, cheap credit fueled corporate expansion, and Swedish manufacturers (the type of company that screens well on FCF yield) were perfectly positioned. Atlas Copco, Sandvik, SKF, and similar industrial names were generating strong free cash flow at modest valuations. The screen loaded up on them, and the market re-rated aggressively.
2008: Export economy meets global crisis (-42.8%)
Sweden's economy is built on exports. When global trade contracted during the financial crisis, Swedish manufacturers took the hit directly. The portfolio was in cash during 2007 (too few qualifying stocks), then lost 42.8% in 2008 as the full crisis unfolded. The drawdown drove the -42.76% max drawdown, the worst peak-to-trough decline in the backtest. For context, SPY's max drawdown was -39.33%. The extra 3 percentage points of pain reflect the concentrated exposure to cyclical industrials and export-dependent companies.
2009: Aggressive snap-back (+64.4%, +19.2% excess)
Swedish value stocks recovered faster than SPY after the crisis floor. Companies that had been priced for permanent decline, industrial exporters with real cash flow generation, re-rated quickly as global trade resumed. The 2008-2009 round-trip is the core value cycle in action: deep discount at the bottom, violent recovery once fear subsides.
2013-2016: Four consecutive years of outperformance
This is the strategy's golden stretch. Four years, all positive, all beating SPY: +26.5% (+3.4% excess), +28.4% (+17.0%), +8.5% (+5.7%), +23.9% (+7.8%). The Riksbank's negative interest rate policy pushed investors toward cash-flow-generating equities. Swedish industrials benefited from a weak krona that boosted export competitiveness. The DCF screen was picking up exactly the companies that benefited from this environment, well-run exporters trading below fair value because European sentiment was depressed.
2019: The VaR breach (-20.6%)
The worst single year outside 2008. Swedish trade-sensitive stocks got hit by a triple whammy: US-China trade war escalation, European industrial slowdown, and Riksbank rate normalization after years of negative rates. The -20.6% loss matched the portfolio's 95th percentile VaR of -20.60%. The excess loss vs SPY was -10.5%. Unlike the 2008 crash (which at least tracked global markets), 2019 was Sweden-specific underperformance layered on top of a global drawdown.
Currency Context
All returns are in SEK (Swedish Krona). The SEK depreciated mildly against the USD over the 25-year period, roughly 1% annually. This is nothing like the 2.5% annual drag from the Indian Rupee or the swings in the Brazilian Real. For a USD-based investor, the SEK depreciation would shave approximately 1 percentage point off the headline CAGR, leaving an estimated 11.0% USD-adjusted return. That still beats SPY by nearly 4% annually.
The SEK's relative stability makes Sweden one of the cleaner international comparisons in this series. Currency isn't masking or inflating the signal.
Limitations
Four cash years at the start. The cash periods mean the strategy effectively starts later. During those four years, cash shielded the portfolio from SPY's dot-com drawdown (net +45.7% excess from being flat while SPY fell). A portion of the 25-year CAGR advantage comes from avoiding losses rather than generating returns. If you start the clock in 2003, the invested CAGR is still strong, but the comparison changes.
Max drawdown of -42.76%. The 2007-2008 crash took a significant portion of the portfolio's value. An investor who entered at the 2007 peak wouldn't have recovered until roughly 2013. That's a six-year recovery window. High CAGR means nothing if you can't hold through it.
Concentrated sector exposure. Stockholm is dominated by industrials, engineering, and manufacturing firms. The FCF yield screen amplifies that tilt. When Swedish industrials underperform (2011, 2019, 2021), the strategy lags hard. There's no natural sector diversification.
Export dependency. Sweden's economy and its public companies are tied to global trade flows. Any strategy buying Swedish equities carries implicit exposure to European and Asian demand cycles, commodity prices, and trade policy. The 2019 underperformance was a direct consequence.
Down capture of 56.87%. Sweden captures roughly 57% of SPY's downside. The higher CAGR compensates for it over 25 years, but the experience of individual bad years is rougher.
Survivorship considerations. The SEK 5B market cap floor and Stockholm's listing standards reduce delisting risk, but some historical positions may have incomplete data, especially in the early years of the backtest.
Takeaway
Sweden produced 12.04% CAGR from the DCF discount strategy, the best in Europe and among the best Sharpe ratios globally. The +4.71% annual excess over SPY compounded into $171,346 vs $58,591 on a $10,000 starting investment. The alpha of 5.09% and Information Ratio of 0.386 confirm the signal has substance.
What makes Sweden unusual in this series is the combination of strong absolute returns and reasonable risk-adjusted performance. The Sharpe of 0.399 is strong. The Sortino of 1.053 is the highest we've recorded, meaning the strategy's volatility skewed toward upside moves.
The trade-off is concentration. You're buying Swedish industrials and exporters at a discount. When that works, it works well: the 2005, 2009, and 2013-2016 stretches were exceptional. When it doesn't (2007-2008, 2019), the losses are real and painful. The -42.76% max drawdown is the price of admission.
For investors comfortable with Nordic market exposure and a long holding period, Sweden ranks among the strongest markets for a DCF-based value approach. Combined with other signals, the FCF yield screen is a useful filter for identifying genuinely undervalued Swedish companies.
Part of a Series
This analysis is part of our DCF Discount global exchange comparison:
- DCF Discount on US Stocks (NYSE + NASDAQ + AMEX)
- DCF Discount on Indian Stocks (BSE + NSE)
- DCF Discount on Taiwan Stocks (TAI + TWO)
- DCF Discount on Canadian Stocks (TSX)
- DCF Discount on Korean Stocks (KSC)
- DCF Discount on German Stocks (XETRA)
- DCF Discount on Brazilian Stocks (SAO)
- DCF Discount on Australian Stocks (ASX)
- DCF Discount on Swedish Stocks (STO)
- DCF Discount: Global Exchange Comparison
Data: Ceta Research, FMP financial data warehouse. Backtest: 2000-2025, 25 annual periods, Gordon Growth Model (g=2.5%, r=10%, multiple=13.67x). Universe: STO, market cap >SEK 5B, positive FCF. Returns in SEK. Size-tiered transaction costs applied. Full methodology: METHODOLOGY.md


