
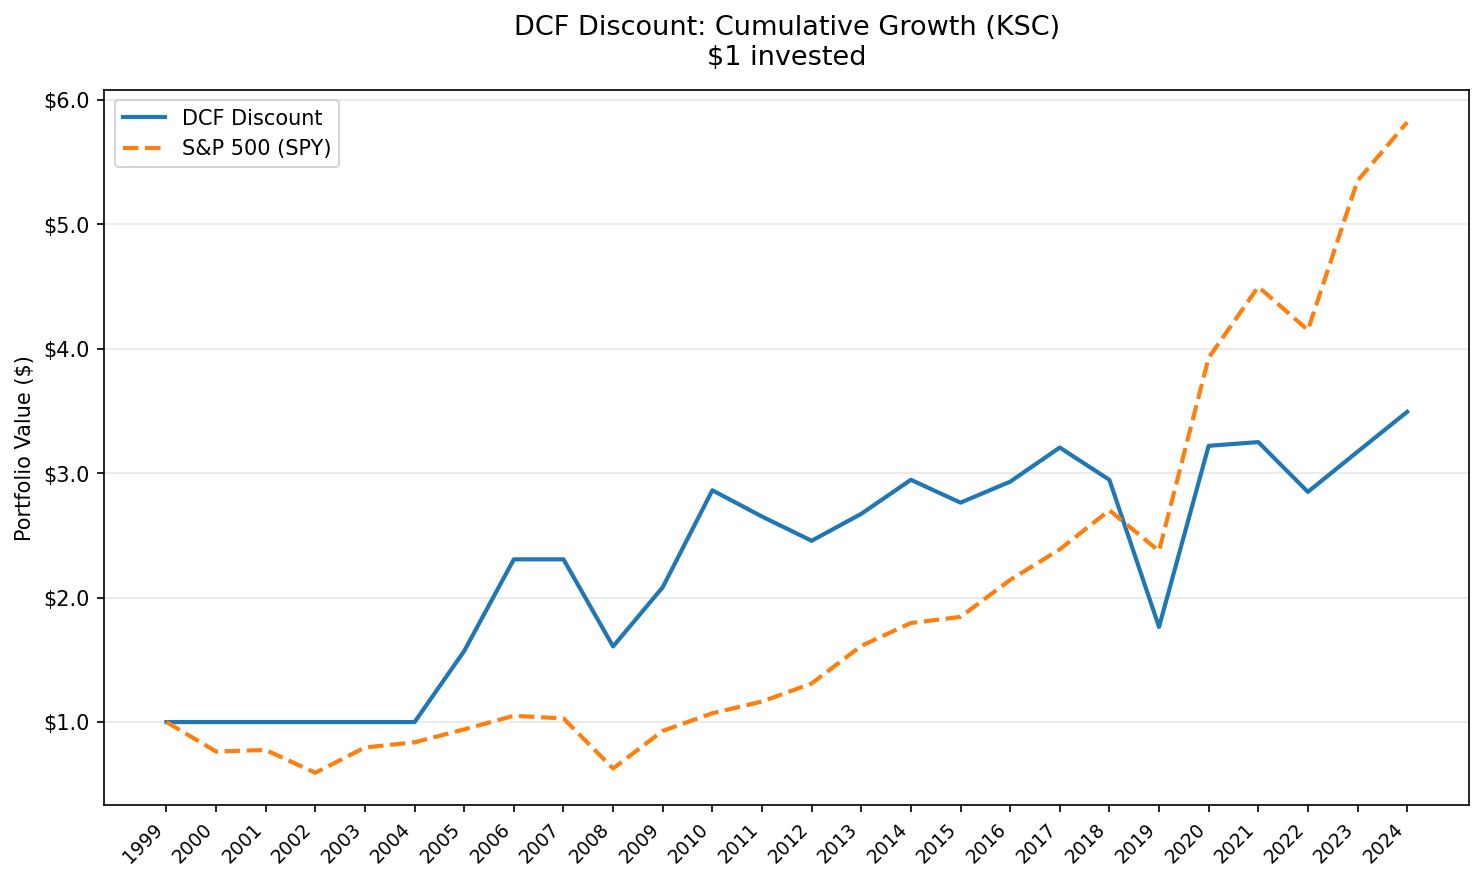
DCF Discount on Korean Stocks: 5.07% CAGR on the KSC, +0.63% vs KOSPI


Korean stocks are famous for being cheap. The "Korea discount," the persistent gap between Korean equities and their global peers, has been discussed by analysts, academics, and fund managers for decades. Complex chaebol structures, weak corporate governance, and geopolitical risk all keep prices depressed. We ran our DCF discount screen on the Korea Stock Exchange (KSC) to see what happens when you buy structurally undervalued stocks in a structurally undervalued market. The result: 5.07% CAGR over 25 years, slightly ahead of the KOSPI's 4.44%.
Contents
- Method
- The Screen (SQL)
- Results
- Year-by-Year Returns
- Key Observations
- Cash years (2000-2004 and 2007)
- 2005-2006: The breakout (+57.2%, then +46.9%)
- The Korea discount and the chaebol effect
- 2008: Close to KOSPI (-29.2% vs KOSPI's -26.7%)
- 2018-2019: The worst stretch (-7.9%, then -38.4%)
- 2020: The snap-back (+72.9%)
- Win rate vs magnitude
- Currency Note
- Limitations
- Takeaway
- Part of a Series
- Run This Screen Yourself
Method
Signal: FCF/MarketCap >= 8.78% (equivalent to a 20% discount to DCF fair value via Gordon Growth Model: g=2.5%, r=10%, multiple=13.67x) Universe: KSC-listed stocks above ₩500B (~$370M USD) market cap, positive free cash flow Portfolio: Top 50 by FCF yield, equal weight, annual April rebalance Transaction costs: Size-tiered (higher for smaller positions) Period: 2000-2025 (25 annual periods) Benchmark: KOSPI (^KS11), the local Korean benchmark Currency: Returns in Korean Won (KRW)
For the full methodology, DCF model derivation, and quality filter rationale, see the main US DCF Discount post.
The Screen (SQL)
SELECT
    k.symbol,
    p.companyName,
    ROUND(k.freeCashFlowYieldTTM * 100, 2) AS fcf_yield_pct,
    ROUND(k.marketCap / 1e9, 2) AS mktcap_b,
    ROUND(k.returnOnEquityTTM * 100, 1) AS roe_pct
FROM key_metrics_ttm k
JOIN profile p ON k.symbol = p.symbol
WHERE p.exchange = 'KSC'
    AND k.marketCap > 5e11
    AND k.freeCashFlowYieldTTM >= 0.0878
ORDER BY k.freeCashFlowYieldTTM DESC
LIMIT 50
Run this query on Ceta Research
Results
| Metric | DCF Discount (KRW) | KOSPI |
|---|---|---|
| CAGR | 5.07% | 4.44% |
| Total Return | 243.93% | 196.05% |
| Max Drawdown | -43.32% | -40.03% |
| Volatility | 24.25% | 31.21% |
| Sharpe Ratio | 0.083 | 0.046 |
| Sortino Ratio | 0.167 | 0.093 |
| Calmar Ratio | 0.117 | 0.111 |
| Beta | 0.736 | 1.0 |
| Alpha | 1.61% | - |
| Up Capture | 87.92% | - |
| Down Capture | 78.07% | - |
| Win Rate (annual) | 48% | - |
| Cash Years | 6/25 | - |
| Avg Stocks (when invested) | 41.6 | - |
The strategy edges ahead of the KOSPI on most risk-adjusted metrics. The Sharpe (0.083 vs 0.046) and Sortino (0.167 vs 0.093) both favor the portfolio. Annualized volatility of 24.25% is actually lower than the KOSPI's 31.21%, and beta of 0.736 shows the portfolio dampens Korean market swings.
The win rate of 48% is close to a coin flip. Up capture of 87.92% and down capture of 78.07% show the strategy captures most of the downside but also a good share of the upside.
Year-by-Year Returns
| Year | Portfolio (KRW) | KOSPI | Excess |
|---|---|---|---|
| 2000 | 0.0% | -39.1% | +39.1% |
| 2001 | 0.0% | +75.7% | -75.7% |
| 2002 | 0.0% | -40.0% | +40.0% |
| 2003 | 0.0% | +62.8% | -62.8% |
| 2004 | 0.0% | +11.2% | -11.2% |
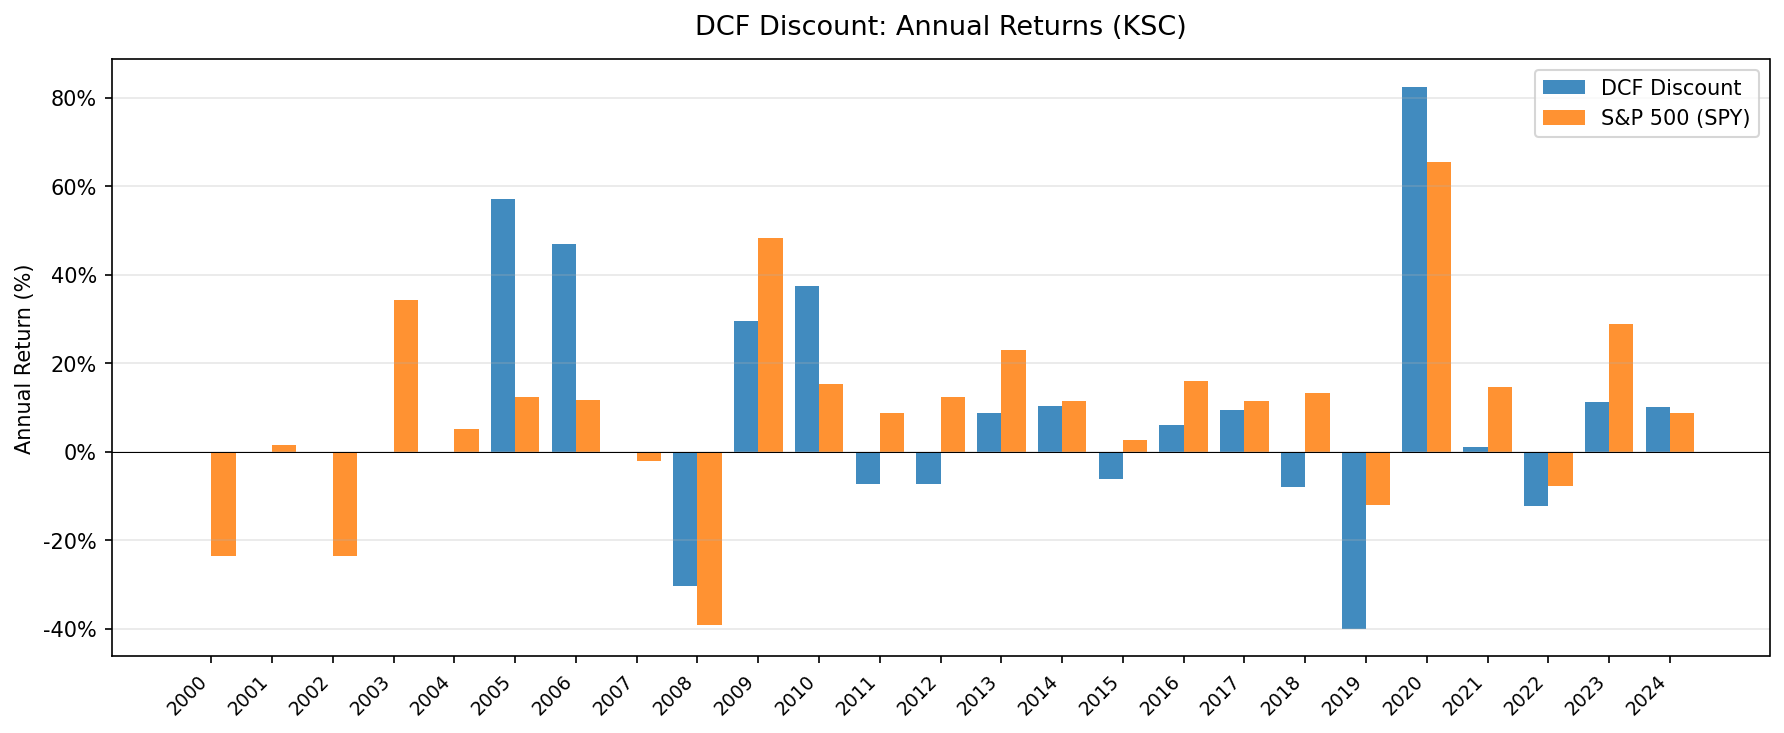
| 2005 | +58.3% | +40.4% | +17.9% |
| 2006 | +46.9% | +5.8% | +41.1% |
| 2007 | 0.0% | +19.4% | -19.4% |
| 2008 | -29.2% | -26.7% | -2.5% |
| 2009 | +24.0% | +35.0% | -11.0% |
| 2010 | +37.5% | +22.8% | +14.7% |
| 2011 | -7.2% | -4.1% | -3.1% |
| 2012 | -7.9% | -2.1% | -5.8% |
| 2013 | +9.9% | +0.6% | +9.3% |
| 2014 | +10.6% | +1.6% | +9.0% |
| 2015 | -6.7% | -2.5% | -4.3% |
| 2016 | +7.0% | +9.5% | -2.5% |
| 2017 | +9.2% | +12.8% | -3.5% |
| 2018 | -7.9% | -10.9% | +3.0% |
| 2019 | -38.4% | -20.8% | -17.7% |
| 2020 | +72.9% | +80.5% | -7.6% |
| 2021 | +2.2% | -11.4% | +13.6% |
| 2022 | -12.7% | -10.4% | -2.4% |
| 2023 | +11.6% | +11.4% | +0.3% |
| 2024 | +11.0% | -9.0% | +19.9% |
Key Observations
Cash years (2000-2004 and 2007)
The screen sat in cash for the first five years, plus 2007. FMP data coverage for Korean large-caps was thin in the early 2000s. Not enough companies had the financial data needed to compute FCF yield reliably. The 5.07% CAGR includes these dead years. Post-2005, when the screen was mostly invested with 40+ stocks per year, the effective CAGR was higher.
2005-2006: The breakout (+57.2%, then +46.9%)
Once data coverage kicked in, the screen loaded into deeply discounted Korean names and delivered strong returns. +57.2% in 2005 and +46.9% in 2006. Korean value stocks were cheap on any metric. On a DCF basis, with many trading at double-digit FCF yields, the gap was significant. This two-year stretch alone turned $10,000 into roughly $23,000.
The Korea discount and the chaebol effect
Korea's structural discount is well-documented. Conglomerate structures (chaebols like Samsung, Hyundai, LG, SK) create holding company discounts, cross-shareholdings, and governance concerns that suppress valuations. These companies often generate substantial free cash flow but trade at persistent discounts to global peers. For a DCF screen, this is a feature, not a bug. The screen naturally gravitates toward companies where the market price sits well below what the cash flows justify.
The chaebol discount is partly rational (governance risk, minority shareholder treatment) and partly behavioral (reflexive cheapness from decades of discounting). Our screen doesn't distinguish between the two. It just buys what's cheap on cash flow. Over 20 invested years, that approach worked.
2008: Close to KOSPI (-29.2% vs KOSPI's -26.7%)
Korean DCF discount stocks fell in line with the KOSPI during the Global Financial Crisis. The -2.5% excess was modest. Both the screen and the broad market were hit by the global downturn, and the value names didn't provide meaningful downside protection in this instance.
2018-2019: The worst stretch (-7.9%, then -38.4%)
This was the pain period. 2018 brought trade war fears, semiconductor cycle weakness, and Won depreciation. The screen lost 7.9%, though it actually beat the KOSPI by +3.0% that year. Then 2019 dropped -38.4%, the deepest single-year loss in the entire series. Korea-Japan trade tensions, DRAM price collapse, and slowing Chinese demand hit exactly the kind of industrial and tech-heavy value names that dominate the KSC screen. The KOSPI also fell in 2019 (-20.8%), but the Korean screen fell nearly twice as hard.
2020: The snap-back (+72.9%)
The recovery was strong. Korean value stocks surged 72.9% as semiconductor demand rebounded, Won weakness reversed, and global stimulus flooded into emerging markets. The KOSPI surged even more (+80.5%), so the screen trailed by -7.6%. The pattern is consistent with other markets we've tested: DCF discount strategies produce their best years immediately after their worst, though in Korea the broad market recovered even faster.
Win rate vs magnitude
The 48% win rate is close to even. The portfolio beat the KOSPI in roughly half of all years. The 2005-2006 breakout (+17.9% and +41.1% excess) and the 2024 finish (+19.9% excess) provided the biggest gains, while stretches like 2019 (-17.7% excess) were the biggest drags.
Currency Note
Returns are in Korean Won. The KRW depreciated from roughly 1,100/USD in 2005 to roughly 1,400/USD in 2024. That's about 25-27% total depreciation over 19 years, or roughly 1.4% annual drag for a USD-based investor.
A rough currency adjustment:
| Metric | KSC (KRW) | KSC (est. USD) | KOSPI (KRW) |
|---|---|---|---|
| CAGR | 5.07% | ~3.7% | 4.44% |
| Excess CAGR | +0.63% | ~+0.6% | - |
The KRW depreciation adds roughly 1.4% annual drag for USD-based investors. For a KRW-denominated investor (domestic Korean), the 5.07% CAGR stands as reported and edges ahead of the KOSPI.
Limitations
Currency context. Returns and benchmark are both in KRW, making the local comparison clean. For USD-based investors, the 1-1.5% annual KRW currency drag is material.
Cash years. Six of 25 years were cash. The strategy didn't invest until data coverage improved. All performance metrics include these dead periods.
Survivorship bias. Exchange membership uses current KSC company profiles, not historical. Companies that delisted or were restructured aren't captured.
Win rate. 48% annual win rate is close to even. Performance is streaky, with strong years like 2024 (+19.9% excess) offset by deep drawdowns like 2019 (-17.7% excess).
Concentration risk. Korea's market is dominated by a handful of sectors (semiconductors, autos, shipbuilding, steel). The screen concentrates in these same sectors. A sector-specific downturn (like 2018-2019 semis) hits the portfolio hard.
Geopolitical risk. North Korea risk, trade tensions with Japan and China, and regulatory changes in chaebol governance all affect Korean equities. These risks aren't captured in a DCF model.
No local taxes or fees. Korean securities transaction tax (0.23%) and capital gains tax for foreign investors aren't modeled.
Takeaway
Buying Korean stocks below DCF fair value produced 5.07% CAGR over 25 years, turning $10,000 into $34,393 vs $29,605 for the KOSPI. The strategy edged ahead of the benchmark by +0.63% annually in Won terms, with a similar max drawdown (-43.32% vs -40.03%).
The Korea discount gave the screen a structural tailwind. Stocks that are already cheap due to governance and conglomerate structure become deeply cheap on a cash flow basis. The 2005-2006 breakout (+58%, +47%) and the 2024 finish (+11.0% vs KOSPI's -9.0%) show what happens when that compression releases. The 2019 drawdown (-38.4%) shows what it costs to wait.
The 48% win rate is a coin flip. The small +0.63% annual edge is real but modest. The Korea discount is hard to capture through a simple DCF screen on the KSC. The strategy delivers slightly better risk-adjusted returns than the KOSPI (Sharpe 0.083 vs 0.046), but the edge is thin.
Part of a Series
This analysis is part of our DCF Discount global exchange comparison:
- DCF Discount on US Stocks (NYSE + NASDAQ + AMEX)
- DCF Discount on Indian Stocks (BSE + NSE)
- DCF Discount on Taiwan Stocks (TAI + TWO)
- DCF Discount on Canadian Stocks (TSX)
- DCF Discount on Korean Stocks (KSC)
- DCF Discount on German Stocks (XETRA)
- DCF Discount on Brazilian Stocks (SAO)
- DCF Discount on Australian Stocks (ASX)
- DCF Discount on Swedish Stocks (STO)
- DCF Discount: Global Exchange Comparison
Run This Screen Yourself
All metrics used in this analysis (FCF, market cap, exchange) are queryable via SQL on Ceta Research. Filter by exchange (KSC) and see what passes today.
The full backtest code (Python + DuckDB) is available in our GitHub repository.
Data: Ceta Research, FMP financial data warehouse. Universe: KSC. Annual rebalance (April), equal weight, 2000-2025. Returns in KRW unless noted. DCF computed via Gordon Growth Model (g=2.5%, r=10%, multiple=13.67x).


