DCF Discount in India: 11.70% CAGR Over 25 Years, Matching the Sensex With Higher Volatility
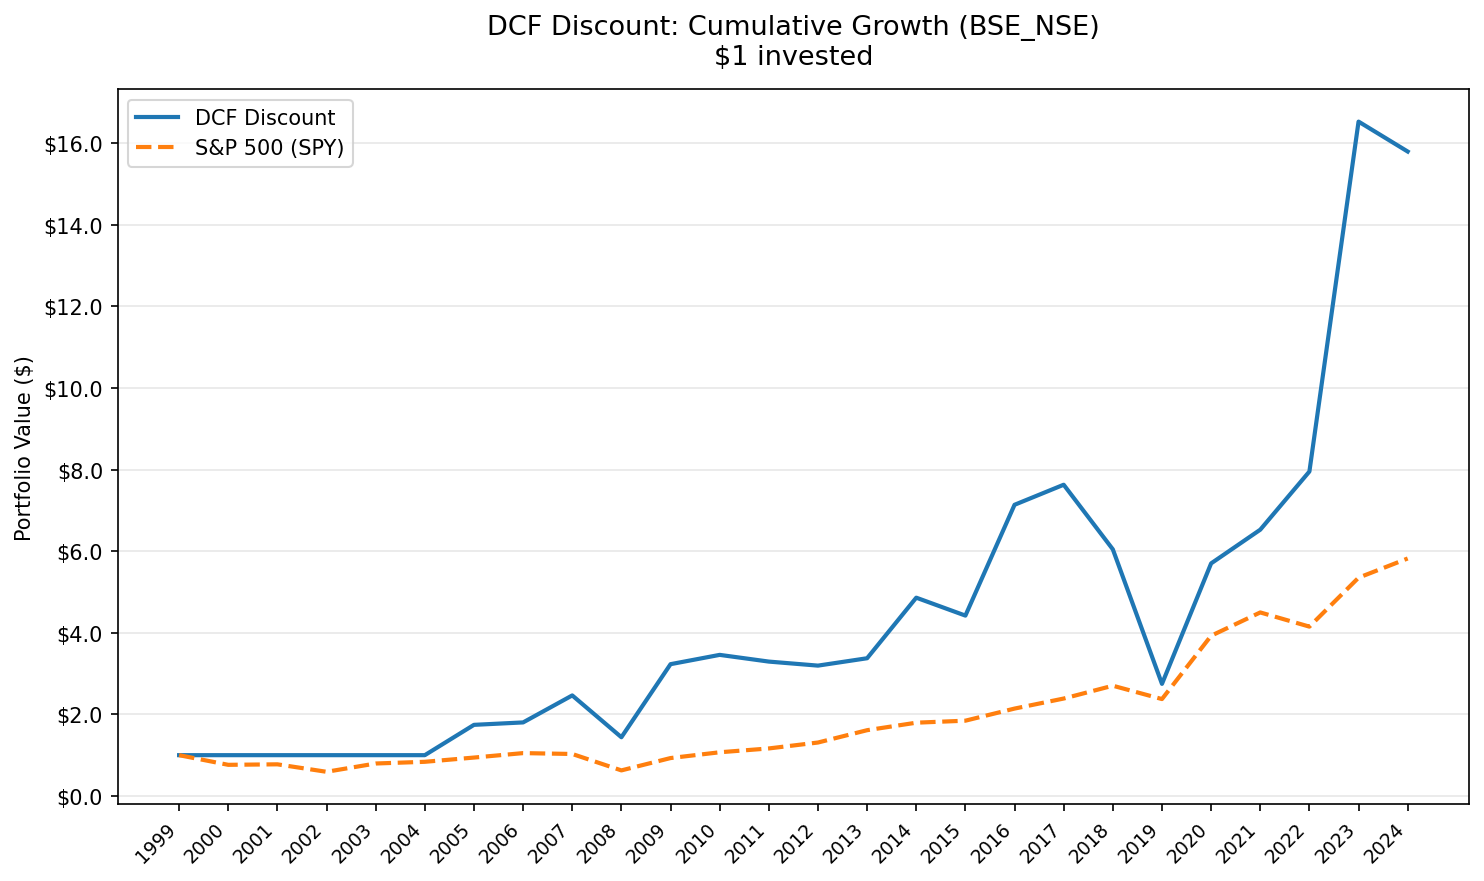
India's DCF Discount strategy returned 11.70% CAGR over 25 years, barely edging out the Sensex at 11.49%. The alpha is essentially zero. The catch: a -64% max drawdown vs the Sensex's -38%. Here is the full data.


India's DCF Discount strategy returned 11.70% CAGR over 25 years. The BSE Sensex returned 11.49%. That's +0.21% annual excess. The alpha is essentially zero.
Contents
- Method
- The Screen
- What We Found
- Year-by-Year
- Key Observations
- 2000-2004: Cash periods (missed the Sensex rally)
- 2005: Matching the Sensex (+75.3% vs +75.1%)
- 2007: Outperformance (+38.1% vs +26.5%)
- 2008: Global financial crisis (-39.3% vs -34.3%)
- 2009: The best relative year (+116.6% vs +73.3%)
- 2014: Modi election (+42.0% vs +26.4%)
- 2018-2019: The IL&FS crisis and NBFC collapse (-20.3%, -54.9%)
- 2020-2023: The recovery run (+108%, +19%, +18%, +108%)
- 2024: Pullback (-8.6% vs +3.7%)
- Currency Note
- Limitations
- Takeaway
- Part of a Series
- Run This Screen Yourself
Compared to the S&P 500, India looked like a strong outperformer. Compared to its own local benchmark, the strategy roughly matched the market while carrying far more risk. The Sensex's max drawdown was -38.31%. The DCF portfolio's was -64.07%. The Sensex's Sharpe ratio was 0.152. The portfolio's was 0.118. You took nearly twice the drawdown risk for the same return.
Method
This is a regional extension of our US flagship DCF Discount backtest. Full methodology, model assumptions, and limitations are covered there.
Signal: FCF/MarketCap >= 8.78%, equivalent to a 20% discount to intrinsic value via Gordon Growth Model (g=2.5%, r=10%, multiple=13.67x). Universe: BSE + NSE combined (Bombay Stock Exchange + National Stock Exchange of India). Market cap > ₹20B (~$240M USD). Period: 2000-2025 (25 years, annual rebalancing in April). Portfolio: Top 50 by FCF yield, equal weight. Cash if fewer than 10 qualify. Costs: Size-tiered transaction costs applied (0.1% for >$10B, 0.3% for $2-10B, 0.5% for <$2B). Point-in-time: 45-day filing lag. 18-month staleness filter. Benchmark: BSE Sensex (local benchmark). SPY comparison is available in the global exchange comparison. Execution: Next-day close (MOC). Signal generated at rebalance date, executed at the following trading day's close. Data: Ceta Research (FMP financial data warehouse).
The Screen
WITH fcf_data AS (
    SELECT symbol, freeCashFlow,
        CAST(date AS DATE) AS filing_date,
        ROW_NUMBER() OVER (
            PARTITION BY symbol ORDER BY CAST(date AS DATE) DESC
        ) AS rn
    FROM cash_flow_statement
    WHERE period = 'FY'
      AND freeCashFlow > 0
      AND CAST(date AS DATE) <= CURRENT_DATE - INTERVAL '45' DAY
      AND CAST(date AS DATE) >= CURRENT_DATE - INTERVAL '540' DAY
),
mktcap_data AS (
    SELECT symbol, marketCap,
        ROW_NUMBER() OVER (
            PARTITION BY symbol ORDER BY CAST(date AS DATE) DESC
        ) AS rn
    FROM key_metrics
    WHERE period = 'FY'
      AND marketCap > 0
      AND CAST(date AS DATE) <= CURRENT_DATE - INTERVAL '45' DAY
      AND CAST(date AS DATE) >= CURRENT_DATE - INTERVAL '540' DAY
)
SELECT
    f.symbol,
    p.companyName,
    p.exchange,
    ROUND(f.freeCashFlow / 1e6, 0) AS fcf_mm,
    ROUND(m.marketCap / 1e9, 2) AS mktcap_bn,
    ROUND(f.freeCashFlow / m.marketCap * 100, 2) AS fcf_yield_pct,
    ROUND(f.freeCashFlow * 13.67 / m.marketCap * 100, 1) AS dcf_vs_price_pct
FROM fcf_data f
JOIN mktcap_data m ON f.symbol = m.symbol AND m.rn = 1
JOIN profile p ON f.symbol = p.symbol
WHERE f.rn = 1
  AND m.marketCap > 20000000000
  AND f.freeCashFlow / m.marketCap >= 0.0878
  AND p.exchange IN ('BSE', 'NSE')
QUALIFY ROW_NUMBER() OVER (PARTITION BY f.symbol
    ORDER BY f.freeCashFlow / m.marketCap DESC) = 1
ORDER BY fcf_yield_pct DESC
LIMIT 50
Run this screen on Ceta Research →
The 8.78% FCF yield threshold is the equivalent of a 20% DCF discount when using the Gordon Growth Model at g=2.5%, r=10%. Stocks with higher FCF yield relative to market cap are trading further below computed intrinsic value.
What We Found
Against the Sensex, the excess return is negligible. The portfolio's 11.70% CAGR barely edges out the benchmark's 11.49%. On every risk-adjusted metric, the Sensex wins: better Sharpe (0.152 vs 0.118), better Sortino (0.342 vs 0.297), better Calmar (0.300 vs 0.183). You can get the same return by buying an index fund with half the drawdown.
| Metric | DCF Discount India | BSE Sensex |
|---|---|---|
| CAGR | 11.70% | 11.49% |
| Total Return | 1,489% | 1,416% |
| Excess CAGR | +0.21% | -- |
| Max Drawdown | -64.07% | -38.31% |
| Annualized Volatility | 44.06% | 32.73% |
| Sharpe Ratio | 0.118 | 0.152 |
| Sortino Ratio | 0.297 | 0.342 |
| Calmar Ratio | 0.183 | 0.300 |
| Win Rate (years > Sensex) | 52% | -- |
| Beta vs Sensex | 0.956 | 1.0 |
| Alpha (annualized) | +0.43% | -- |
| Information Ratio | 0.105 | -- |
| Tracking Error | 31.07% | -- |
| Up Capture | 108.21% | -- |
| Down Capture | 70.44% | -- |
| Cash Periods | 5 of 25 | -- |
| Avg Stocks When Invested | 41.6 | -- |
The up/down capture ratio is asymmetric (108% up, 70% down), which normally signals value. But with a tracking error above 31%, the portfolio takes wild swings around the benchmark. The Information Ratio of 0.105 confirms: the tiny excess return isn't compensating for the deviation from the index.
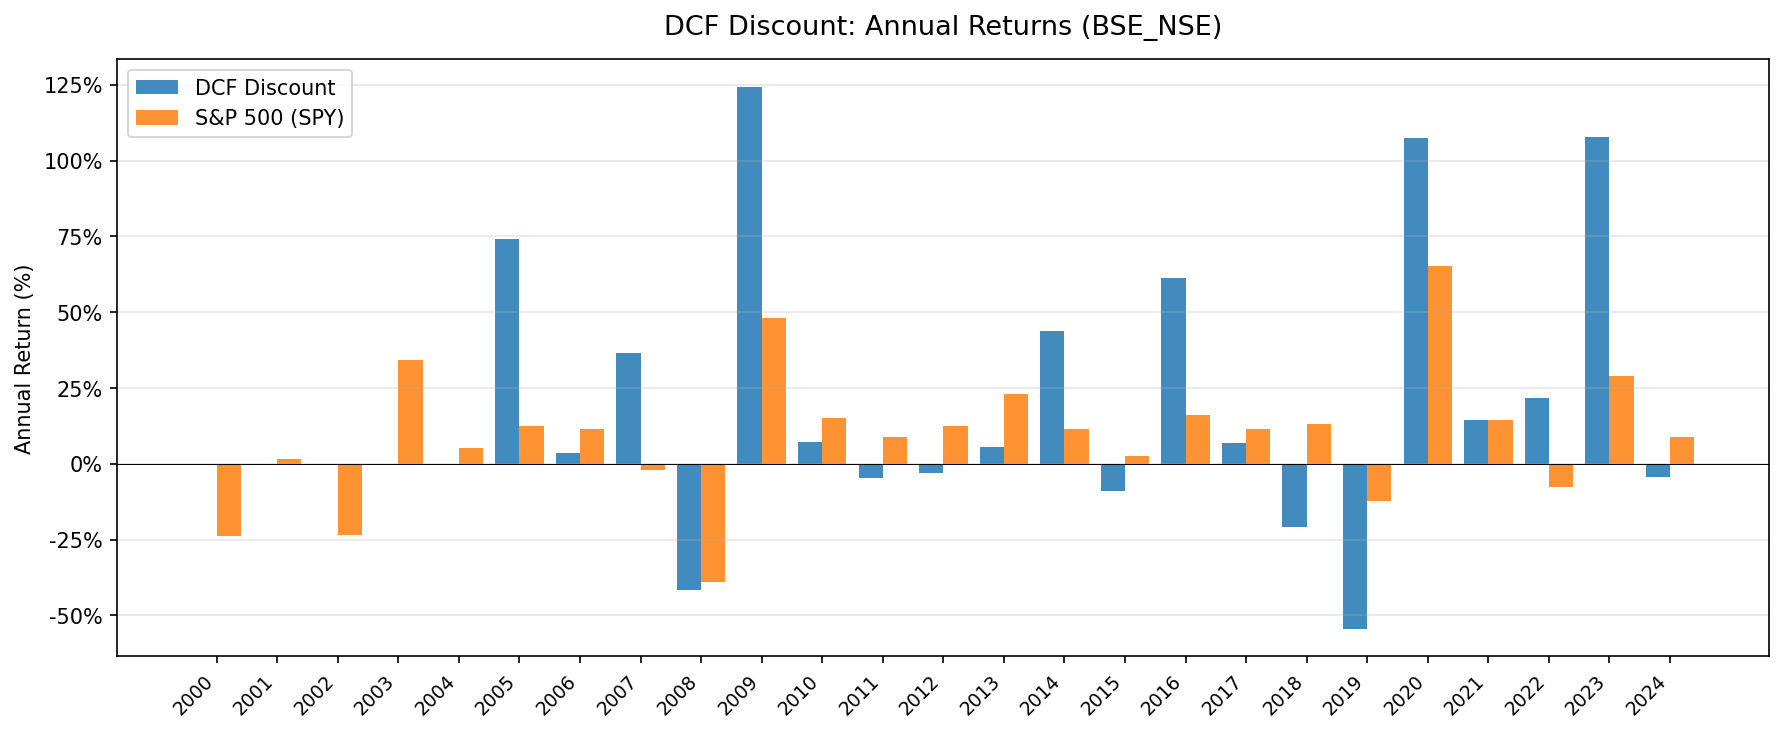
Year-by-Year
The annual return pattern is wild. The distribution is fat-tailed in both directions, with years above +100% and years below -40%.
| Year | DCF India | Sensex | Excess |
|---|---|---|---|
| 2000 | +0.0% (cash) | -29.4% | +29.4% |
| 2001 | +0.0% (cash) | -1.7% | +1.7% |
| 2002 | +0.0% (cash) | -11.1% | +11.1% |
| 2003 | +0.0% (cash) | +85.7% | -85.7% |
| 2004 | +0.0% (cash) | +14.1% | -14.1% |
| 2005 | +75.3% | +75.1% | +0.2% |
| 2006 | +3.4% | +7.7% | -4.3% |
| 2007 | +38.1% | +26.5% | +11.7% |
| 2008 | -39.3% | -34.3% | -5.0% |
| 2009 | +116.6% | +73.3% | +43.3% |
| 2010 | +7.4% | +9.9% | -2.5% |
| 2011 | -6.0% | -11.3% | +5.3% |
| 2012 | -1.8% | +8.9% | -10.7% |
| 2013 | +7.1% | +18.4% | -11.4% |
| 2014 | +42.0% | +26.4% | +15.6% |
| 2015 | -9.3% | -10.9% | +1.6% |
| 2016 | +60.9% | +17.8% | +43.2% |
| 2017 | +10.3% | +11.2% | -0.9% |
| 2018 | -20.3% | +17.4% | -37.7% |
| 2019 | -54.9% | -29.4% | -25.6% |
| 2020 | +107.5% | +78.2% | +29.3% |
| 2021 | +19.2% | +23.3% | -4.1% |
| 2022 | +17.7% | -2.5% | +20.1% |
| 2023 | +108.4% | +25.0% | +83.4% |
| 2024 | -8.6% | +3.7% | -12.2% |
Key Observations
2000-2004: Cash periods (missed the Sensex rally)
The portfolio held cash for the first five years. There weren't enough Indian large-caps (₹20B+ market cap) with positive free cash flow data on BSE and NSE to form a portfolio of 10 stocks. India's market was smaller in 2000. Fewer companies met the size threshold, and FMP's coverage of Indian filings that far back is thinner. This is a real data constraint, not a model artifact.
The Sensex returned +85.7% in 2003 alone. The portfolio sat in cash and missed it entirely. That -85.7% excess in a single year is the worst relative performance of any year in the backtest.
2005: Matching the Sensex (+75.3% vs +75.1%)
Once data coverage kicked in, India's DCF discount screen loaded into deeply discounted names. Infrastructure spending accelerated. IT outsourcing boomed (Infosys, TCS, Wipro). The BSE Sensex rose sharply. Our portfolio captured the rally with a 75.3% return, almost exactly matching the Sensex. Against SPY, this looked like massive alpha. Against the local benchmark, it was just riding the same wave.
2007: Outperformance (+38.1% vs +26.5%)
Infrastructure spending continued. Consumer lending expanded. The Indian middle class grew rapidly. The portfolio beat the Sensex by 11.7 percentage points, one of the better years for the strategy relative to its local benchmark.
2008: Global financial crisis (-39.3% vs -34.3%)
India fell harder than the Sensex (-39.3% vs -34.3%). The portfolio's deeper loss of 5 percentage points shows the FCF screen didn't provide downside protection against the local market. Foreign institutional investors pulled money from Indian equities at record pace, and value stocks were hit harder than blue-chip Sensex components.
2009: The best relative year (+116.6% vs +73.3%)
The Sensex rallied +73.3%. The portfolio returned +116.6%, a +43.3% excess. This is the strongest single year of alpha vs the Sensex in the entire backtest. Companies with real free cash flow saw their valuations normalize fast after the 2008 crash.
2014: Modi election (+42.0% vs +26.4%)
Narendra Modi's election in May 2014 triggered a sharp re-rating of Indian equities. Markets priced in infrastructure investment, deregulation, and corporate governance reforms. Our portfolio returned +42.0%, beating the Sensex by 15.6 percentage points. Value stocks with strong cash flows were the primary beneficiaries of the sentiment shift.
2018-2019: The IL&FS crisis and NBFC collapse (-20.3%, -54.9%)
The worst two-year stretch in the backtest. In 2018, Infrastructure Leasing & Financial Services (IL&FS) defaulted, triggering a crisis across India's non-banking financial companies (NBFCs). Credit froze. Mid-cap and small-cap stocks collapsed.
Here the Sensex comparison is damning. In 2018, the Sensex returned +17.4% while the portfolio lost -20.3%. That's a -37.7% gap in a single year. The damage continued through 2019 as both fell, but the portfolio (-54.9%) dropped far harder than the Sensex (-29.4%).
This period drove the -64.07% max drawdown.
2020-2023: The recovery run (+108%, +19%, +18%, +108%)
Four consecutive years of positive returns, including two years above 100%. COVID crashed markets in early 2020, but the recovery was swift. The portfolio beat the Sensex in 2020 (+29.3% excess) and 2022 (+20.1% excess), but trailed in 2021 (-4.1%). The +108.4% return in 2023 was the standout, beating the Sensex by 83.4 percentage points as mid-cap value stocks re-rated while India became a preferred emerging market destination for global capital.
2024: Pullback (-8.6% vs +3.7%)
After the massive 2023 rally, Indian value stocks gave back some ground while the Sensex posted modest gains. Foreign investors rotated out of India into cheaper emerging markets. Elevated valuations after the 2023 run meant fewer stocks qualified for the DCF discount screen.
Currency Note
Both returns and benchmark are in Indian Rupees (INR). Because the Sensex is an INR-denominated index, currency effects cancel out in the comparison. The +0.21% excess return is a like-for-like measure.
For a USD-based investor, the INR depreciated from roughly 46 per USD in 2000 to 84 per USD in 2024. That's roughly 2.5% annual drag. Both the portfolio and the Sensex would be reduced by the same amount in USD terms. The relative picture doesn't change.
Limitations
No risk-adjusted edge. The Sensex beats the portfolio on Sharpe (0.152 vs 0.118), Sortino (0.342 vs 0.297), and Calmar (0.300 vs 0.183). On every risk-adjusted metric, you're better off in the index.
Extreme volatility. 44.06% annualized volatility vs the Sensex's 32.73%. The max drawdown of -64.07% is nearly twice the Sensex's -38.31%. This strategy demands high risk tolerance for no additional return.
Massive tracking error. At 31.07%, the portfolio swings wildly around the benchmark. Year-to-year excess returns range from -85.7% to +83.4%. The Information Ratio of 0.105 means the tiny excess return doesn't justify the deviation.
Early data gaps. FMP coverage of Indian financial statements before 2005 is thinner than post-2010. The 2000-2004 cash periods and the first few invested years carry higher data uncertainty. The strategy effectively starts in 2005, meaning the early invested years fall right at the beginning of the active period. Missing the Sensex's +85.7% rally in 2003 while sitting in cash significantly depressed the portfolio's relative performance.
Survivorship risk in Indian mid-caps. Indian stocks below $5B market cap have higher delisting and restructuring rates than US equivalents. While our ₹20B floor mitigates this, some historical positions may have been affected by corporate actions not fully captured in the data.
Takeaway
Over 25 years, buying Indian stocks trading below computed DCF fair value produced 11.70% CAGR vs 11.49% for the BSE Sensex. That's +0.21% annual excess. The alpha is essentially zero.
The strategy matched the market while carrying nearly twice the drawdown risk (-64% vs -38%). On every risk-adjusted metric, the Sensex wins. This isn't a bad strategy in absolute terms. 11.70% CAGR is a solid return. But you can get the same result from a Sensex index fund with far less volatility.
The DCF discount screen on its own isn't enough for India. Combined with other signals (P/E, Piotroski, debt screens), it can still serve as a useful filter for identifying potential value. As a standalone strategy, the data says just buy the index.
Part of a Series
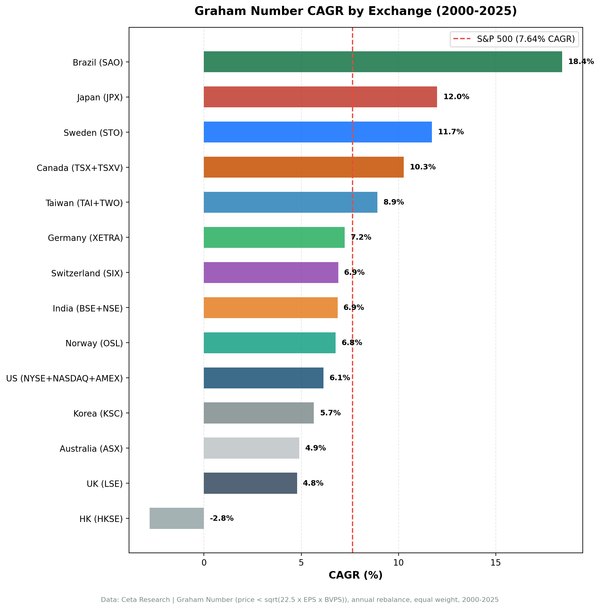
This analysis is part of our DCF Discount global exchange comparison:
- DCF Discount on US Stocks (NYSE + NASDAQ + AMEX)
- DCF Discount on Indian Stocks (BSE + NSE)
- DCF Discount on Taiwan Stocks (TAI + TWO)
- DCF Discount on Canadian Stocks (TSX)
- DCF Discount on Korean Stocks (KSC)
- DCF Discount on German Stocks (XETRA)
- DCF Discount on Brazilian Stocks (SAO)
- DCF Discount on Australian Stocks (ASX)
- DCF Discount on Swedish Stocks (STO)
- DCF Discount: Global Exchange Comparison
Run This Screen Yourself
Query Indian stocks trading below DCF fair value on Ceta Research Data Explorer. Filter by exchange IN ('BSE', 'NSE'), set FCF yield >= 8.78%, and sort by yield descending. The screen updates daily with the latest filings.
Data: Ceta Research (FMP financial data warehouse), BSE+NSE, 2000-2025. Returns in INR. Benchmark: BSE Sensex. MOC execution (next-day close). Annual rebalancing (April), size-tiered transaction costs, 45-day filing lag, 18-month staleness filter. Full methodology: METHODOLOGY.md