
DCF Discount Across 16 Exchanges: Where Does Buying Below Intrinsic Value Actually Work?


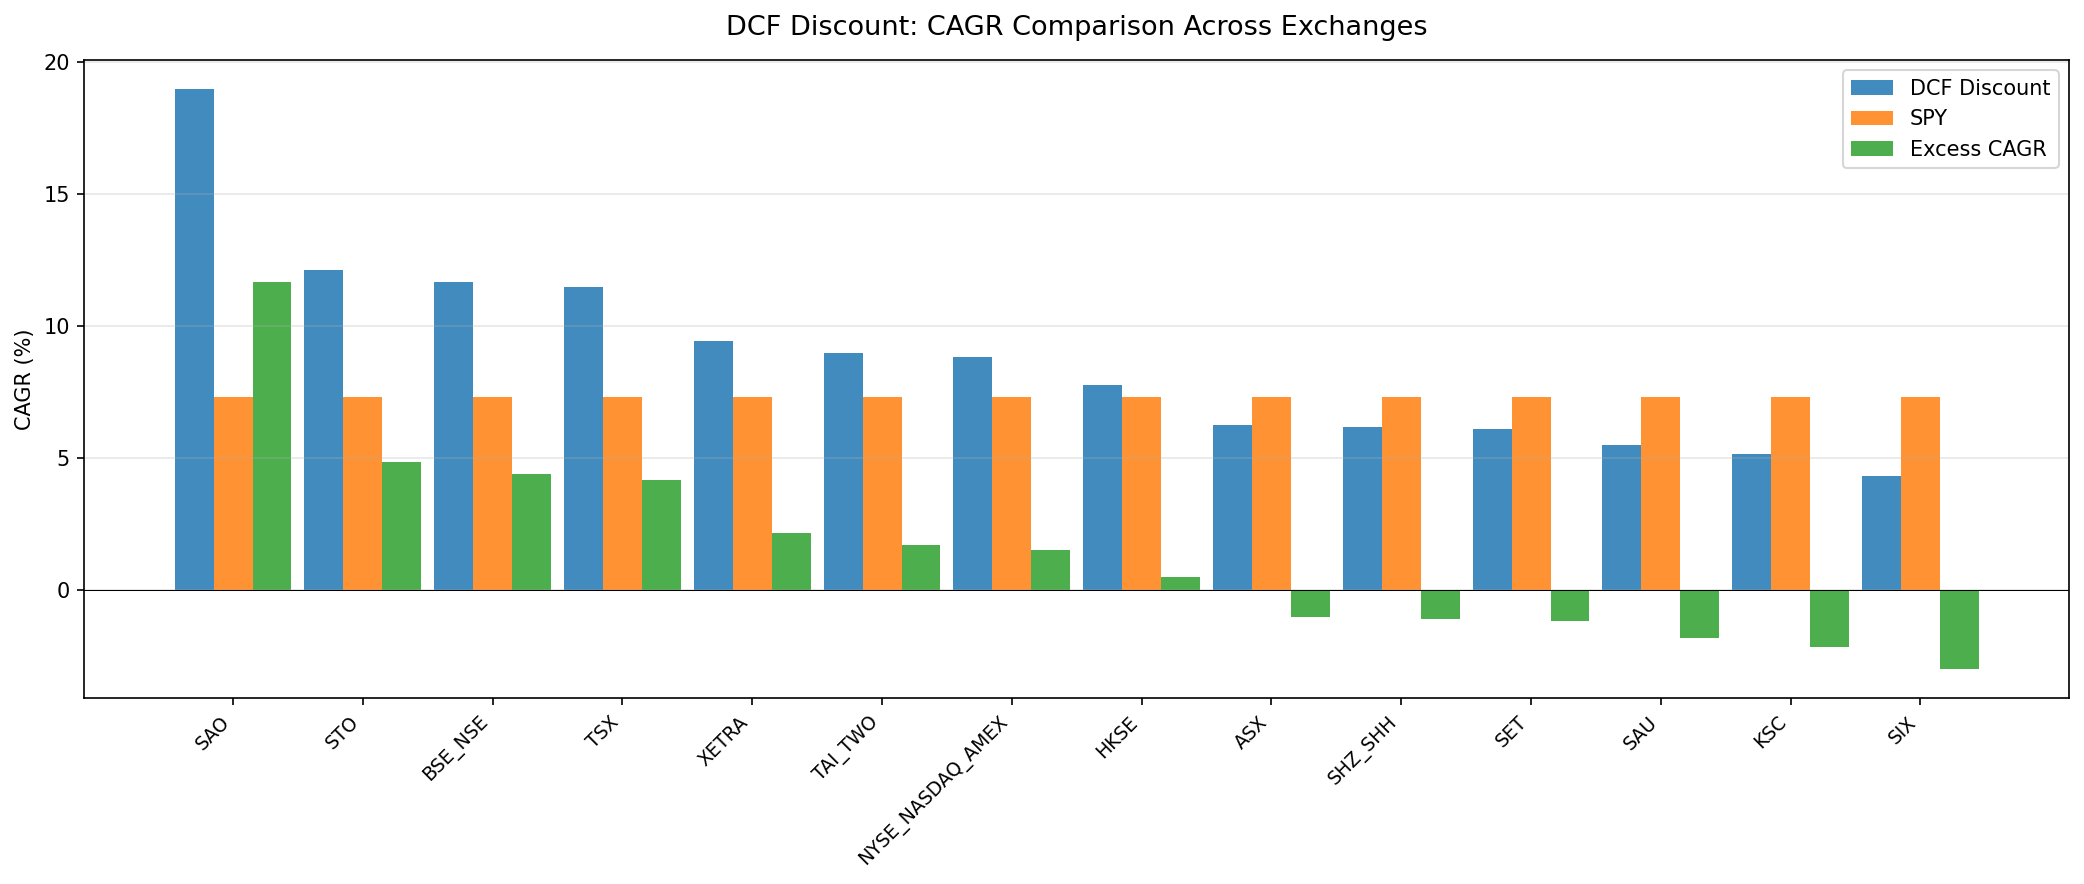
We ran the same DCF discount strategy across 16 global exchanges. Same signal, same model, same transaction costs, same 25-year window, but with per-exchange local currency market cap thresholds. Each exchange is benchmarked against its local index. Brazil topped the list at 18.05% CAGR (+9.47% excess vs Bovespa). Korea sat at the bottom with 5.07% CAGR, barely ahead of the KOSPI. The range between them, 13 percentage points of annualized return, tells us something the US-only result never could: the market you apply this signal to matters more than the signal itself.
Contents
- Method
- The Full Results
- Winners and Losers
- Risk vs Return
- Currency Effects
- Where It Doesn't Work
- Patterns
- Data Gaps
- Limitations
- Takeaway
- Read the Full Analysis
Using local benchmarks instead of SPY changes the picture dramatically. Markets that looked like failures against SPY (Korea, China, Australia) actually beat their local indices. Markets that looked like strong alpha generators against SPY (India) actually just matched their own market.
Method
Signal: FCF/MarketCap >= 8.78% (equivalent to a 20%+ discount to DCF fair value via Gordon Growth Model: g=2.5%, r=10%, multiple=13.67x) Portfolio: Top 50 by FCF yield, equal weight, annual rebalance (April) Universe: Per-exchange local currency market cap thresholds (~$200-545M USD equivalent), positive FCF, per-exchange Period: 2000-2025 (25 years) Benchmark: Local index per exchange (Sensex, Bovespa, TAIEX, etc.). Exchanges without a local index benchmark use S&P 500. Execution: Next-day close (MOC). Signal generated at rebalance date, executed at the following trading day's close. Costs: Size-tiered transaction costs (0.1% for >$10B, 0.3% for $2-10B, 0.5% for <$2B) Point-in-time: 45-day filing lag, 18-month staleness filter
Full methodology is covered in the US flagship post.
The Full Results
| Exchange | CAGR | Benchmark | Bench CAGR | Excess | Sharpe | Max DD | Cash% | Avg Stocks |
|---|---|---|---|---|---|---|---|---|
| Brazil (SAO) | 18.05% | Bovespa | 8.58% | +9.47% | 0.263 | -24.87% | 8% | 36.2 |
| Sweden (STO) | 12.04% | S&P 500 | 7.33% | +4.71% | 0.399 | -42.76% | 16% | 23.7 |
| India (BSE+NSE) | 11.70% | Sensex | 11.49% | +0.21% | 0.118 | -64.07% | 20% | 41.6 |
| Canada (TSX) | 11.49% | TSX Comp | 4.05% | +7.43% | 0.375 | -30.12% | 0% | 37.7 |
| Germany (XETRA) | 9.28% | DAX | 4.51% | +4.76% | 0.265 | -47.67% | 0% | 33.2 |
| Taiwan (TAI+TWO) | 9.15% | TAIEX | 3.05% | +6.10% | 0.398 | -36.80% | 20% | 44.4 |
| Hong Kong (HKSE) | 9.07% | Hang Seng | 1.28% | +7.79% | 0.213 | -45.74% | 0% | 26.5 |
| US (NYSE+NASDAQ+AMEX) | 8.59% | S&P 500 | 7.33% | +1.26% | 0.229 | -55.75% | 0% | 35.3 |
| UK (LSE) | 7.85% | FTSE 100 | 1.15% | +6.69% | 0.159 | -40.47% | 4% | 27.5 |
| Switzerland (SIX) | 6.82% | S&P 500 | 7.33% | -0.51% | 0.235 | -50.43% | 0% | 25.3 |
| Japan (JPX) | 6.27% | Nikkei 225 | 2.20% | +4.07% | 0.233 | -42.93% | 4% | 36.2 |
| Australia (ASX) | 6.08% | ASX 200 | 3.67% | +2.41% | 0.108 | -62.36% | 4% | 20.3 |
| Thailand (SET) | 6.04% | S&P 500 | 7.33% | -1.29% | 0.131 | -44.76% | 16% | 36.0 |
| Saudi (SAU) | 5.84% | S&P 500 | 7.33% | -1.48% | 0.105 | -38.80% | 28% | 25.4 |
| China (SHZ+SHH) | 5.39% | SSE Comp | 2.51% | +2.87% | 0.079 | -49.77% | 0% | 32.7 |
| Korea (KSC) | 5.07% | KOSPI | 4.44% | +0.63% | 0.083 | -43.32% | 24% | 41.6 |
Twelve of 16 exchanges produced positive excess returns vs their local benchmark. Three trailed (Switzerland, Thailand, Saudi). India and Korea technically posted positive excess but at +0.21% and +0.63%, those numbers are effectively zero.
The shift from SPY to local benchmarks changed the picture for several markets. Australia, China, and Korea all looked like failures against SPY but beat their local indices. India looked like a strong alpha generator against SPY (+4.37% when benchmarked to the old SPY number) but is flat against the Sensex.
Winners and Losers
Brazil: the raw CAGR leader. 18.05% CAGR, +9.47% excess vs Bovespa. The best max drawdown of any market at -24.87%, shallower than most local benchmarks. The SAO exchange is heavy on financials, utilities, and materials. Companies generating substantial free cash flow relative to market cap, exactly what the screen looks for. Even against a strong local benchmark (Bovespa returned 8.58%), Brazil's excess return is massive.
Canada: quietly strong. 11.49% CAGR, +7.43% excess vs TSX Composite. Zero cash periods, a 0.375 Sharpe, and -30.12% max drawdown. The TSX Composite returned only 4.05% over the period, making Canada one of the widest excess return markets on a local benchmark basis.
Hong Kong: the surprise. 9.07% CAGR, +7.79% excess vs Hang Seng. The Hang Seng returned just 1.28% CAGR over 25 years. Hong Kong's weak market makes even modest portfolio returns look excellent by comparison. The alpha here is partly a function of a terrible benchmark.
India: alpha disappeared. 11.70% CAGR looks strong in isolation. Against the Sensex (11.49% CAGR), the excess is +0.21%. The strategy matched the Indian market while carrying a -64.07% max drawdown vs the Sensex's -38.31%. On risk-adjusted terms, you're better off in a Sensex index fund.
Sweden: the balanced outperformer. 12.04% CAGR with a 0.399 Sharpe, the best risk-adjusted performance of any market. Sweden's mid-cap industrial ecosystem, companies like Atlas Copco, Sandvik, and Assa Abloy, produces steady free cash flow at reasonable valuations. This is the developed-market sweet spot for the strategy.
UK and Japan: new additions. The UK returned 7.85% vs the FTSE 100's 1.15% (+6.69% excess). Japan returned 6.27% vs the Nikkei's 2.20% (+4.07% excess). Both markets have weak local benchmarks over this period, which flatters the strategy's excess return. These were previously excluded due to data gaps.
Risk vs Return
Raw CAGR rankings and risk-adjusted rankings tell different stories. The markets that look best on a Sharpe basis aren't the same ones that top the CAGR table.
Best Sharpe ratios: 1. Sweden: 0.399 2. Taiwan: 0.398 3. Canada: 0.375 4. Germany: 0.265 5. Brazil: 0.263
Sweden generated 12.04% CAGR with a -42.76% max drawdown. Taiwan returned 9.15% with a -36.80% max drawdown. Both are better risk-adjusted bets than Brazil or India despite different absolute returns.
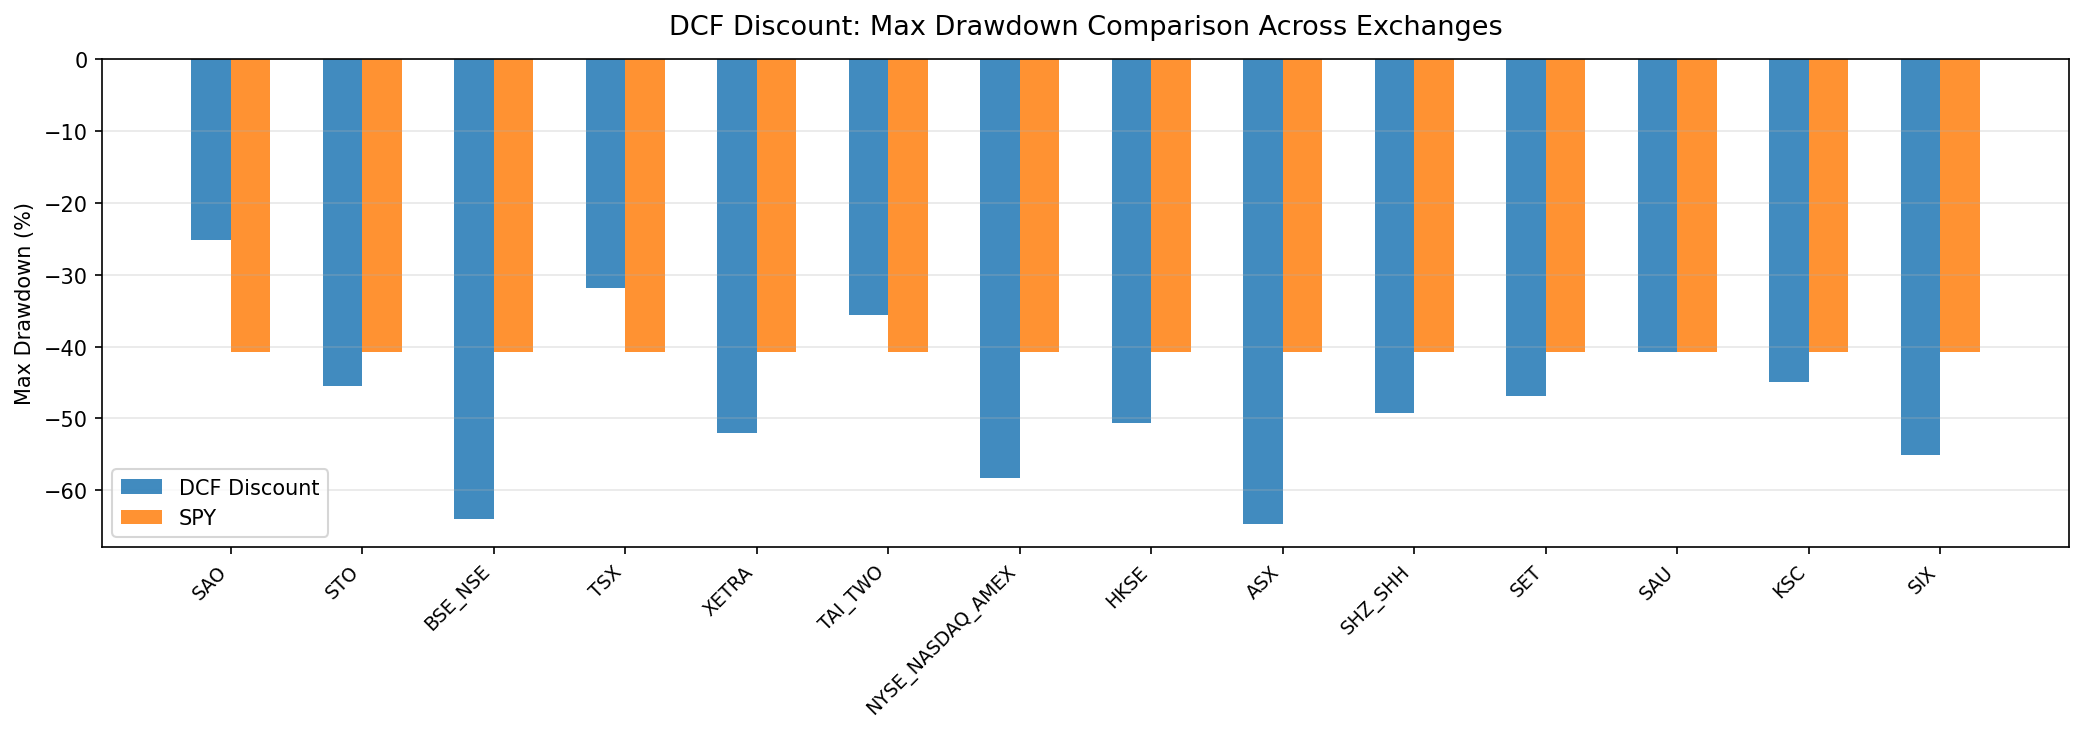
Drawdown vs excess return. The shallowest drawdowns came from Brazil (-24.87%), Canada (-30.12%), and Taiwan (-36.80%). All three also generated significant excess returns vs their local benchmarks. India (-64.07%) and Australia (-62.36%) had the deepest drawdowns. India's drawdown is particularly damning because the excess return is near zero.
| Exchange | Max DD | Bench Max DD | Excess CAGR |
|---|---|---|---|
| Brazil | -24.87% | (Bovespa) | +9.47% |
| Canada | -30.12% | (TSX Comp) | +7.43% |
| Taiwan | -36.80% | (TAIEX) | +6.10% |
| Saudi | -38.80% | (SPY) | -1.48% |
| UK | -40.47% | (FTSE 100) | +6.69% |
| Sweden | -42.76% | (SPY) | +4.71% |
| Japan | -42.93% | (Nikkei) | +4.07% |
| Korea | -43.32% | (KOSPI) | +0.63% |
| Thailand | -44.76% | (SPY) | -1.29% |
| Hong Kong | -45.74% | (Hang Seng) | +7.79% |
| Germany | -47.67% | (DAX) | +4.76% |
| China | -49.77% | (SSE Comp) | +2.87% |
| Switzerland | -50.43% | (SPY) | -0.51% |
| US | -55.75% | (SPY) | +1.26% |
| Australia | -62.36% | (ASX 200) | +2.41% |
| India | -64.07% | (Sensex) | +0.21% |
The pattern is clear: the markets with the shallowest drawdowns tend to produce the best excess returns. Brazil, Canada, and Taiwan combine contained risk with meaningful alpha. India and Australia sit at the opposite end, deep drawdowns with minimal or no excess return.
Currency Effects
With local benchmarks, currency is less of a concern for most comparisons. When both the portfolio and benchmark are denominated in the same currency, the excess return is a clean like-for-like measure. India's +0.21% excess vs Sensex, Canada's +7.43% excess vs TSX Composite, Brazil's +9.47% excess vs Bovespa: all of these are pure equity performance, no currency noise.
Currency still matters for absolute returns from a USD investor's perspective. Brazil's 18.05% CAGR in BRL shrinks to roughly 13-14% in USD terms. India's 11.70% drops to around 9-10%. But those adjustments apply equally to the portfolio and its local benchmark, so the excess return doesn't change.
Five exchanges (Sweden, Switzerland, Thailand, Saudi, US) still use SPY as their benchmark. For these, the comparison is already in USD-equivalent terms.
Unhedged emerging market equity exposure carries embedded currency risk. The backtest doesn't account for hedging costs, which would reduce absolute returns further.
Where It Doesn't Work
Three markets produced negative excess returns vs their benchmarks. Two more are effectively flat.
Switzerland (SIX): -0.51% vs SPY. Switzerland averages only 25.3 qualifying stocks. Swiss equities are dominated by Nestle, Novartis, and Roche. Companies trading at high FCF yields in Switzerland tend to be in structural decline, not hidden value. The quality premium is already priced in by Zurich's institutional investor base. Cheap stocks are cheap for reasons the model can't see.
Thailand (SET): -1.29% vs SPY. Thailand returned 6.04% CAGR with a -44.76% max drawdown. The 16% cash rate and a thin qualifying universe limit the strategy's effectiveness. Thailand and Saudi still use SPY as benchmark because local index data wasn't available in our dataset.
Saudi (SAU): -1.48% vs SPY. Twenty-eight percent cash periods signal thin coverage. The Saudi market is still relatively young by global standards. FMP data goes deep on Aramco and a few banks, but the mid-cap universe is small. With 25.4 average stocks qualifying (versus 50 target), the portfolio was underinvested in most periods.
Effectively flat: India (+0.21%) and Korea (+0.63%). These markets produced positive excess returns on paper, but the margins are too thin to be meaningful after accounting for any real-world friction. India's result is particularly notable: what looked like +4.37% alpha vs SPY turned out to be +0.21% vs the Sensex. The Sensex returned 11.49% over the same period, meaning the strategy just rode the Indian market while taking much more risk. Korea's +0.63% vs the KOSPI is similarly negligible, with 24% of periods in cash dragging performance.
Patterns
Local benchmarks change everything. This is the single most important insight. Against SPY, India showed +4.37% excess return. Against the Sensex, it's +0.21%. Australia went from -1.05% vs SPY to +2.41% vs ASX 200. China went from -1.13% vs SPY to +2.87% vs SSE Composite. Korea went from -2.17% vs SPY to +0.63% vs KOSPI. The choice of benchmark determines whether a market looks like a winner or a loser.
Weak local benchmarks inflate the signal's edge. Hong Kong (+7.79% vs Hang Seng at 1.28% CAGR), UK (+6.69% vs FTSE 100 at 1.15%), and Japan (+4.07% vs Nikkei at 2.20%) all show large excess returns. But their benchmarks were unusually weak over this 25-year period. The strategy beat sluggish indices. That's different from generating true stock-selection alpha.
Strong local benchmarks expose the signal's limits. India (Sensex 11.49% CAGR) and the US (SPY 7.33%) have the strongest benchmarks. Against them, excess returns are thin: +0.21% and +1.26% respectively. When the index itself is strong, the DCF screen struggles to outperform.
Shallow drawdown markets produce the best excess returns. Brazil (-24.87% max DD, +9.47% excess), Canada (-30.12%, +7.43%), and Taiwan (-36.80%, +6.10%) combine the shallowest drawdowns with the largest excess returns. India (-64.07%, +0.21%) and Australia (-62.36%, +2.41%) sit at the opposite end. The strategy works best in markets where cheap-on-FCF stocks actually have less downside, not just higher volatility.
Zero-cash markets aren't necessarily better. The US, Germany, Hong Kong, China, and Switzerland all had qualifying stocks in every period (0% cash). Full investability didn't translate to better returns. Meanwhile, Korea (24% cash) and Saudi (28% cash) had the highest cash rates and the weakest results.
Data Gaps
One exchange was excluded from the analysis due to data coverage issues:
| Exchange | Reason |
|---|---|
| SGX (Singapore) | 0 profile records in data warehouse |
Japan (JPX) and the UK (LSE), previously excluded due to missing key_metrics data, now have sufficient coverage and are included in the results above. Japan returned 6.27% CAGR (+4.07% vs Nikkei 225). The UK returned 7.85% CAGR (+6.69% vs FTSE 100).
Limitations
Mixed benchmark sources. Eleven exchanges use local index benchmarks. Five (Sweden, Switzerland, Thailand, Saudi, US) still use SPY because local benchmark data wasn't available in our dataset. This makes cross-exchange comparison less clean than if all used local benchmarks.
Model sensitivity. The Gordon Growth Model uses fixed assumptions (g=2.5%, r=10%). Change the discount rate to 12% and the FCF yield threshold drops from 8.78% to 10.53%. Change it to 8% and the threshold falls to 5.71%. Every exchange's portfolio composition would shift, and the ranking could change. One model, one set of assumptions, one answer. Reality is less tidy.
Trailing FCF. The screen uses reported free cash flow, which is backward-looking. Cyclical companies at peak FCF can screen as cheap when they're actually expensive on a forward basis. This effect is stronger in resource-heavy markets (Brazil, Canada, Australia) and weaker in stable-growth markets (Switzerland, Taiwan).
25-year period bias. The 2000-2024 window includes two deep recessions and two extended growth cycles. The early-2000s value premium was unusually strong globally. A strategy tested from 2010-2025 would show weaker results in most markets due to the growth/momentum regime that dominated.
Survivorship bias. The backtest includes delisted companies, but data completeness varies by exchange. Smaller exchanges with fewer listed companies may have better survivorship in the dataset than larger ones.
Takeaway
The DCF discount signal, buying stocks trading below intrinsic value based on free cash flow yield, beats local benchmarks in 12 of 16 markets tested. The magnitude varies from +9.47% excess (Brazil vs Bovespa) to +0.21% (India vs Sensex). Three markets trail their benchmarks: Switzerland (-0.51%), Thailand (-1.29%), and Saudi Arabia (-1.48%).
The headline finding is that benchmark choice matters as much as signal design. India looked like a +4.37% alpha generator when benchmarked to SPY. Against the Sensex, that excess is +0.21%. Australia, China, and Korea all flipped from negative (vs SPY) to positive (vs local indices). The story you tell depends entirely on what you compare against.
The best opportunities: Brazil leads on raw returns and excess vs local benchmark. Sweden and Taiwan lead on risk-adjusted performance. Canada offers zero cash periods, a strong Sharpe, and +7.43% excess vs its local index.
The markets to avoid: India and Korea technically beat their local benchmarks, but by margins so thin they're not investable after real-world friction. Switzerland, Thailand, and Saudi trail their benchmarks outright.
One signal across 16 exchanges produces a 13-point range in annual returns. The exchange you apply it to, and the benchmark you measure it against, are the biggest variables in the equation.
Read the Full Analysis
We wrote dedicated posts for nine exchanges. Each one goes deeper into year-by-year returns, sector composition, and market-specific context:
- DCF Discount: US Stocks (NYSE + NASDAQ + AMEX): the flagship post with full methodology
- DCF Discount: Indian Stocks (BSE + NSE): matches Sensex, higher volatility
- DCF Discount: Taiwanese Stocks (TAI + TWO): second-best Sharpe ratio globally
- DCF Discount: Canadian Stocks (TSX): best developed-market risk/reward
- DCF Discount: Korean Stocks (KSC): the Korea discount meets DCF discount
- DCF Discount: German Stocks (XETRA): industrial value on Europe's largest exchange
- DCF Discount: Brazilian Stocks (SAO): highest CAGR, BRL currency caveat
- DCF Discount: Australian Stocks (ASX): beats ASX 200, concentrated portfolio
- DCF Discount: Swedish Stocks (STO): best European market, Nordic industrials
UK (LSE) and Japan (JPX) results are included in the table above but don't have dedicated posts yet.
Data: Ceta Research, FMP financial data warehouse. Backtest: 2000-2025, 25 annual periods, Gordon Growth Model (g=2.5%, r=10%, multiple=13.67x). 16 exchanges, per-exchange local currency market cap thresholds (~$200-545M USD equivalent), positive FCF. Returns in local currency; benchmarks: local indices where available, SPY otherwise. MOC execution (next-day close). Size-tiered transaction costs applied. Full methodology: METHODOLOGY.md


