
DCF Discount on German Stocks: 9.28% CAGR Over 25 Years of XETRA Data

We screened every German stock on XETRA for discount to intrinsic value using a Gordon Growth Model and backtested from 2000 to 2025. The strategy returned 9.28% CAGR vs 4.51% for the DAX, turning $10,000 into $91,877 vs $30,139. Germany's industrial value stocks delivered a steady +4.76% annual edge, fully invested across all 25 years with zero cash periods.
Contents
- Method
- The Screen
- What We Found
- Year-by-Year Returns
- Key Observations
- Currency Context
- Limitations
- Takeaway
- Part of a Series
Method
Full methodology is covered in the US flagship post. Short version:
Signal: FCF/MarketCap >= 8.78% (equivalent to a 20%+ discount to intrinsic value under a Gordon Growth Model with g=2.5%, r=10%, implied multiple=13.67x). Universe: XETRA (Deutsche Boerse). All listed stocks meeting the filters. Period: 2000-2025 (25 years, annual rebalancing in April). Portfolio: Top 50 by FCF yield, equal weight. Market cap floor: €500M (~$545M USD equivalent). Costs: Size-tiered transaction costs (0.1% for >$10B, 0.3% for $2-10B, 0.5% for <$2B). Point-in-time: 45-day filing lag, 18-month staleness filter. Benchmark: DAX (^GDAXI), the local German benchmark. Data: Ceta Research (FMP financial data warehouse).
The Screen
SELECT
    cfs.symbol,
    p.companyName,
    p.sector,
    ROUND(cfs.freeCashFlow / 1e6, 0) AS fcf_mm,
    ROUND(km.marketCap / 1e9, 1) AS mktcap_bn,
    ROUND(cfs.freeCashFlow / km.marketCap * 100, 2) AS fcf_yield_pct,
    ROUND((1 - km.marketCap / (cfs.freeCashFlow * 13.67)) * 100, 1) AS discount_pct
FROM cash_flow_statement cfs
JOIN key_metrics km ON cfs.symbol = km.symbol AND km.period = 'FY'
JOIN profile p ON cfs.symbol = p.symbol
WHERE cfs.period = 'FY'
    AND cfs.freeCashFlow > 0
    AND cfs.freeCashFlow / km.marketCap >= 0.0878
    AND km.marketCap > 500000000
    AND p.exchange = 'XETRA'
QUALIFY ROW_NUMBER() OVER (PARTITION BY cfs.symbol ORDER BY cfs.date DESC) = 1
ORDER BY fcf_yield_pct DESC
LIMIT 30
Run this screen live on Ceta Research
What We Found
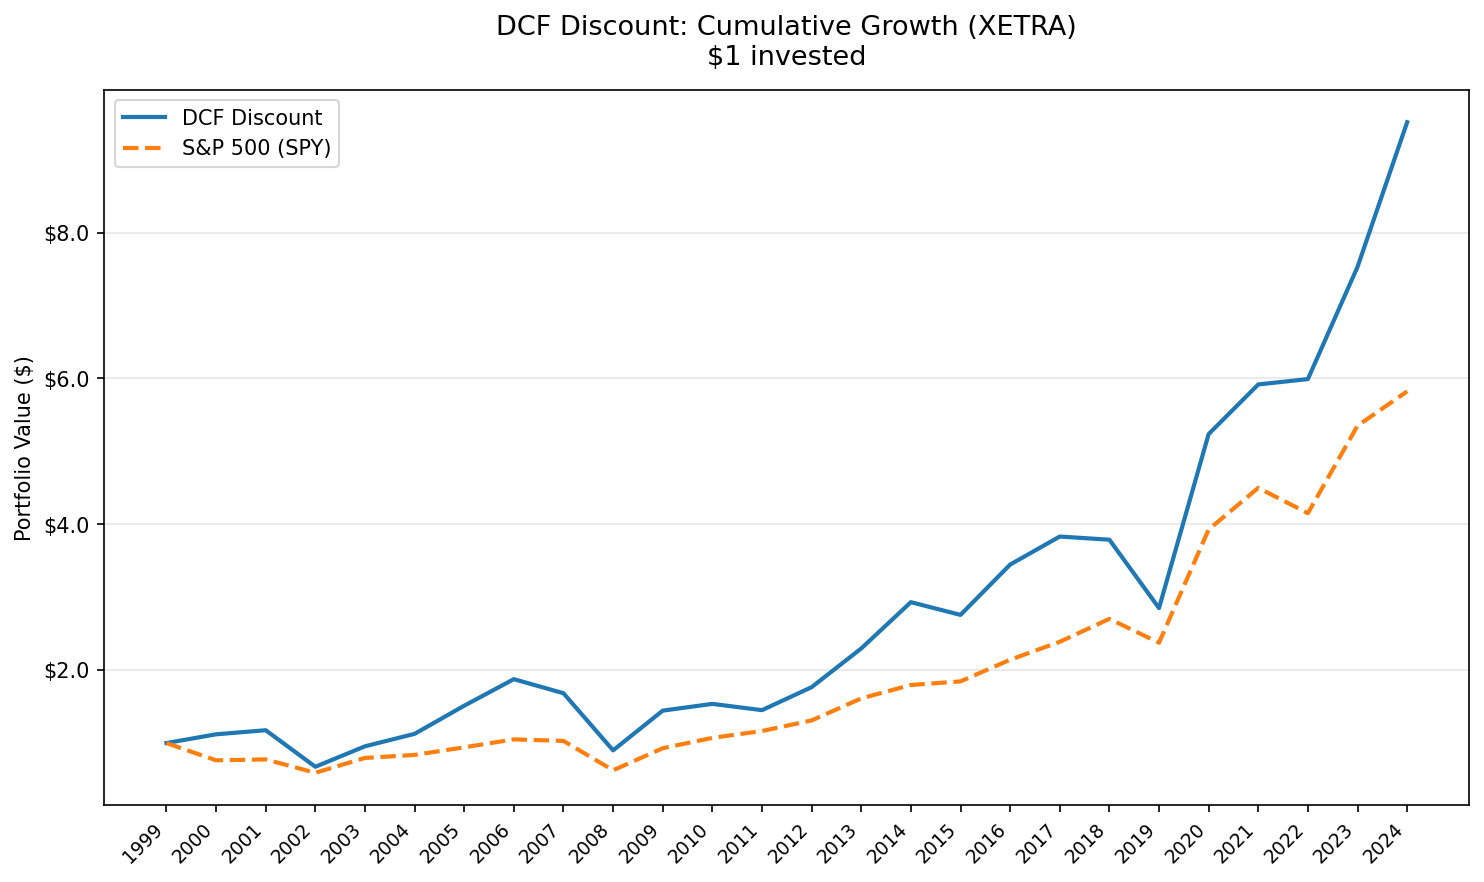
The strategy beat the DAX by 4.76% per year over 25 years. That's 838.77% cumulative vs 201.39%. The portfolio was fully invested in every single period, averaging 33.2 stocks per rebalance. Zero cash periods across 25 years means XETRA always had enough qualifying companies.
The volatility is comparable to the DAX: 26.71% vs 26.28%. Max drawdown hit -47.67% (vs -65.15% for the DAX). Beta of 0.771 against the DAX shows the portfolio is less sensitive to broad German market moves. Up capture of 120.98% grabs more of the upside, and down capture of 69.91% means it dodges roughly 30% of the DAX's losses.

Full 25-year summary:
| Metric | DCF Discount (XETRA) | DAX |
|---|---|---|
| CAGR | 9.28% | 4.51% |
| Total Return | 838.77% | 201.39% |
| Max Drawdown | -47.67% | -65.15% |
| Annualized Volatility | 26.71% | 26.28% |
| Sharpe Ratio | 0.265 | 0.096 |
| Sortino Ratio | 0.546 | 0.164 |
| Calmar Ratio | 0.195 | 0.069 |
| Win Rate vs DAX | 60% | -- |
| Beta | 0.771 | 1.0 |
| Alpha | 5.68% | -- |
| Up Capture | 120.98% | -- |
| Down Capture | 69.91% | -- |
| VaR 95% | -39.97% | -35.35% |
| Avg Stocks | 33.2 | -- |
| Cash Periods | 0/25 | -- |
| Information Ratio | 0.426 | -- |
The Sharpe ratio is nearly 3x the DAX's (0.265 vs 0.096). On a risk-adjusted basis, the extra return more than compensates for the volatility. The Sortino ratio strongly favors the portfolio: 0.546 vs 0.164. The raw edge is real in both absolute and risk-adjusted terms.
Year-by-Year Returns
| Year | Portfolio | DAX | Excess |
|---|---|---|---|
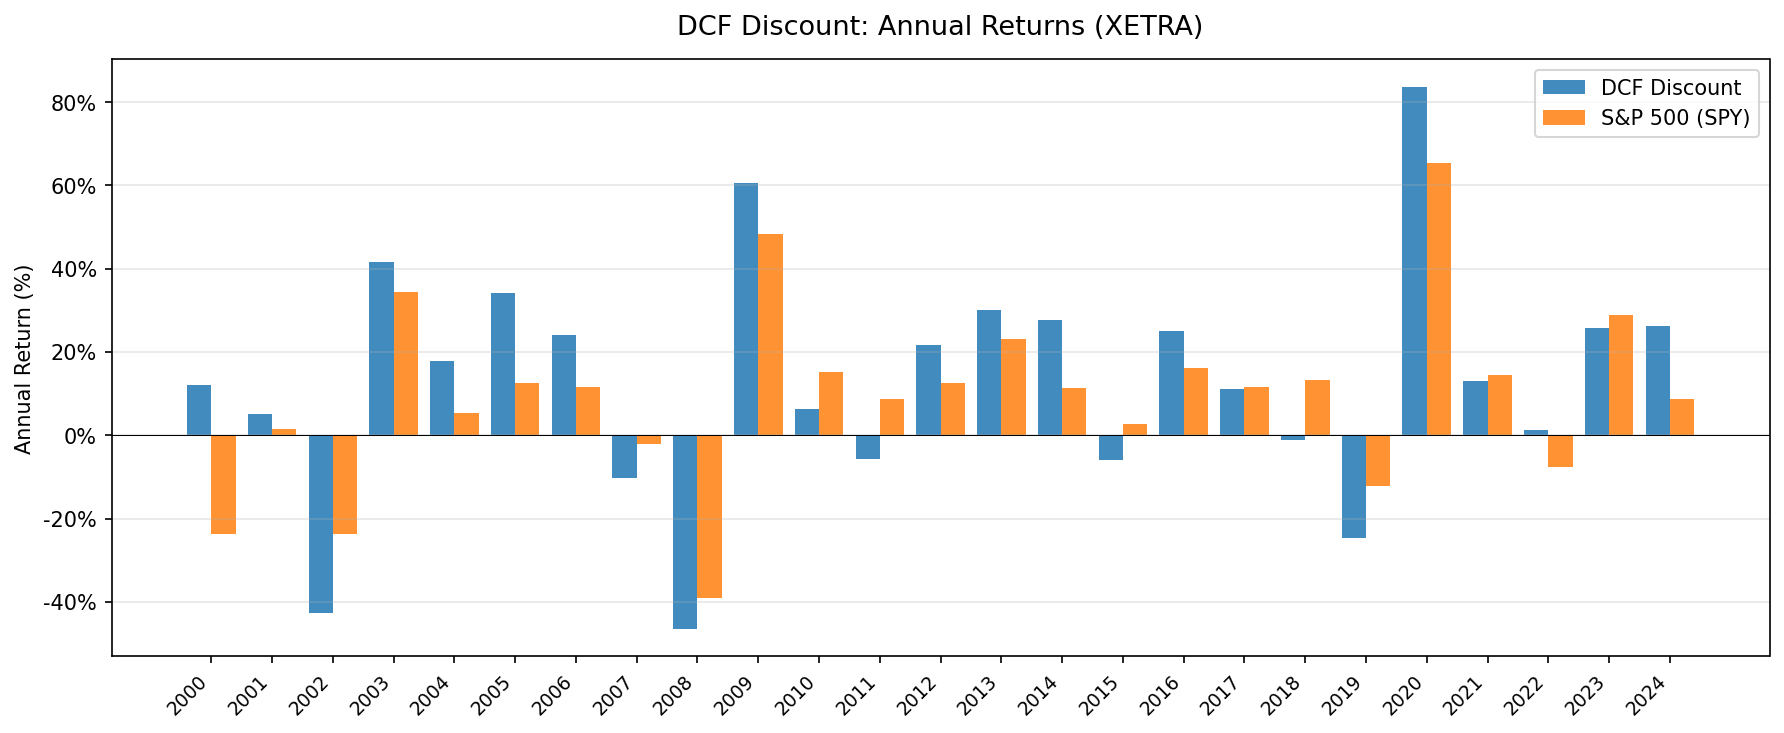
| 2000 | +12.0% | -22.5% | +34.4% |
| 2001 | +3.0% | -7.8% | +10.8% |
| 2002 | -40.0% | -51.3% | +11.3% |
| 2003 | +37.2% | +54.8% | -17.6% |
| 2004 | +15.8% | +8.3% | +7.4% |
| 2005 | +36.0% | +38.8% | -2.8% |
| 2006 | +24.1% | +15.2% | +8.9% |
| 2007 | -2.7% | -2.3% | -0.4% |
| 2008 | -46.2% | -35.4% | -10.9% |
| 2009 | +54.3% | +42.7% | +11.6% |
| 2010 | +3.3% | +14.8% | -11.5% |
| 2011 | -6.1% | -1.7% | -4.4% |
| 2012 | +21.2% | +12.6% | +8.7% |
| 2013 | +30.4% | +21.1% | +9.3% |
| 2014 | +26.2% | +24.4% | +1.8% |
| 2015 | -6.1% | -17.9% | +11.9% |
| 2016 | +25.1% | +24.8% | +0.3% |
| 2017 | +11.2% | -2.1% | +13.2% |
| 2018 | -0.8% | -2.1% | +1.2% |
| 2019 | -24.9% | -18.6% | -6.3% |
| 2020 | +82.5% | +59.0% | +23.6% |
| 2021 | +12.1% | -4.6% | +16.7% |
| 2022 | +0.9% | +7.3% | -6.4% |
| 2023 | +25.6% | +17.3% | +8.2% |
| 2024 | +25.6% | +22.5% | +3.1% |
Key Observations
The Mittelstand advantage. XETRA isn't just Siemens and SAP. It includes hundreds of Mittelstand companies, the mid-cap industrial specialists that dominate niche global markets. Companies like Duerr, Krones, and Jungheinrich. These firms often generate substantial free cash flow relative to their market cap because they're market leaders in unglamorous industries: packaging machinery, paint systems, forklifts. The DCF screen naturally gravitates toward them. When 33.2 stocks per period pass the filter, a good portion are these hidden champions.
2002 was brutal. The portfolio lost 40.0% while the DAX fell 51.3%. Germany's tech and telecom bust hit hard. Deutsche Telekom, Infineon, and other Neuer Markt casualties dragged the broader XETRA universe down. The DCF screen actually outperformed the DAX by 11.3 points that year, showing that value stocks held up better than the broad market during the crash.
2020: the strongest single year. +82.5%. German industrial value stocks were priced for permanent decline during COVID lockdowns in March-April 2020. The April rebalance picked up deeply discounted manufacturers and exporters right at the bottom. The snapback was violent, beating the DAX's +59.0% by 23.6 points.
The 2018-2019 slump. Two years of mixed results. 2018 was slightly better than the DAX (+1.2% excess), but 2019 saw the portfolio lag by -6.3%. Germany's auto sector was dealing with diesel emissions fallout, trade war fears hit exporters, and the ECB's negative rate environment squeezed financials.
Down capture tells the real story. At 69.91%, this portfolio provides meaningful downside protection vs the DAX. The portfolio dodges roughly 30% of the DAX's losses. The 2002 crash is a clear example: the portfolio fell -40.0% while the DAX fell -51.3%. Combined with 120.98% up capture, the asymmetry compounds over 25 years.
Fully invested, always. Zero cash periods across the entire backtest. XETRA consistently produced 30+ stocks meeting the €500M market cap and 8.78% FCF yield thresholds. Germany's deep bench of industrial and manufacturing companies ensures the screen never runs dry.
Currency Context
All returns are converted to USD. The EUR/USD rate fluctuated between roughly 0.85 (late 2000) and 1.60 (mid-2008), and has settled around 1.08 in recent years.
This matters for two reasons. First, the strong euro period (2002-2008) boosted USD-denominated returns from German stocks, making the early-to-mid 2000s look better in dollar terms than they were in local currency. Second, the euro's relative stability since 2015 means the recent results are closer to what a EUR-denominated investor would see.
Unlike emerging market currencies that can depreciate 30-50% over a decade, the EUR/USD rate has been range-bound. Currency isn't the dominant driver here. The signal itself, buying cash-flow-rich German companies at a discount, is doing the heavy lifting.
Limitations
Meaningful drawdowns. 26.71% annualized volatility with a -47.67% max drawdown. The 2002 crash alone wiped out 40.0% in a single year. That's a hard drawdown to sit through, even knowing it recovered.
Concentrated sector exposure. German high-FCF-yield stocks cluster in industrials, autos, and chemicals. The portfolio isn't a diversified Germany fund. When those sectors underperform (2018-2019 diesel/trade war period), the strategy drags hard.
Trailing FCF in cyclical industries. Germany's economy is export-driven and cyclical. A manufacturer reporting strong FCF in year T may see cash flows collapse in T+1 if global demand falls. The screen uses last year's numbers. For deeply cyclical companies, trailing FCF overstates normalized earning power during peaks.
Model assumptions. The Gordon Growth Model's fixed 2.5% growth rate and 10% discount rate may not suit every German company equally. A slow-growth utility and a fast-growing software firm get the same treatment. The simplicity is intentional, but it's still a limitation.
Smaller universe than the US. The US version selects from NYSE + NASDAQ + AMEX, thousands of stocks. XETRA has a smaller eligible pool, which is why the portfolio averages 33.2 stocks instead of the US's 35.1. Less diversification means more idiosyncratic risk per holding.
Survivorship bias. The €500M market cap floor and XETRA's listing standards reduce the risk, but some delisted companies may have incomplete data in the earlier years of the backtest.
Takeaway
Buying German stocks at a 20%+ discount to intrinsic value delivered 9.28% CAGR over 25 years, beating the DAX by 4.76% annually. The edge compounded into 838.77% total return vs 201.39%.
The strategy provides downside protection vs the DAX, with 69.91% down capture. The recoveries were strong: 2009 (+54.3%), 2020 (+82.5%), and 2024 (+25.6%) show what happens when deeply discounted industrial cash flow generators get re-priced. The portfolio's -47.67% max drawdown was shallower than the DAX's -65.15%.
Germany's Mittelstand ensures this screen stays populated. Zero cash periods across 25 years. Always enough qualifying companies. For a DCF-based value screen, that reliability matters.
The practical takeaway: the DCF discount signal works well in Europe's largest economy. With a 0.771 beta and meaningful alpha (5.68%), it delivers systematic exposure to cheap German industrials with a long-term compounding edge.
Part of a Series
This analysis is part of our DCF Discount global exchange comparison:
- DCF Discount on US Stocks (NYSE + NASDAQ + AMEX)
- DCF Discount on Indian Stocks (BSE + NSE)
- DCF Discount on Taiwan Stocks (TAI + TWO)
- DCF Discount on Canadian Stocks (TSX)
- DCF Discount on Korean Stocks (KSC)
- DCF Discount on German Stocks (XETRA)
- DCF Discount on Brazilian Stocks (SAO)
- DCF Discount on Australian Stocks (ASX)
- DCF Discount on Swedish Stocks (STO)
- DCF Discount: Global Exchange Comparison
Data: Ceta Research, FMP financial data warehouse. Backtest: 2000-2025, 25 annual periods, Gordon Growth Model (g=2.5%, r=10%, multiple=13.67x). Universe: XETRA, market cap >€500M, positive FCF. Size-tiered transaction costs applied. Full methodology: METHODOLOGY.md


