
Corporate Spinoffs: Both Parent and Child Underperform SPY for Six

When a large company spins off a division, index funds that owned the parent receive shares of the child entity. If the child is too small for the S&P 500, passive funds must sell, not because the business is bad, but because their mandate requires it. This forced selling depresses the child's price temporarily. Over subsequent months, fundamental investors step in and the price recovers.
Contents
- Method
- The Academic Baseline
- Results: Spinoff Children
- Results: Spinoff Parents
- The Outlier Problem
- What This Means for Spinoff Investing
- The Screen Today
- Limitations
- Takeaway
- References
The parent benefits too. A focused company typically trades at a higher multiple than a conglomerate. The "conglomerate discount" disappears once the division is separated.
That's the theory. We tested it on 30 major US corporate spinoffs from 2011 to 2024, tracking both parent and child performance at six time horizons after the separation.
The results are more nuanced than the academic literature suggests.
Method
- Data source: Ceta Research (FMP financial data warehouse)
- Event list: Curated from SEC filings, press releases, and public records (30 confirmed spinoffs, 2011-2024)
- Price data: stock_eod (adjusted close prices)
- Benchmark: SPY
- Event windows: T+1, T+5, T+21, T+63, T+126, T+252 trading days
Each spinoff generates two events: one for the parent, one for the child. Abnormal return = stock return minus SPY return over the same calendar period. Returns are winsorized at the 1%/99% level to limit distortion from extreme outliers.
One deduplication note: Raytheon (RTX) spun off both Otis and Carrier on the same date (2020-04-03). RTX appears once as parent to avoid double-counting identical price observations.
This gives us 29 parent events and 29 child events (58 total) from 30 spinoffs.
Academic basis: Cusatis, Miles & Woolridge (1993); McConnell & Ovtchinnikov (2004)
The Academic Baseline
Cusatis, Miles, and Woolridge (1993) examined spinoffs from 1965 to 1988 and found that both parents and children outperformed the market. Spinoff children returned roughly 25% more than the market over three years. Parents outperformed by about 18%.
McConnell and Ovtchinnikov (2004) extended this with later data and found the results held, with much of the child's outperformance coming from eventual acquisitions at a premium.
Joel Greenblatt popularized the strategy in "You Can Be a Stock Market Genius" (1997), calling spinoffs one of the few places where individual investors have a structural edge over institutions.
Our dataset covers 2011-2024. Here's what the more recent data shows.
Results: Spinoff Children

| Window | Mean CAR | Median CAR | t-stat | N | Hit Rate |
|---|---|---|---|---|---|
| T+1 | -1.6% | -1.3% | -1.59 | 29 | 34.5% |
| T+5 | -3.5% | -2.7% | -2.28 | 29 | 34.5% |
| T+21 | -1.1% | +2.7% | -0.52 | 29 | 51.7% |
| T+63 | +1.7% | +7.0% | 0.55 | 29 | 62.1% |
| T+126 | +5.9% | +0.7% | 1.16 | 29 | 51.7% |
| T+252 | +3.1% | -4.0% | 0.37 | 29 | 48.3% |
The only statistically significant result: T+5, mean CAR = -3.48%, t = -2.28 (p < 0.05).
In the first week after a spinoff, 65.5% of children underperformed SPY. That's forced selling in action, and it's the one finding in this dataset that clears the significance bar.
After that, the picture becomes murkier.
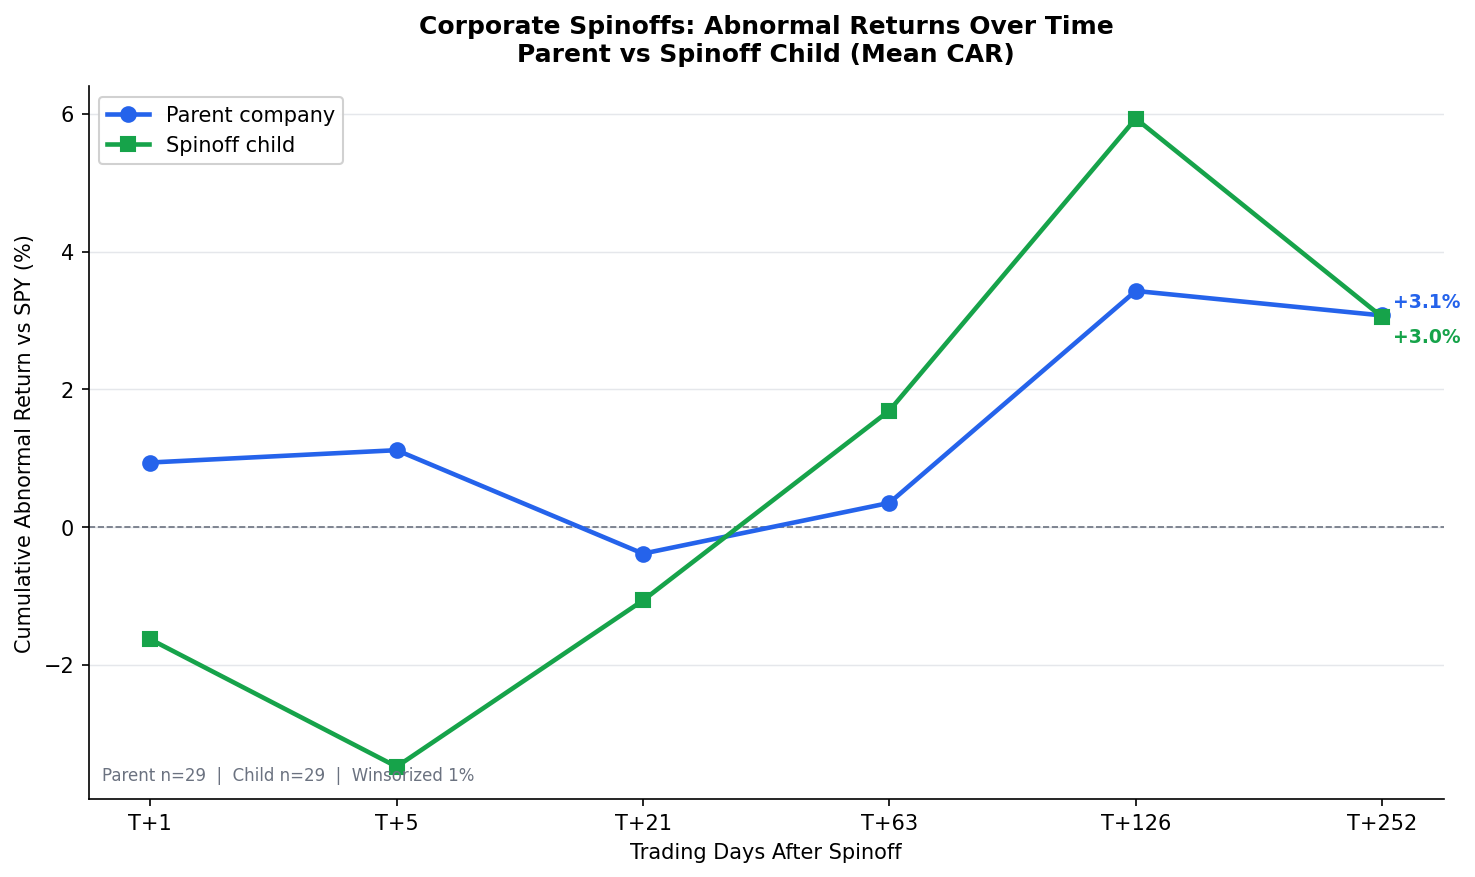
By T+63, the mean has recovered to +1.7%. By T+126, it's +5.9%. By T+252, the mean is +3.1%.
But the median at T+252 is -4.0%. A positive mean with a negative median means the average is being pulled up by a few large winners. The typical spinoff child underperformed SPY after one year.
Hit rate at T+252: 48.3%. Roughly a coin flip.
Results: Spinoff Parents
| Window | Mean CAR | Median CAR | t-stat | N | Hit Rate |
|---|---|---|---|---|---|
| T+1 | +0.9% | +0.7% | 1.63 | 29 | 58.6% |
| T+5 | +1.1% | +0.8% | 1.30 | 29 | 58.6% |
| T+21 | -0.4% | -0.4% | -0.25 | 29 | 44.8% |
| T+63 | +0.4% | -0.2% | 0.15 | 29 | 48.3% |
| T+126 | +3.4% | +0.4% | 0.88 | 29 | 51.7% |
| T+252 | +3.1% | -2.3% | 0.52 | 29 | 44.8% |
Parents show a different pattern. They hold up better in the first week (+1.1% mean at T+5 vs -3.5% for children), which makes sense: the forced selling hits the child, not the parent.
By T+252, the mean is +3.1% and the hit rate is 44.8%. The median is -2.3%. Same story as the children: a positive mean driven by outliers, and the typical parent also underperforming.
Nothing is statistically significant for parents at any window.
The Outlier Problem
The mean/median gap tells you everything about spinoff return distributions.
Best spinoff children (T+252):
| Child | Parent | Year | T+252 CAR |
|---|---|---|---|
| GEV (GE Vernova) | GE | 2024 | +108.0% |
| CARR (Carrier Global) | RTX | 2020 | +89.1% |
| PSX (Phillips 66) | COP | 2012 | +75.6% |
| CDK Global | ADP | 2014 | +54.0% |
| HPE (HP Enterprise) | HPQ | 2015 | +51.8% |
Worst spinoff children (T+252):
| Child | Parent | Year | T+252 CAR |
|---|---|---|---|
| REZI (Resideo) | HON | 2018 | -68.0% |
| KVUE (Kenvue) | JNJ | 2023 | -56.3% |
| KD (Kyndryl) | IBM | 2021 | -50.4% |
| GTX (Garrett Motion) | HON | 2018 | -46.9% |
| BHF (Brighthouse Financial) | MET | 2017 | -46.9% |
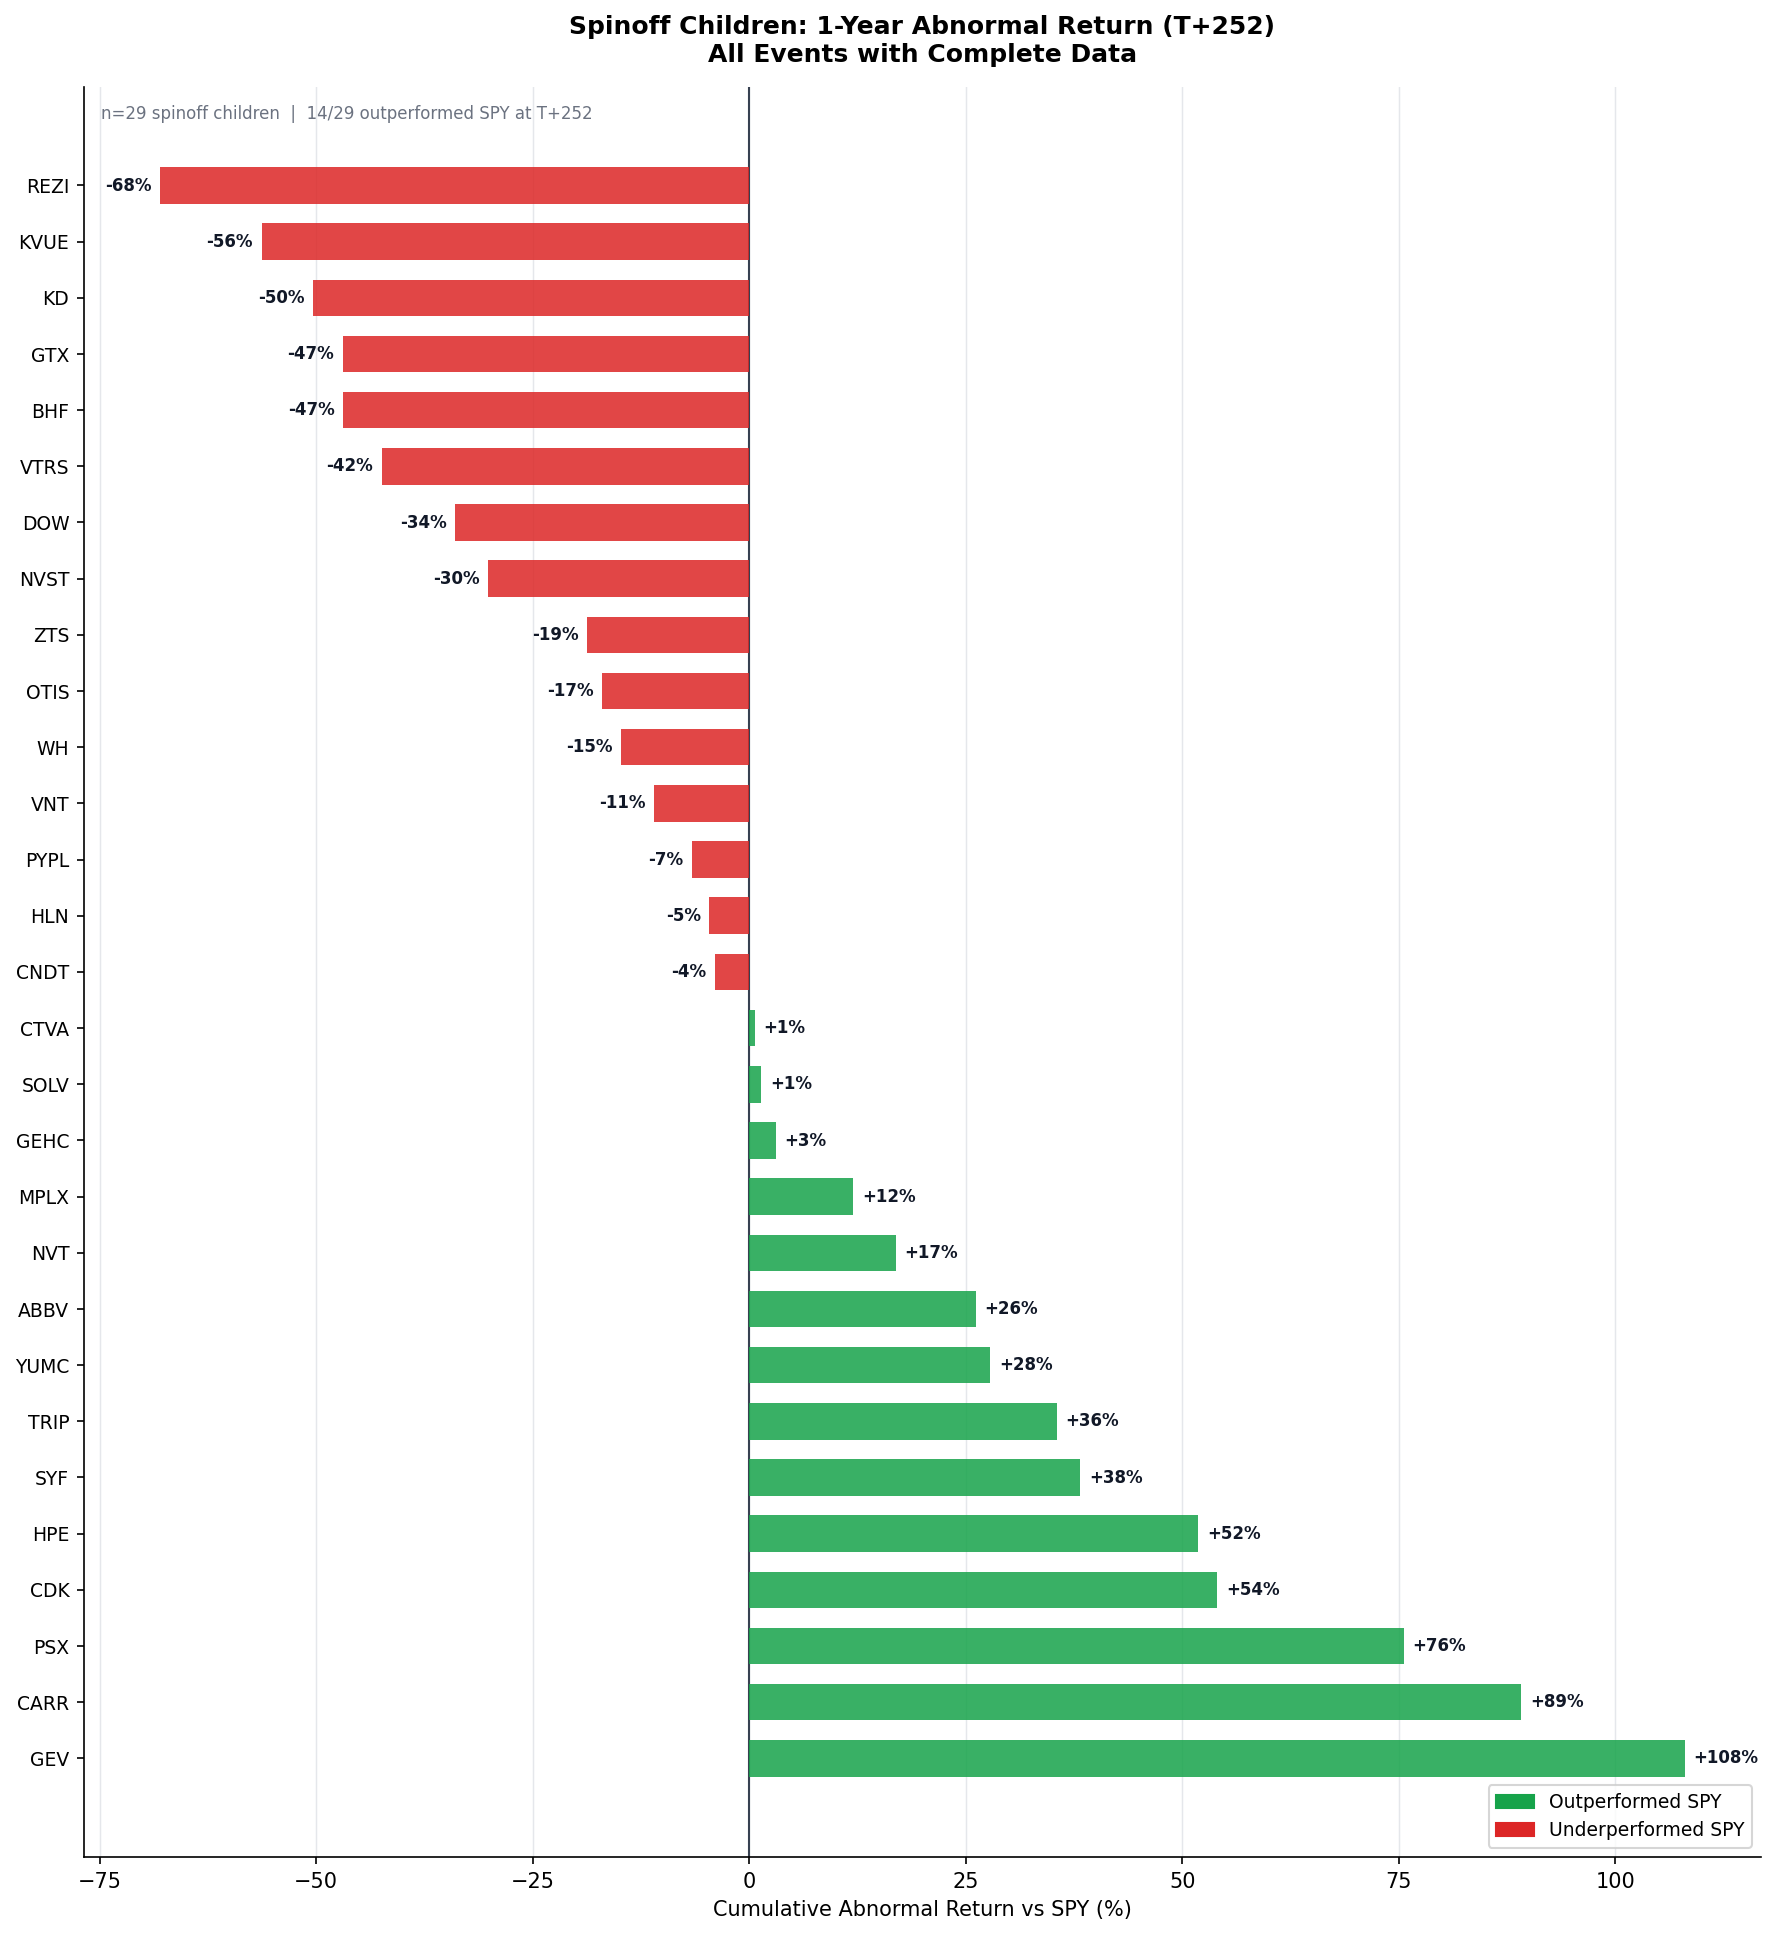
The range is 108% to -68%. The best performers (GE Vernova, Carrier, Phillips 66) were spun off into sectors with strong fundamental tailwinds. GEV caught the energy transition. Carrier caught the post-COVID construction cycle. PSX benefited from the US shale boom.
The worst performers had structural headwinds. Resideo competed in commoditized home security hardware. Kenvue was carved out of J&J's consumer division right before generic competition intensified in its key categories. Kyndryl inherited IBM's legacy IT services business.
Forced selling was present in both groups. Fundamentals determined the outcome.
What This Means for Spinoff Investing
The short-term forced-selling effect is real and statistically confirmed. If you want to buy spinoff children after the initial selling pressure clears, the data suggests waiting past T+5 before entering.
The long-term story is harder to exploit systematically:
- The mean is positive, but the median is negative. You need to identify which spinoffs have strong standalone fundamentals. Buying all spinoffs indiscriminately gets you the distribution, not the winners.
- The spread is enormous. GEV returned +108% vs SPY while REZI returned -68% vs SPY. A 176-point spread between best and worst over one year means stock selection matters more than event selection.
- The signal isn't persistent. The academic evidence (1965-1988) found 25%+ excess returns over 3 years. Our 2011-2024 data shows +3.1% over 1 year. Either the strategy has been arb'd down, the time period matters, or the longer horizon captures effects we're not measuring.
- Sample size limits confidence. 29 events is enough to see patterns, but t-statistics on this sample should be treated as directional, not definitive.
The Screen Today
Run this query on Ceta Research →
Recent spinoffs and their current cumulative abnormal return vs SPY (as of March 2026):
| Symbol | Type | Spinoff | Stock Ret | SPY Ret | CAR |
|---|---|---|---|---|---|
| GEV | child | Apr 2024 | +497.7% | +32.8% | +464.9% |
| GE | parent | Apr 2024 | +141.3% | +32.8% | +108.5% |
| MMM | parent | Apr 2024 | +70.0% | +31.9% | +38.1% |
| SOLV | child | Apr 2024 | -2.3% | +31.9% | -34.2% |
| IBM | parent | Nov 2021 | +143.4% | +53.2% | +90.2% |
| GSK | parent | Jul 2022 | +58.7% | +85.3% | -26.6% |
| JNJ | parent | May 2023 | +62.8% | +72.5% | -9.7% |
| GE | parent | Jan 2023 | +489.8% | +82.8% | +407.0% |
| HLN | child | Jul 2022 | +43.1% | +85.3% | -42.2% |
| GEHC | child | Jan 2023 | +20.5% | +82.8% | -62.4% |
| KVUE | child | May 2023 | -26.3% | +72.5% | -98.8% |
| KD | child | Nov 2021 | -52.5% | +53.2% | -105.8% |
GE appears twice, 2023 GEHC spinoff and 2024 GEV spinoff.
-- Current screen: recent spinoffs vs SPY (run on Ceta Research)
WITH spinoffs AS (
 SELECT 'GEV' AS symbol, DATE '2024-04-02' AS spinoff_date, 'child' AS category, 'GE / GE Vernova' AS description UNION ALL
 SELECT 'SOLV', DATE '2024-04-01', 'child', '3M / Solventum' UNION ALL
 SELECT 'KVUE', DATE '2023-05-04', 'child', 'J&J / Kenvue' UNION ALL
 SELECT 'GEHC', DATE '2023-01-04', 'child', 'GE / GE Healthcare' UNION ALL
 SELECT 'HLN', DATE '2022-07-18', 'child', 'GSK / Haleon' UNION ALL
 SELECT 'KD', DATE '2021-11-04', 'child', 'IBM / Kyndryl' UNION ALL
 SELECT 'GE', DATE '2024-04-02', 'parent', 'GE / GE Vernova 2024' UNION ALL
 SELECT 'MMM', DATE '2024-04-01', 'parent', '3M / Solventum' UNION ALL
 SELECT 'JNJ', DATE '2023-05-04', 'parent', 'J&J / Kenvue' UNION ALL
 SELECT 'GE', DATE '2023-01-04', 'parent', 'GE / GE Healthcare 2023' UNION ALL
 SELECT 'GSK', DATE '2022-07-18', 'parent', 'GSK / Haleon' UNION ALL
 SELECT 'IBM', DATE '2021-11-04', 'parent', 'IBM / Kyndryl'
),
latest_date AS (SELECT MAX(CAST(date AS DATE)) AS dt FROM stock_eod WHERE symbol = 'SPY'),
t0_dates AS (
 SELECT s.symbol, s.spinoff_date, s.category, s.description,
 MIN(CAST(e.date AS DATE)) AS t0_date
 FROM spinoffs s
 JOIN stock_eod e ON e.symbol = s.symbol AND CAST(e.date AS DATE) >= s.spinoff_date
 GROUP BY s.symbol, s.spinoff_date, s.category, s.description
),
spy_t0_dates AS (
 SELECT s.symbol, s.spinoff_date, MIN(CAST(e.date AS DATE)) AS t0_date
 FROM spinoffs s
 JOIN stock_eod e ON e.symbol = 'SPY' AND CAST(e.date AS DATE) >= s.spinoff_date
 GROUP BY s.symbol, s.spinoff_date
)
SELECT t.category, t.symbol, t.description, t.spinoff_date,
 ROUND((e_now.adjClose - e_t0.adjClose) / e_t0.adjClose * 100, 1) AS stock_ret_pct,
 ROUND((spy_now.adjClose - spy_t0.adjClose) / spy_t0.adjClose * 100, 1) AS spy_ret_pct,
 ROUND(((e_now.adjClose - e_t0.adjClose) / e_t0.adjClose - (spy_now.adjClose - spy_t0.adjClose) / spy_t0.adjClose) * 100, 1) AS car_pct
FROM t0_dates t
JOIN spy_t0_dates st ON st.symbol = t.symbol AND st.spinoff_date = t.spinoff_date
JOIN latest_date l ON TRUE
JOIN stock_eod e_t0 ON e_t0.symbol = t.symbol AND CAST(e_t0.date AS DATE) = t.t0_date
JOIN stock_eod e_now ON e_now.symbol = t.symbol AND CAST(e_now.date AS DATE) = l.dt
JOIN stock_eod spy_t0 ON spy_t0.symbol = 'SPY' AND CAST(spy_t0.date AS DATE) = st.t0_date
JOIN stock_eod spy_now ON spy_now.symbol = 'SPY' AND CAST(spy_now.date AS DATE) = l.dt
ORDER BY t.spinoff_date DESC, t.category, car_pct DESC
Data availability check for all 29 spinoff children →
Limitations
Small sample. 29 events per group produces t-statistics in the 0.3-2.3 range. The only significant result (T+5 for children) barely clears the bar. Academic studies used hundreds of events over decades.
Selection bias. The curated list overrepresents large, well-known spinoffs. Smaller spinoffs may behave differently. We can't claim these results apply to all spinoffs.
Survivorship. All spinoffs in the list produced companies that traded for at least a year. Spinoffs that immediately failed or were absorbed aren't represented.
SPY benchmark. SPY doesn't control for sector, size, or style. A technology spinoff during a tech rally might show positive abnormal returns that are really just factor exposure.
Bull market period. 2011-2024 was mostly a strong bull market. Spinoff behavior during prolonged bear markets or flat markets may differ.
No transaction costs. The screen measures gross returns. Spinoff children often have wide spreads early in their trading life.
Takeaway
Corporate spinoffs produce one clean, statistically confirmed effect: forced selling in the first week depresses children's prices by a mean of 3.5% vs SPY (p < 0.05).
The long-run recovery is plausible but not statistically significant at this sample size. The mean return at T+252 is +3.1% for both parents and children, but the median is negative, meaning most spinoffs underperform and a few outliers pull the average up.
The academic case for spinoffs is built on decades of data and hundreds of events. Our 14-year, 30-spinoff sample shows the mechanism works in the short run, and the direction of long-term returns is positive, but the magnitude has likely compressed as the strategy became widely known.
For investors who can identify spinoffs with strong standalone fundamentals, the forced-selling window around T+5 to T+21 may offer a reasonable entry point. For investors looking to mechanically buy all spinoffs, the expected return is positive but modest, with wide dispersion and no statistical certainty.
Run It Yourself
Explore the data behind this analysis on Ceta Research. Query our financial data warehouse with SQL, build custom screens, and run your own backtests across 70,000+ stocks on 20 exchanges.
Data: Ceta Research (FMP financial data warehouse). Curated spinoff list from SEC filings and public records (30 events, 2011-2024). Abnormal returns computed vs SPY. Winsorized at 1%/99%. N=29 per category. Small sample limits statistical confidence. Past performance doesn't guarantee future results. This is educational content, not investment advice.
References
- Cusatis, P., Miles, J., & Woolridge, J. (1993). "Restructuring Through Spinoffs: The Stock Market Evidence." Journal of Financial Economics, 33(3), 293-311.
- McConnell, J. & Ovtchinnikov, A. (2004). "Predictability of Long-Term Spinoff Returns." Journal of Investment Management, 2(3).
- Greenblatt, J. (1997). You Can Be a Stock Market Genius. Simon & Schuster.


