
Capital Efficiency in the UK: 9.34% CAGR, +8.12% vs FTSE 100
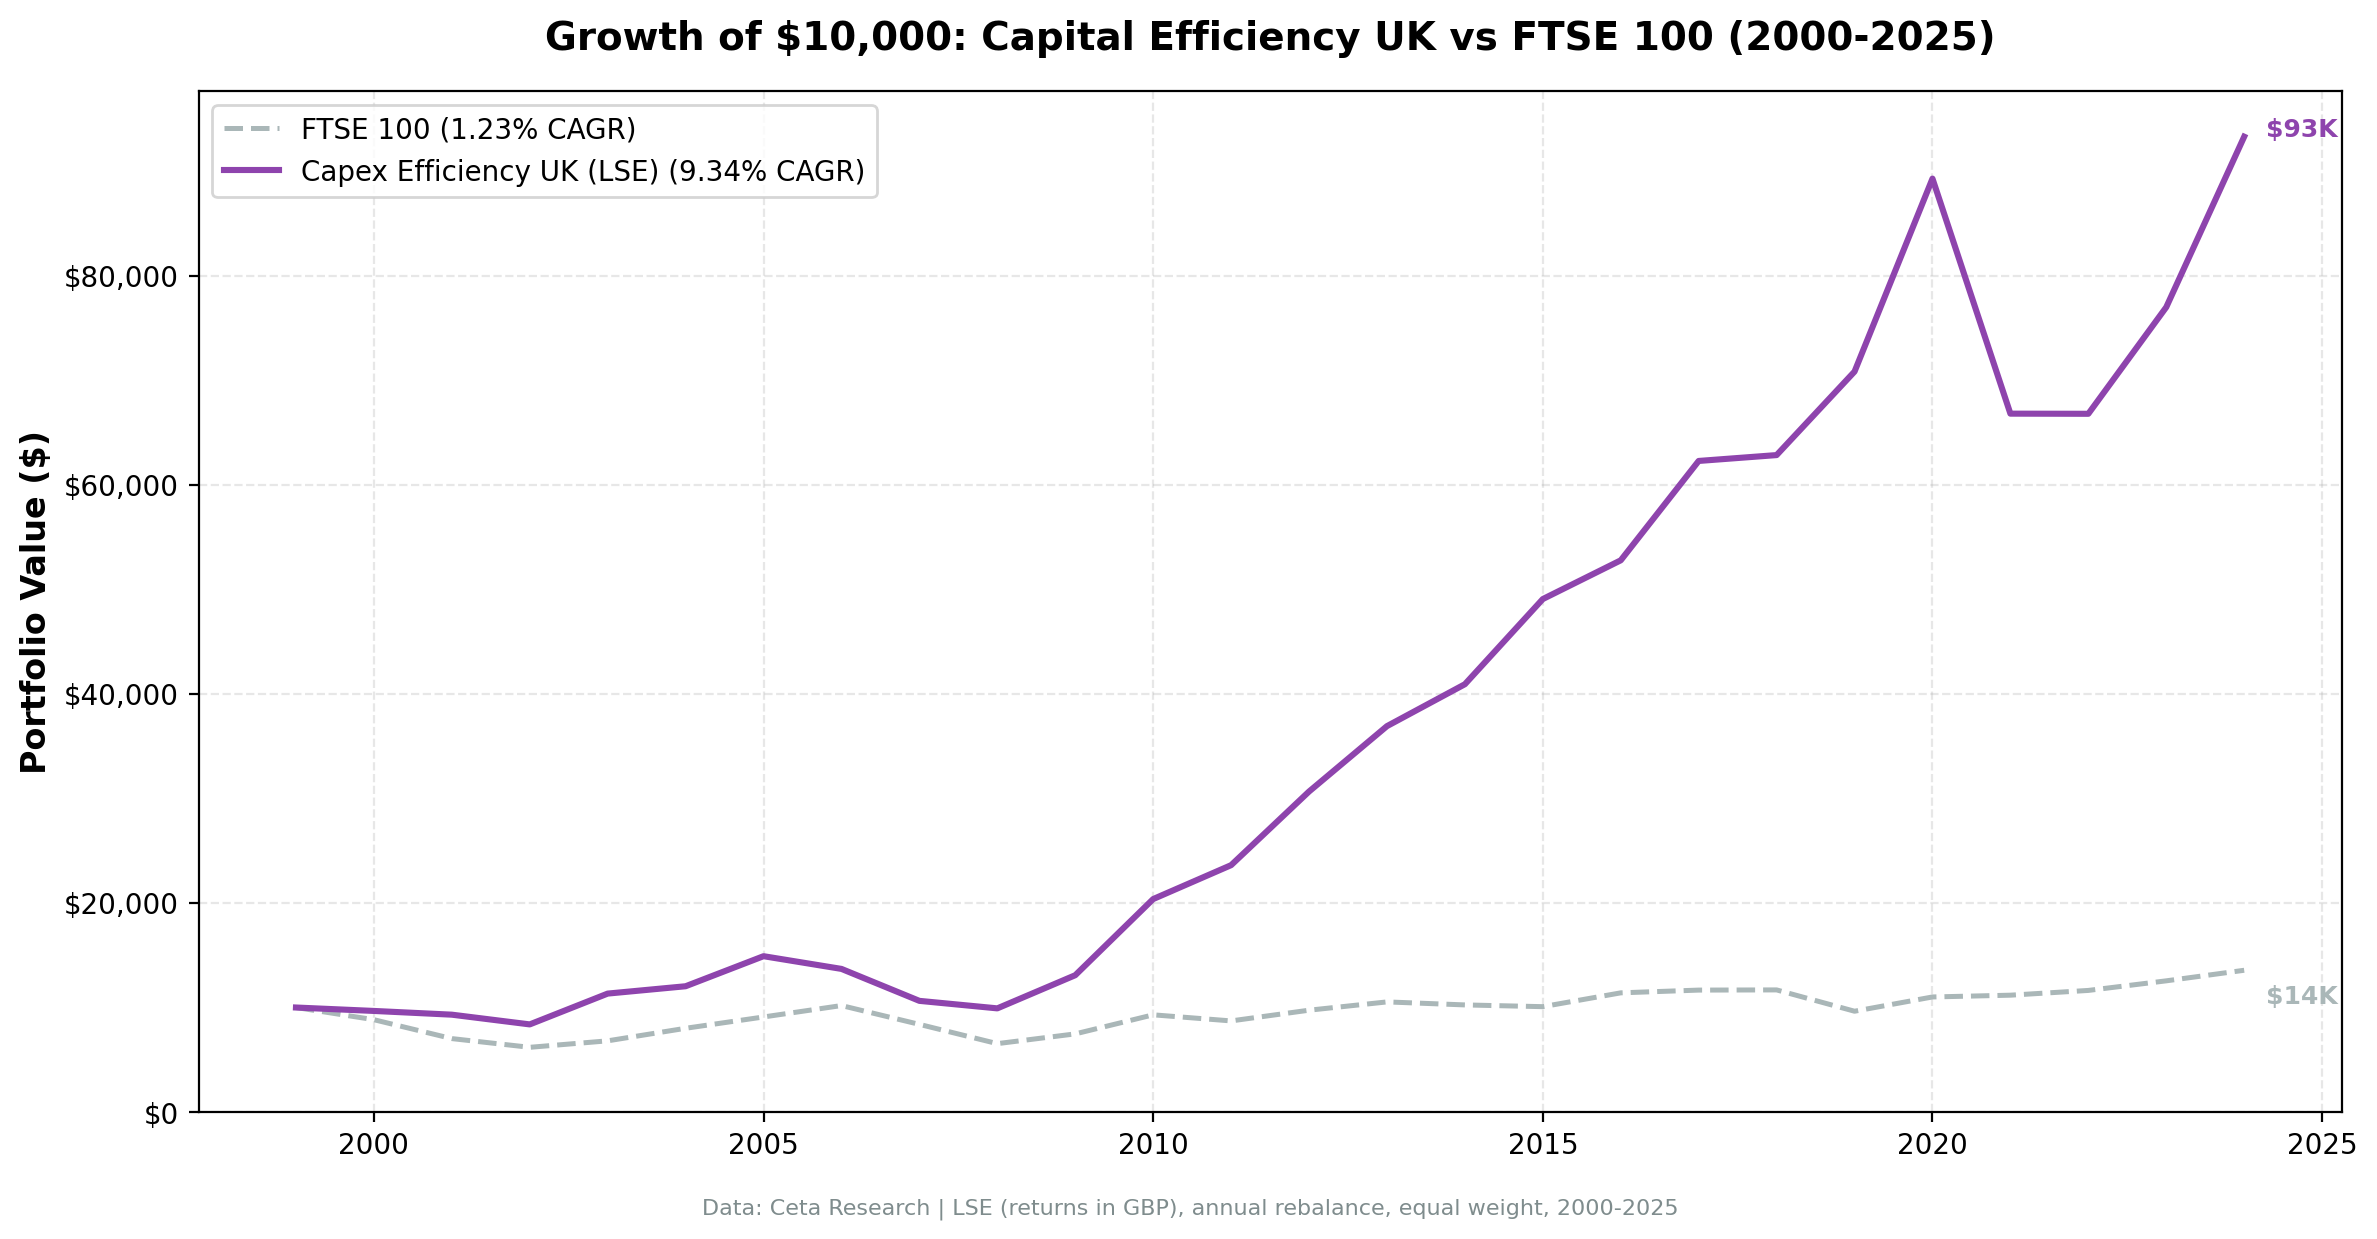
Testing capital efficiency on the LSE: low-capex, high-ROIC UK companies delivered 9.34% CAGR from 2000-2025, beating the FTSE 100 (1.23% CAGR) by 8.12%/year. The widest excess of any market tested.

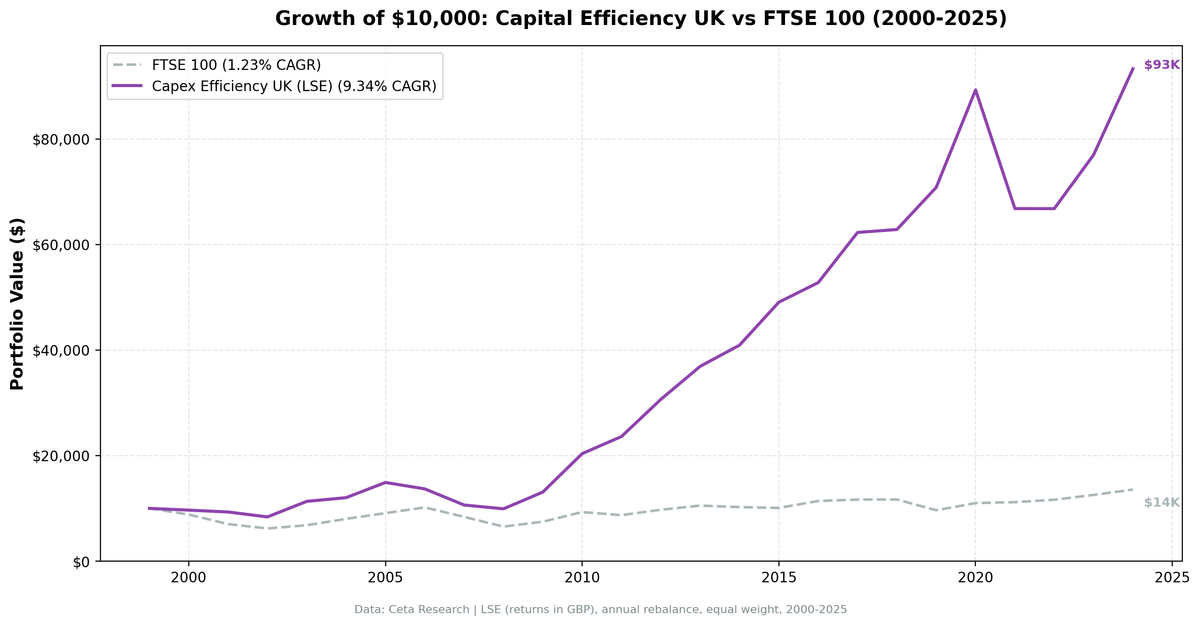
A portfolio of capital-efficient UK companies, those spending less than 8% of revenue on capex while earning above 15% ROIC, delivered 9.34% annualized returns from 2000 to 2025. The FTSE 100 returned 1.23% CAGR over the same period. That +8.12% annual excess is the widest margin of any market we tested. The FTSE's heavy weighting toward banks, oil majors, and mining companies dragged it down for 25 years. Capital-efficient UK businesses escaped that drag entirely.
Contents
- The Strategy
- Methodology
- Results
- Why the Wide Excess?
- When It Struggles
- Run It Yourself
- Limitations
- Related Content
Data: FMP financial data warehouse, 2000–2025. Updated May 2026.
The Strategy
Capital expenditure efficiency screens for companies that generate strong returns without constant reinvestment in fixed assets:
- Capex-to-Revenue < 8%: Asset-light business model (software, services, specialized manufacturing)
- Capex-to-Operating Cash Flow < 40%: Retains 60%+ of operating cash as free cash flow
- ROIC > 15%: Earns well above cost of capital
- Operating Margin > 15%: Pricing power through differentiation
Portfolio construction: Top 30 stocks by highest ROIC, equal-weight, annual rebalancing in July (45-day lag for fiscal year filings). Cash position if fewer than 10 stocks qualify.
Methodology
Universe: LSE, all stocks with market cap > £500M (~$635M USD) Data source: Ceta Research (FMP financial data warehouse) Backtest period: July 2000 - July 2025 (25 annual periods) Rebalancing: Annual (July) using FY data with 45-day filing lag Transaction costs: Size-tiered model (0.2-0.5% per trade, applied to individual stock returns) Benchmark: FTSE 100 (local currency) Execution: Next-day close (market-on-close after signal date)
Signal (at each rebalance date): - Capex-to-Revenue < 8% - Capex-to-OCF < 40% - ROIC > 15% - Operating Margin > 15% - Market Cap > £500M
From qualifying stocks, select top 30 by highest ROIC. Hold equal weight. If fewer than 10 qualify, hold cash (0 of 25 periods).
Full methodology: backtests/METHODOLOGY.md
Results
| Metric | Strategy | FTSE 100 | Excess |
|---|---|---|---|
| CAGR | 9.34% | 1.23% | +8.12% |
| Total Return | 833% | 36% | +797% |
| Sharpe Ratio | 0.313 | -0.176 | - |
| Sortino Ratio | 0.649 | -0.217 | - |
| Max Drawdown | -33.48% | -38.07% | - |
| Volatility (ann.) | 18.65% | 12.91% | - |
| Win Rate | 76.0% | N/A | - |
| Best Year | +55.7% (2010) | 24.4% | +31.3% |
| Worst Year | -25.2% (2021) | +1.5% | -26.7% |
| Avg Stocks per Period | 11 | - | - |
| Cash Periods | 0 / 25 | - | - |
Key observations:
- Widest excess of any market. +8.12% annual excess vs FTSE 100. The FTSE's 1.23% CAGR reflects its structural problems (banks, oil, mining drag), making the capex efficiency screen particularly valuable.
- 76% win rate. 19 out of 25 years beat the FTSE. The highest win rate of any market with significant capital deployed.
- Lower drawdown than benchmark. -33.48% max drawdown vs FTSE's -38.07%. Capital-efficient companies held up better during the COVID and 2022 selloffs.
- Growing portfolio depth. Early years (2000-2004) had only 3-9 qualifying stocks. By 2015+, portfolios consistently held 15-25 stocks. FMP's UK coverage improved over time.
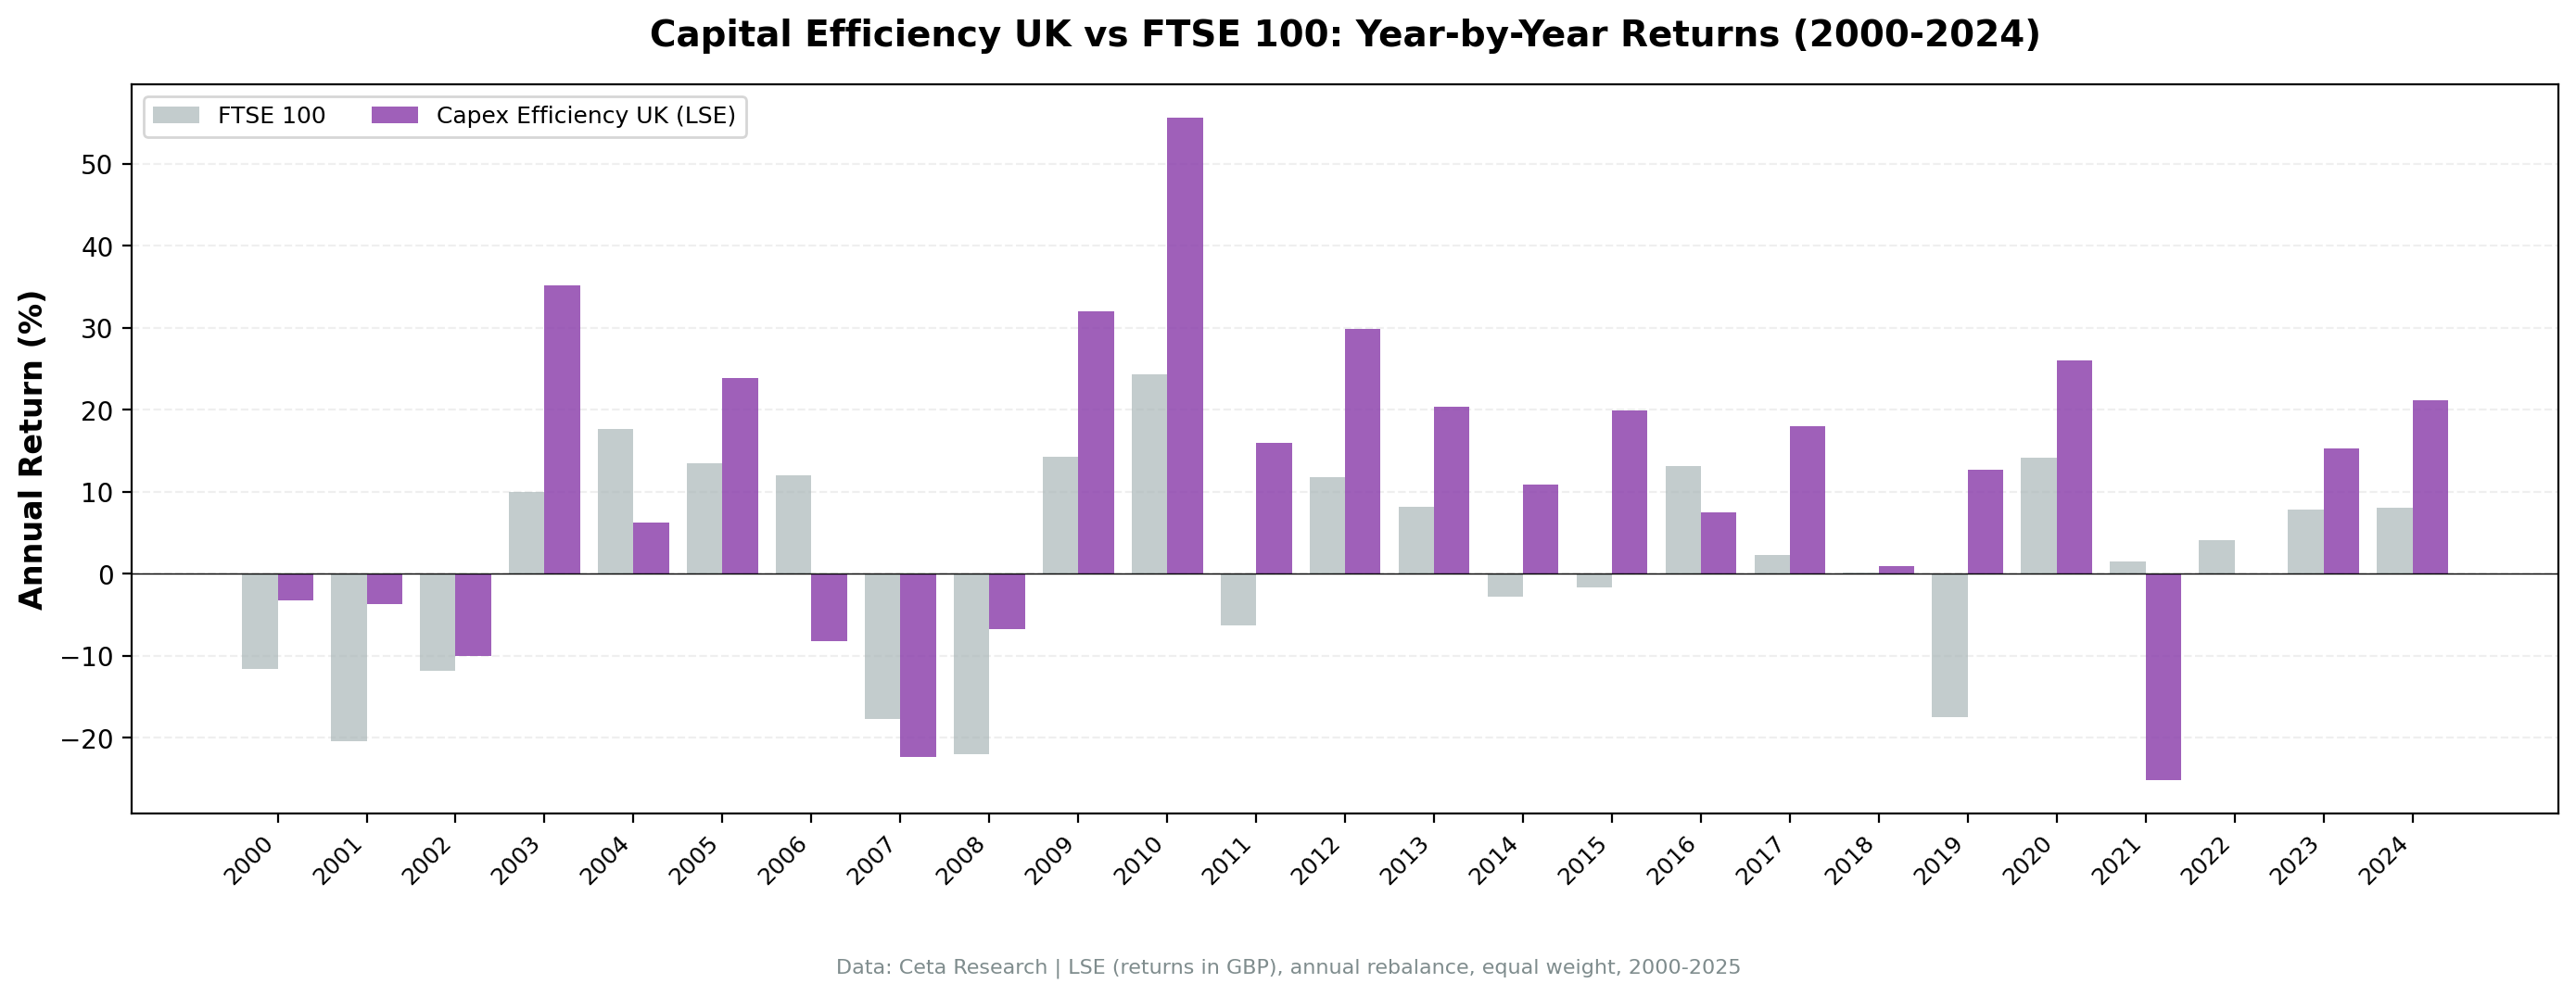
Annual return breakdown (selected years):
| Year | Strategy | FTSE 100 | Excess |
|---|---|---|---|
| 2003 | +35.2% | +10.0% | +25.2% |
| 2008 | -6.8% | -22.0% | +15.2% |
| 2010 | +55.7% | +24.4% | +31.3% |
| 2012 | +29.8% | +11.8% | +18.1% |
| 2017 | +18.0% | +2.3% | +15.7% |
| 2019 | +12.7% | -17.5% | +30.2% |
| 2024 | +21.2% | +8.1% | +13.1% |
Why the Wide Excess?
FTSE 100 structural weakness. The FTSE 100 is heavily weighted toward capital-intensive sectors: oil majors (BP, Shell), banks (HSBC, Barclays), and mining (Rio Tinto, BHP). These sectors require massive ongoing capex and suffered from commodity cycles, banking crises, and regulatory headwinds. The capex efficiency screen excludes all of them by construction.
UK mid-cap quality. The screen naturally selects UK software companies, healthcare services, specialized financial firms, and professional services businesses. Many of these are world-class operators (RELX, Sage, Halma, Spirax) that happen to be listed on the LSE. They generate strong returns without needing heavy asset investment.
Post-2008 divergence. Before the financial crisis, the FTSE 100 and the strategy traded roughly in line. After 2008, the FTSE stagnated (banks deleveraged, oil prices collapsed, mining entered a secular decline) while capital-efficient companies compounded. The gap widened every year from 2010 to 2024.
When It Struggles
Bank-led recoveries. When interest rates rise sharply and bank margins expand (2022-2023), FTSE banks rally hard. The capex efficiency screen misses this entirely. That's by design, but it creates periods where the FTSE outperforms.
Commodity super-cycles. When oil and metals prices surge (2003-2008, 2021-2022), FTSE energy and mining constituents deliver extraordinary returns. The screen excludes them systematically.
Brexit volatility. The 2016 Brexit referendum created indiscriminate selling of UK equities. Capital-efficient companies weren't immune, though they recovered faster than the broader market.
Run It Yourself
Current qualifying stocks (using TTM data):
SELECT
  p.symbol,
  p.companyName,
  ROUND(k.capexToRevenueTTM * 100, 1) AS capex_to_rev_pct,
  ROUND(k.capexToOperatingCashFlowTTM * 100, 1) AS capex_to_ocf_pct,
  ROUND(k.returnOnInvestedCapitalTTM * 100, 1) AS roic_pct,
  ROUND(r.operatingProfitMarginTTM * 100, 1) AS op_margin_pct,
  ROUND(k.marketCap / 1e9, 2) AS mktcap_bn_gbp
FROM key_metrics_ttm k
JOIN financial_ratios_ttm r ON k.symbol = r.symbol
JOIN profile p ON k.symbol = p.symbol
WHERE k.capexToRevenueTTM > 0
  AND k.capexToRevenueTTM < 0.08
  AND k.capexToOperatingCashFlowTTM > 0
  AND k.capexToOperatingCashFlowTTM < 0.40
  AND k.returnOnInvestedCapitalTTM > 0.15
  AND r.operatingProfitMarginTTM > 0.15
  AND k.marketCap > 500000000
  AND p.exchange = 'LSE'
ORDER BY k.returnOnInvestedCapitalTTM DESC
LIMIT 30
Run this query live: Data Explorer: UK Capital Efficiency Screen
Backtest code (Python):
git clone https://github.com/ceta-research/backtests.git
cd backtests
python3 capex-efficiency/backtest.py --preset uk
Limitations
Sector bias is the signal. This strategy systematically overweights software, healthcare services, professional services, specialized financials. It underweights banks, oil, mining, utilities. That's not a bug. The screen is deliberately selecting capital-light business models.
Small early portfolios. The first 5 years (2000-2004) had only 3-9 stocks per period. Single-stock risk was high. Results from this period should be interpreted cautiously. From 2005 onward, portfolios were more diversified.
ROIC calculation differences. Multiple ROIC definitions exist. FMP's TTM ROIC may differ from manual calculations. Rankings matter more than absolute values.
Survivorship bias. FMP data generally includes delisted stocks, but UK coverage isn't perfect. Some bankrupt companies may be missing from historical data.
Currency returns. Results are in GBP, compared against the FTSE 100 (also GBP). This eliminates currency distortion from the benchmark comparison. USD-based investors face GBP/USD volatility, but the excess return over FTSE is currency-neutral.
Related Content
This is part of a multi-market capital efficiency series:
- Capital Efficiency in India: 21.44% CAGR from Low-Capex Stocks - Best absolute returns
- Capital Efficiency US: How Asset-Light Businesses Beat the S&P 500 - Flagship study
- Capital Efficiency Switzerland: 10.20% CAGR, +7.13% vs SMI - 82.6% win rate
- Capital Efficiency Germany: 8.56% CAGR, +3.52% vs DAX
- Capital Efficiency Across Markets: Six-Market Comparison - Six-market study
Data: Ceta Research (FMP financial data warehouse), 2000-2025. Backtest code: github.com/ceta-research/backtests. Full methodology: METHODOLOGY.md.
Past performance does not guarantee future results. This is educational content, not investment advice.


