
Asset Growth Anomaly on Swiss Stocks: 6.57% CAGR, 0.663 Beta on SIX

Asset Growth Anomaly on Swiss Stocks: Lowest Downside Capture in Europe
Switzerland trails the S&P 500 on raw return. That's not the whole story. We backtested the asset growth anomaly with quality filters on SIX from 2000 to 2025. The portfolio returned 6.57% annually vs 7.85% for the S&P 500. A -1.28% annual gap. But down capture was just 50.98%, the lowest of any European exchange we tested. Beta ran at 0.663. You gave up about 1.3 percentage points of return and cut your downside exposure roughly in half. For a market dominated by Nestle, Roche, and Novartis, that tradeoff makes sense. Switzerland already selects for quality. This screen doubles down on it.
Contents
- Method
- Results
- When It Works
- When It Fails
- Limitations
- Run It Yourself
- Current Screen (SQL)
- Backtest
- Takeaway
- References
Method
Data source: Ceta Research (FMP financial data warehouse) Universe: SIX (Swiss Exchange), market cap > CHF 250M (~$284M USD) Period: 2000-2025 (25 annual rebalance periods) Rebalancing: Annual (July), equal weight top 30 by lowest asset growth Benchmark: S&P 500 Total Return (SPY) Regional benchmark: EWL (iShares Switzerland ETF) Cash rule: Hold cash if fewer than 10 stocks qualify Transaction costs: Size-tiered model (0.1% mega-cap, 0.3% large-cap, 0.5% mid-cap) Data quality guards: Entry price > $1, single-period return capped at 200%
Historical financial data with 45-day lag to prevent look-ahead bias. Full methodology: backtests/METHODOLOGY.md.
The filters are identical to our US backtest:
| Criterion | Metric | Threshold |
|---|---|---|
| Capital discipline | Asset Growth (YoY) | -20% to +10% |
| Profitability | Return on Equity | > 8% |
| Asset efficiency | Return on Assets | > 5% |
| Pricing power | Operating Margin | > 10% |
| Size | Market Cap | > CHF 250M (~$284M USD) |
Results
| Metric | Portfolio | S&P 500 |
|---|---|---|
| CAGR | 6.57% | 7.85% |
| Total Return | 390.75% | 561% |
| Max Drawdown | -36.88% | -38.01% |
| Volatility | 15.74% | 16.63% |
| Sharpe Ratio | 0.386 | 0.442 |
| Sortino Ratio | 0.772 | 0.847 |
| Win Rate (vs SPY) | 48% | -- |
| Beta | 0.663 | 1.00 |
| Alpha | 1.20 | -- |
| Up Capture | 74.95% | -- |
| Down Capture | 50.98% | -- |
| Cash Periods | 0/25 | -- |
| Avg Stocks | 18.1 | -- |
The CAGR is 128 basis points below SPY. That's real money over 25 years. The risk-adjusted ratios also trail: the Sharpe (0.386 vs 0.442) and Sortino (0.772 vs 0.847) both come in below the benchmark. That gap is partly mechanical. Switzerland uses a 0.5% risk-free rate, which inflates SPY's risk-adjusted metrics compared to our US-benchmarked runs that use a 2% rate. The lower the risk-free rate, the better any positive-return asset looks on a Sharpe basis.
Where Switzerland stands out is downside protection. The portfolio ran at 15.74% volatility vs the S&P 500's 16.63%. The beta of 0.663 tells you the portfolio moved about two-thirds as much as the market. Up capture was 74.95%. Down capture was 50.98%. So you captured 75% of market gains and only 51% of market losses. That asymmetry is the real story. The 1.20 alpha confirms the screen picks better stocks on a risk-adjusted basis, even if raw returns trail.
Zero cash periods. In all 25 years, the strategy found at least 10 qualifying Swiss stocks. That's notable for a small market. Switzerland's quality-heavy corporate landscape naturally produces companies with low asset growth, high margins, and strong returns on capital. The average holding was 18.1 stocks, below the 30-stock target, reflecting the concentrated universe. But the screen never ran dry.
When It Works
2000 (Post Dot-Com Divergence): The portfolio gained 21.4% while the S&P 500 dropped 14.8%. Swiss capital-disciplined companies had no tech-bubble exposure to unwind.
| Year | Portfolio | S&P 500 | Excess |
|---|---|---|---|
| 2000 | +21.4% | -14.8% | +36.2 |
This was the strategy's best excess year. The S&P 500 was cratering as the dot-com bubble burst. Swiss companies that grew assets slowly had nothing to write down. No overpriced acquisitions, no excess capacity from the late-90s buildout. The quality filters ensured these weren't struggling firms. They were profitable businesses that simply didn't chase the expansion cycle. The +36.2 point gap shows what happens when capital discipline meets a bear market.
2006 (Global Growth + Swiss Precision): The portfolio returned 34.8% vs 20.9% for SPY.
| Year | Portfolio | S&P 500 | Excess |
|---|---|---|---|
| 2006 | +34.8% | +20.9% | +13.9 |
| 2009 | +26.2% | +16.0% | +10.2 |
2006 was a strong global year, and Swiss quality names participated fully. The screen selected companies with pricing power (OPM > 10%) and capital efficiency (ROA > 5%) that converted global demand into earnings without expanding their balance sheets. 2009 repeated the pattern on the post-crisis recovery. Companies that held steady through 2008 bounced back ahead of the benchmark.
When It Fails
2022 (Energy Rotation): The portfolio lost 1.1% while the S&P 500 gained 18.1%.
| Year | Portfolio | S&P 500 | Excess |
|---|---|---|---|
| 2022 | -1.1% | +18.1% | -19.2 |
This was the worst relative year. The strategy posted a small loss while SPY surged. 2022 was dominated by the energy trade globally. Switzerland has almost no oil and gas exposure. The SIX is weighted toward pharma, food, and financials. When commodity producers led global markets, Swiss capital-disciplined stocks were on the wrong side of the rotation. The screen did what it's supposed to do, it held quality, but quality wasn't what the market was paying for.
2018 (Strong Dollar, Weak Europe): The portfolio fell 6.3% against SPY's +11.2%.
| Year | Portfolio | S&P 500 | Excess |
|---|---|---|---|
| 2018 | -6.3% | +11.2% | -17.5 |
| 2010 | +17.2% | +33.5% | -16.3 |
Dollar strength and trade war fears hit European equities broadly in 2018. The Swiss Franc's safe-haven status didn't fully insulate the portfolio. 2010 was a different problem: post-crisis recovery momentum. The S&P 500 rallied 33% as high-beta names snapped back. Capital-disciplined Swiss companies participated (+17.2% is a good year), but they couldn't match the momentum-driven benchmark. This is a structural tradeoff. You give back upside in aggressive recoveries in exchange for downside protection during crashes.
Limitations
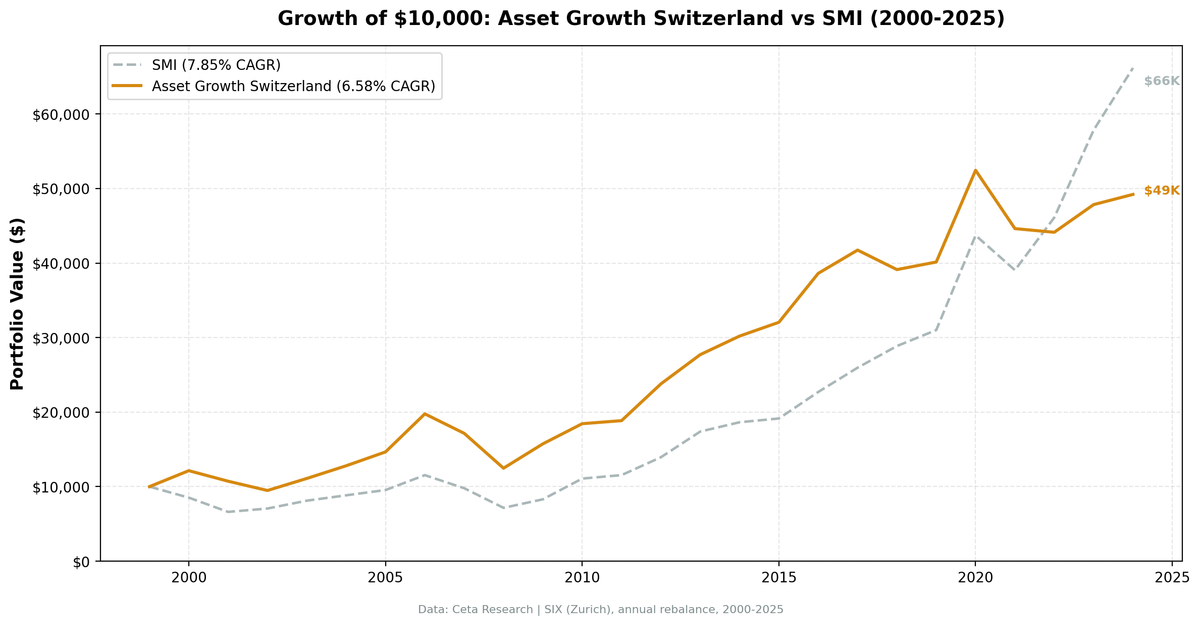
Underperformance on CAGR. The -1.28% annual gap vs SPY is meaningful. Over 25 years, it compounds to a real difference in terminal wealth ($49,075 per $10,000 vs $66,100). The Sharpe (0.386 vs 0.442) and Sortino (0.772 vs 0.847) both trail the benchmark, partly because the low Swiss risk-free rate (0.5%) inflates SPY's risk-adjusted metrics. An investor who cares only about absolute return would have been better off in an S&P 500 index fund. The value proposition here is risk reduction, not return enhancement.
Concentrated market. Three companies dominate the SIX: Nestle, Roche, and Novartis. Together they represent roughly 50% of the Swiss Market Index (SMI). Even with 17.8 stocks on average, the portfolio is heavily influenced by what these mega-caps do. If all three underperform simultaneously, the screen can't diversify its way out. The equal-weight construction helps limit single-stock risk, but sector concentration remains.
CHF/USD currency effects. Returns are computed in Swiss Francs (CHF). The Franc appreciated roughly 40% against the Dollar from 2000 to 2025. For a USD-based investor, the 6.57% CHF CAGR translates to roughly 8-8.5% in Dollar terms, which would nearly match SPY. For a CHF-based investor comparing against a global benchmark, the nominal excess is negative. The direction of the currency effect depends entirely on your base currency. We benchmark against SPY in USD for consistency across our global comparison, so the direct comparison has this built-in distortion.
Small qualifying universe. The average portfolio held 18.1 stocks, well below the 30-stock target. Switzerland's listed equity market is small. After applying the CHF 250M cap floor and quality filters, the pool thins out. Individual stock outcomes carry more weight in an 18-stock portfolio than in a 30-stock one. A single bad pick can move the annual result by 1-2 percentage points.
Index dominated by defensive sectors. Pharma, consumer staples, and financials make up the bulk of the SIX. The asset growth screen in Switzerland naturally loads up on these sectors because they tend to have stable balance sheets. This means the screen's "alpha" is partly a sector bet. In years when cyclicals or growth sectors lead, the portfolio will underperform by construction, not because the signal failed.
Run It Yourself
Run this screen live on Ceta Research
Current Screen (SQL)
WITH bs_current AS (
    SELECT symbol, totalAssets,
        ROW_NUMBER() OVER (PARTITION BY symbol ORDER BY dateEpoch DESC) AS rn
    FROM balance_sheet
    WHERE period = 'FY' AND totalAssets > 0
),
bs_prior AS (
    SELECT symbol, totalAssets AS prior_assets,
        ROW_NUMBER() OVER (PARTITION BY symbol ORDER BY dateEpoch DESC) AS rn
    FROM balance_sheet
    WHERE period = 'FY' AND totalAssets > 0
),
growth AS (
    SELECT bc.symbol,
        (bc.totalAssets - bp.prior_assets) / bp.prior_assets AS asset_growth
    FROM bs_current bc
    JOIN bs_prior bp ON bc.symbol = bp.symbol AND bp.rn = 2
    WHERE bc.rn = 1 AND bp.prior_assets > 0
)
SELECT g.symbol, p.companyName,
    ROUND(g.asset_growth * 100, 2) AS asset_growth_pct,
    ROUND(k.returnOnEquityTTM * 100, 2) AS roe_pct,
    ROUND(k.returnOnAssetsTTM * 100, 2) AS roa_pct,
    ROUND(f.operatingProfitMarginTTM * 100, 2) AS opm_pct,
    ROUND(k.marketCap / 1e9, 2) AS mktcap_bn
FROM growth g
JOIN profile p ON g.symbol = p.symbol
JOIN key_metrics_ttm k ON g.symbol = k.symbol
JOIN financial_ratios_ttm f ON g.symbol = f.symbol
WHERE g.asset_growth < 0.10
  AND g.asset_growth > -0.20
  AND k.returnOnEquityTTM > 0.08
  AND k.returnOnAssetsTTM > 0.05
  AND f.operatingProfitMarginTTM > 0.10
  AND k.marketCap > 250000000
  AND p.exchange = 'SIX'
ORDER BY g.asset_growth ASC
LIMIT 30
Backtest
# Clone the repo
git clone https://github.com/ceta-research/backtests.git
cd backtests

# Run Switzerland backtest
python3 asset-growth/backtest.py --preset switzerland --output results.json --verbose

# Run all exchanges
python3 asset-growth/backtest.py --global --output results/exchange_comparison.json
Takeaway
The asset growth anomaly on SIX-listed Swiss stocks returned 6.57% annually over 25 years. That's 128 basis points below the S&P 500. On a raw-return basis, it loses.
The Sharpe (0.386 vs 0.442) and Sortino (0.772 vs 0.847) both trail the benchmark. That comparison is partly distorted by the low Swiss risk-free rate (0.5%), which inflates SPY's risk-adjusted metrics. Where Switzerland genuinely stands out is downside protection. The 0.663 beta means the portfolio moved about two-thirds as much as the market. Down capture of 50.98%, the lowest of any European exchange we tested, means you avoided roughly half the benchmark's losses while capturing 75% of its gains. The 1.20 alpha confirms the screen picks better stocks on a risk-adjusted basis.
The Swiss market is tailor-made for this strategy. Quality-heavy, defensive-sector-dominant, and full of companies that grow slowly by design. The screen found qualifying stocks in all 25 years, zero cash periods, which is rare for a small exchange. The tradeoff is a concentrated portfolio (18.1 stocks average) in a market dominated by three mega-caps.
Switzerland is the downside-protection play in the asset growth playbook. You won't lead the return table, and the risk-adjusted ratios trail SPY on paper. But the capture ratio asymmetry (75% up, 51% down) and low beta tell the real story. For investors who prioritize not losing money over maximizing gains, this is the strongest European result.
Data: Ceta Research (FMP financial data warehouse), 2000-2025. Universe: SIX (Swiss Exchange). Annual rebalance (July), equal weight, top 30 by lowest asset growth. Returns in CHF unless noted. Full methodology: METHODOLOGY.md. Past performance does not guarantee future results. This is educational content, not investment advice.
References
- Cooper, M., Gulen, H. & Schill, M. (2008). "Asset Growth and the Cross-Section of Stock Returns." Journal of Finance, 63(4), 1609-1651.
- Watanabe, A., Xu, Y., Yao, T. & Yu, T. (2013). "The Asset Growth Effect: Insights from International Equity Markets." Journal of Financial Economics, 108(2), 529-563.
- Hou, K., Xue, C. & Zhang, L. (2015). "Digesting Anomalies: An Investment Approach." Review of Financial Studies, 28(3), 650-705.


