
Asset Growth Anomaly on Swedish Stocks: 6.33% CAGR on Nasdaq Stockholm

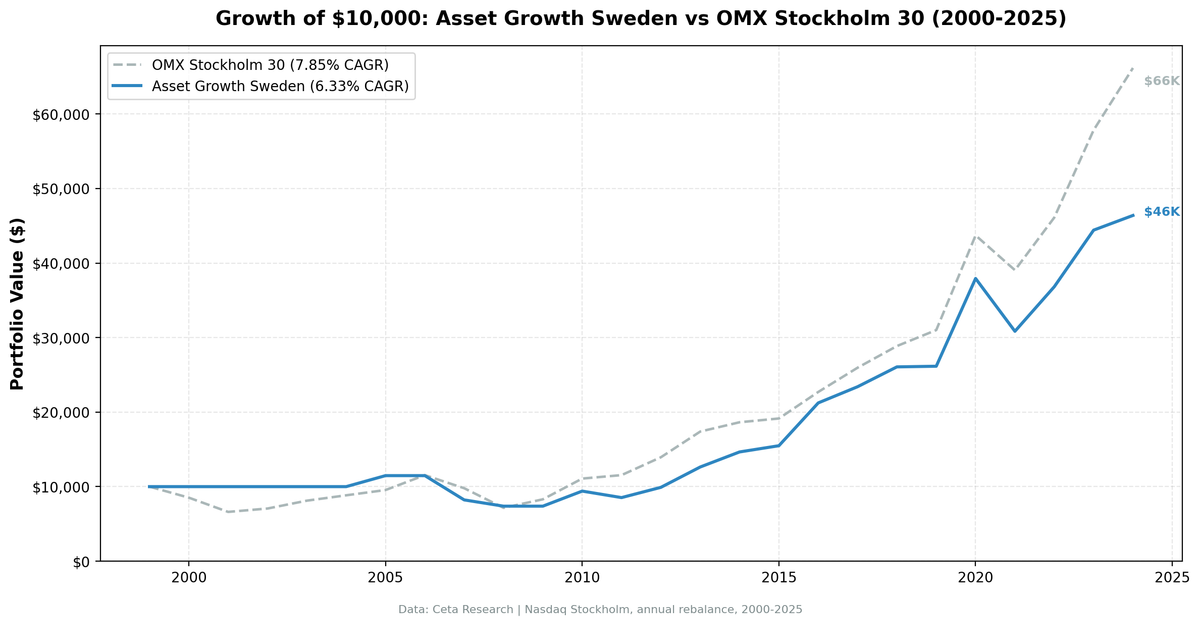
Sweden punches above its weight in equity markets. A population of 10 million, but a stock exchange loaded with globally competitive companies across industrials, tech, healthcare, and consumer goods. We ran the same asset growth anomaly screen that works in the US on Nasdaq Stockholm. The result: 6.33% CAGR over 25 years vs 7.85% for the S&P 500. That -1.52% annual shortfall means the screen doesn't generate positive excess here. But the signal still provided risk reduction, the qualifying pool was decent, and the portfolio's downside capture was meaningfully lower than the benchmark.
Contents
- Method
- Results
- When It Works
- When It Fails
- Limitations
- Run It Yourself
- Current Screen (SQL)
- Backtest
- Takeaway
- Part of a Series
- References
Method
Data source: Ceta Research (FMP financial data warehouse) Universe: STO (Nasdaq Stockholm), market cap > SEK 2.5B (~$230M USD) Period: 2000-2025 (25 annual rebalance periods) Rebalancing: Annual (July), equal weight top 30 by lowest asset growth Benchmark: S&P 500 Total Return (SPY) Regional benchmark: VGK (Vanguard FTSE Europe ETF) Cash rule: Hold cash if fewer than 10 stocks qualify Transaction costs: Size-tiered model (0.1% mega-cap, 0.3% large-cap, 0.5% mid-cap) Data quality guards: Entry price > $1, single-period return capped at 200%
Signal filters:
| Criterion | Metric | Threshold |
|---|---|---|
| Capital discipline | Asset Growth (YoY) | -20% to +10% |
| Profitability | Return on Equity | > 8% |
| Asset efficiency | Return on Assets | > 5% |
| Pricing power | Operating Margin | > 10% |
| Size | Market Cap | > SEK 2.5B (~$230M USD) |
Historical financial data with 45-day lag to prevent look-ahead bias. Full methodology: backtests/METHODOLOGY.md.
For the full screen logic and research background, see the main US Asset Growth post.
Results
| Metric | Portfolio | S&P 500 |
|---|---|---|
| CAGR | 6.33% | 7.85% |
| Total Return | 363.86% | 561% |
| Max Drawdown | -35.69% | -38.01% |
| Volatility | 16.63% | 16.63% |
| Sharpe Ratio | 0.260 | 0.352 |
| Sortino Ratio | 0.532 | 0.628 |
| Win Rate (vs SPY) | 44% | -- |
| Beta | 0.763 | 1.00 |
| Alpha | -0.14 | -- |
| Up Capture | 77.31% | -- |
| Down Capture | 63.63% | -- |
| Cash Periods | 7/25 | -- |
| Avg Stocks | 22.6 | -- |
The headline numbers trail. 6.33% vs 7.85%. Max drawdown is slightly better (-35.69% vs -38.01%). The Sharpe ratio trails the S&P 500 (0.260 vs 0.352). On return, this is a losing proposition.
The capture ratios offer some consolation. Up capture at 77.31% means the portfolio tracked most of the S&P 500's gains during rising markets. Down capture at 63.63% means it avoided about 36% of the losses during declines. The beta of 0.763 confirms the portfolio moves less aggressively than the benchmark. But the alpha of -0.14 tells you the screen doesn't generate meaningful risk-adjusted outperformance on this exchange.
The qualifying pool averaged 22.6 stocks per period, with 7 cash years out of 25. That's a higher cash rate than most exchanges, which mechanically drags down CAGR. Sweden has quality companies, but the local-currency market cap threshold filters more aggressively than the flat USD threshold used in earlier runs.
When It Works
The strategy's best years came during recoveries and periods when capital discipline was rewarded over aggressive expansion.
2016 (Post-Brexit Recovery): European markets stumbled after the Brexit vote, then recovered sharply. The screen's quality-filtered Swedish companies led the bounce.
| Year | Portfolio | S&P 500 | Excess |
|---|---|---|---|
| 2016 | +37.1% | +18.6% | +18.5 |
The portfolio roughly doubled the benchmark's return. Swedish capital-disciplined industrials snapped back as the market realized Brexit's immediate impact on Nordic companies was limited.
2008 (Financial Crisis Protection): The portfolio limited losses during the worst financial crisis in decades.
| Year | Portfolio | S&P 500 | Excess |
|---|---|---|---|
| 2008 | -10.2% | -26.9% | +16.7 |
The portfolio lost 10.2% while the S&P 500 lost 26.9%. That +16.7 point gap is the capital-discipline signal doing exactly what it should: limiting downside when overleveraged companies collapse.
When It Fails
2007 (Pre-Crisis Crash): The worst absolute year in the sample.
| Year | Portfolio | S&P 500 | Excess |
|---|---|---|---|
| 2007 | -28.4% | -15.2% | -13.2 |
The financial crisis hit Swedish banks and financials early. The portfolio dropped 28.4% while SPY fell about half as much. The screen's quality filters didn't protect against a banking-sector-led downturn in a market where banks are a large share of the qualifying universe.
2011 and 2024 (European Stress and Growth-Led Markets): When the Eurozone is under pressure or momentum stocks dominate, the screen's conservative tilt becomes a drag.
| Year | Portfolio | S&P 500 | Excess |
|---|---|---|---|
| 2011 | -9.3% | +4.2% | -13.5 |
| 2024 | +4.4% | +14.4% | -10.0 |
2011 saw the Eurozone sovereign debt crisis drag down all European equities. Sweden wasn't directly in the crosshairs (it's not in the Eurozone), but contagion fears hit Nordic stocks anyway. 2024 shows a more familiar pattern: the US market was driven by a handful of mega-cap tech stocks, and a diversified portfolio of Swedish mid-caps couldn't keep pace.
Limitations
High down capture. At 63.63%, the portfolio absorbs most of the market's losses during declines. Compare this to Canada's 21.94% down capture on the same screen. Sweden's higher down capture means the strategy works more like a "slightly better market" than a true defensive position. The protection is real but modest.
Smaller qualifying universe. With the local-currency market cap threshold, the qualifying pool is thinner than with a flat $500M USD cutoff. Seven cash years out of 25 means the portfolio was uninvested 28% of the time. That cash drag is a meaningful contributor to the CAGR shortfall.
SEK/USD currency effects. Returns are computed in SEK. The Swedish Krona weakened from roughly 9.5 to 10.9 SEK per USD over this period, with significant swings along the way (it touched 7.0 in 2008 and 11.0 in 2023). For a USD-based investor, currency movements add noise to the return comparison. The -1.52% shortfall could narrow or widen depending on the period you measure.
Export sensitivity. About 70% of Swedish large-cap revenue comes from outside Sweden. The screen selects based on balance sheet and profitability metrics, not revenue geography. In practice, these companies' fortunes track global trade flows more than domestic conditions. A global trade slowdown hits this portfolio regardless of how disciplined the balance sheets are.
44% win rate. The strategy won 11 of 25 years on a relative basis. Below coin-flip odds. With a negative alpha, the losing years collectively outweigh the winning years over the full sample. Spending more than half your time behind the benchmark tests patience.
Run It Yourself
Run this screen live on Ceta Research
Current Screen (SQL)
WITH bs_current AS (
    SELECT symbol, totalAssets,
        ROW_NUMBER() OVER (PARTITION BY symbol ORDER BY dateEpoch DESC) AS rn
    FROM balance_sheet
    WHERE period = 'FY' AND totalAssets > 0
),
bs_prior AS (
    SELECT symbol, totalAssets AS prior_assets,
        ROW_NUMBER() OVER (PARTITION BY symbol ORDER BY dateEpoch DESC) AS rn
    FROM balance_sheet
    WHERE period = 'FY' AND totalAssets > 0
),
growth AS (
    SELECT bc.symbol,
        (bc.totalAssets - bp.prior_assets) / bp.prior_assets AS asset_growth
    FROM bs_current bc
    JOIN bs_prior bp ON bc.symbol = bp.symbol AND bp.rn = 2
    WHERE bc.rn = 1 AND bp.prior_assets > 0
)
SELECT g.symbol, p.companyName,
    ROUND(g.asset_growth * 100, 2) AS asset_growth_pct,
    ROUND(k.returnOnEquityTTM * 100, 2) AS roe_pct,
    ROUND(k.returnOnAssetsTTM * 100, 2) AS roa_pct,
    ROUND(f.operatingProfitMarginTTM * 100, 2) AS opm_pct,
    ROUND(k.marketCap / 1e9, 2) AS mktcap_bn
FROM growth g
JOIN profile p ON g.symbol = p.symbol
JOIN key_metrics_ttm k ON g.symbol = k.symbol
JOIN financial_ratios_ttm f ON g.symbol = f.symbol
WHERE g.asset_growth < 0.10
  AND g.asset_growth > -0.20
  AND k.returnOnEquityTTM > 0.08
  AND k.returnOnAssetsTTM > 0.05
  AND f.operatingProfitMarginTTM > 0.10
  AND k.marketCap > 2500000000
  AND p.exchange = 'STO'
ORDER BY g.asset_growth ASC
LIMIT 30
Backtest
# Clone the repo
git clone https://github.com/ceta-research/backtests.git
cd backtests

# Run Sweden backtest
python3 asset-growth/backtest.py --preset sweden --output results.json --verbose

# Run all exchanges
python3 asset-growth/backtest.py --global --output results/exchange_comparison.json
Takeaway
The asset growth anomaly on Nasdaq Stockholm produces a -1.52% annual shortfall with an alpha of -0.14 and a beta of 0.763. The signal doesn't generate positive excess returns here. The higher cash rate (7 of 25 years) from the local-currency market cap threshold is a meaningful drag.
What Sweden shows is that the capital-discipline signal doesn't automatically translate to every well-regulated market. The capture ratio spread (77.31% up, 63.63% down) provides some downside buffer, and the portfolio's max drawdown (-35.69%) is slightly shallower than SPY's (-38.01%). But the 44% win rate and negative alpha mean the risk reduction doesn't compensate for the return shortfall.
This isn't an alpha play. It's a reminder that market cap thresholds matter. Sweden's exchange has quality companies, but the local-currency floor narrows the qualifying universe enough to shift the result from marginal outperformance to marginal underperformance. For investors building a global factor portfolio, Sweden sits in the "near-benchmark" tier alongside Germany and Switzerland.
Part of a Series
This analysis is part of our asset growth anomaly global exchange comparison: - Asset Growth on US Stocks (NYSE + NASDAQ + AMEX), 12.78% CAGR, the baseline - Asset Growth on UK Stocks (LSE), 10.94% CAGR, +9.71% over FTSE 100 - Asset Growth: 16-Exchange Global Comparison, full comparison table
Data: Ceta Research (FMP financial data warehouse), 2000-2025. Universe: STO (Nasdaq Stockholm). Annual rebalance (July), equal weight, top 30 by lowest asset growth. Returns in SEK unless noted. Full methodology: METHODOLOGY.md. Past performance does not guarantee future results. This is educational content, not investment advice.
References
- Cooper, M., Gulen, H. & Schill, M. (2008). "Asset Growth and the Cross-Section of Stock Returns." Journal of Finance, 63(4), 1609-1651.
- Watanabe, A., Xu, Y., Yao, T. & Yu, T. (2013). "The Asset Growth Effect: Insights from International Equity Markets." Journal of Financial Economics, 108(2), 529-563.


