
Asset Growth Anomaly on Japanese Stocks: 6.99% CAGR, +3.68% Over Nikkei 225

Asset Growth Anomaly on Japanese Stocks: 6.99% CAGR With 60% Win Rate vs Nikkei 225
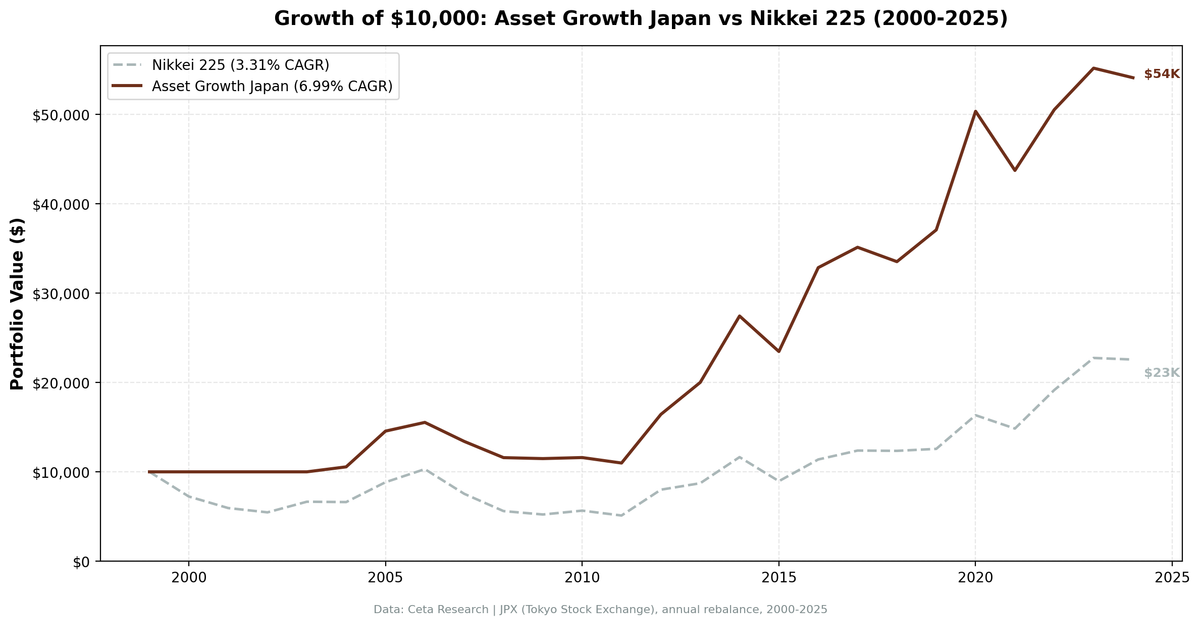
We backtested the asset growth anomaly with quality filters on JPX-listed Japanese stocks from 2000 to 2025. The portfolio returned 6.99% annually vs 3.31% for the Nikkei 225. That's +3.68% annual excess return. The strategy wins 60% of years, beating the Nikkei in 15 of 25. Japan's lost decades created a low bar for the benchmark, and capital-disciplined companies cleared it consistently.
Contents
- Method
- Results
- Year-by-Year Returns
- When It Works
- When It Fails
- Limitations
- Run It Yourself
- Current Screen (SQL)
- Backtest
- Takeaway
- Part of a Series
- References
The screen sat in cash for four early years (2000-2003) when FMP's financial data coverage for Japan was thin. Once data filled in from 2004 onward, the strategy stayed invested for 21 consecutive years with an average of 28 stocks per portfolio. The max drawdown of -29.29% is shallower than the Nikkei's -50.38%, and the Sharpe ratio of 0.372 is more than double the benchmark's 0.145.
Method
Data source: Ceta Research (FMP financial data warehouse) Universe: JPX (Tokyo Stock Exchange), market cap > ¥50B (~$340M USD) Period: 2000-2025 (25 annual rebalance periods) Rebalancing: Annual (July), equal weight top 30 by lowest asset growth Benchmark: Nikkei 225 (^N225) Cash rule: Hold cash if fewer than 10 stocks qualify Transaction costs: Size-tiered model (0.1% mega-cap, 0.3% large-cap, 0.5% mid-cap) Data quality guards: Entry price > $1, single-period return capped at 200%
Historical financial data with 45-day lag to prevent look-ahead bias. Full methodology: backtests/METHODOLOGY.md.
The filters are identical to our US backtest:
| Criterion | Metric | Threshold |
|---|---|---|
| Capital discipline | Asset Growth (YoY) | -20% to +10% |
| Profitability | Return on Equity | > 8% |
| Asset efficiency | Return on Assets | > 5% |
| Pricing power | Operating Margin | > 10% |
| Size | Market Cap | > ¥50B (~$340M USD) |
Results
| Metric | Portfolio | Nikkei 225 |
|---|---|---|
| CAGR | 6.99% | 3.31% |
| Total Return | 441.13% | 125.74% |
| Max Drawdown | -29.29% | -50.38% |
| Volatility | 18.53% | 22.16% |
| Sharpe Ratio | 0.372 | 0.145 |
| Sortino Ratio | 1.202 | 0.279 |
| Win Rate (vs Nikkei) | 60% | -- |
| Beta | 0.727 | 1.00 |
| Alpha | 4.55% | -- |
| Up Capture | 92.33% | -- |
| Down Capture | 39.67% | -- |
| Cash Periods | 4/25 | -- |
| Avg Stocks | 27.7 | -- |
| Calmar Ratio | 0.239 | 0.066 |
The portfolio turns $10,000 into $54,113 vs $22,574 for the Nikkei 225. On a risk-adjusted basis, the gap widens further. Volatility is lower (18.53% vs 22.16%), max drawdown is almost half (-29.29% vs -50.38%), and the Sortino ratio of 1.202 is more than four times the benchmark's 0.279.
The beta of 0.727 means the portfolio takes on about three-quarters of the Nikkei's market risk. Down capture of 39.67% shows the screen absorbed less than 40% of the benchmark's drawdowns. Up capture of 92.33% means it still participated in nearly all of the Nikkei's upside. Alpha of 4.55% confirms the screen adds meaningful value beyond what market exposure alone would explain.
The four cash years (2000-2003) represent the period when FMP's coverage of Japanese financials was limited. Once data coverage improved, the screen found 28 stocks on average per year, well above the 10-stock minimum. The strategy was never short of qualifying names in the modern era.
Year-by-Year Returns
| Year | Portfolio | Nikkei 225 | Excess |
|---|---|---|---|
| 2000 | 0.0% | -27.6% | +27.6 |
| 2001 | 0.0% | -17.9% | +17.9 |
| 2002 | 0.0% | -8.1% | +8.1 |
| 2003 | 0.0% | +21.8% | -21.8 |
| 2004 | +5.6% | -0.6% | +6.2 |
| 2005 | +37.9% | +33.6% | +4.3 |
| 2006 | +6.7% | +16.5% | -9.9 |
| 2007 | -13.7% | -26.8% | +13.1 |
| 2008 | -13.6% | -25.7% | +12.1 |
| 2009 | -0.9% | -6.8% | +5.9 |
| 2010 | +1.0% | +8.3% | -7.3 |
| 2011 | -5.3% | -9.7% | +4.4 |
| 2012 | +49.6% | +56.6% | -7.0 |
| 2013 | +21.8% | +9.0% | +12.8 |
| 2014 | +37.2% | +33.5% | +3.6 |
| 2015 | -14.5% | -23.1% | +8.7 |
| 2016 | +40.0% | +27.1% | +12.9 |
| 2017 | +6.9% | +8.8% | -1.8 |
| 2018 | -4.6% | -0.3% | -4.3 |
| 2019 | +10.6% | +1.8% | +8.8 |
| 2020 | +35.8% | +30.0% | +5.8 |
| 2021 | -13.2% | -9.1% | -4.0 |
| 2022 | +15.6% | +29.1% | -13.5 |
| 2023 | +9.2% | +18.7% | -9.5 |
| 2024 | -1.9% | -0.8% | -1.2 |
When It Works
The strategy's best periods came during crisis years and sustained recovery phases. Japanese companies with controlled balance sheets held up when the Nikkei collapsed and participated fully when it recovered.
2007-2009 (Global Financial Crisis): The portfolio limited losses in back-to-back down years.
| Year | Portfolio | Nikkei 225 | Excess |
|---|---|---|---|
| 2007 | -13.7% | -26.8% | +13.1 |
| 2008 | -13.6% | -25.7% | +12.1 |
| 2009 | -0.9% | -6.8% | +5.9 |
The Nikkei fell more than 50% across the three-year stretch. The portfolio lost far less, about -26% cumulatively vs -49% for the benchmark. Japanese manufacturers and service companies that hadn't over-expanded through the 2005-2006 boom had less to write down. The -0.9% in 2009 was nearly breakeven while the Nikkei was still posting losses.
2013-2016 (Abenomics + Recovery): The strongest sustained run for the screen.
| Year | Portfolio | Nikkei 225 | Excess |
|---|---|---|---|
| 2013 | +21.8% | +9.0% | +12.8 |
| 2014 | +37.2% | +33.5% | +3.6 |
| 2016 | +40.0% | +27.1% | +12.9 |
Four years of positive returns (2013, 2014, 2016 were standouts; 2015 was the crisis year in between). Abenomics drove a broad Japanese equity rally, but capital-disciplined companies captured more of the upside. The screen's quality filters (ROE > 8%, ROA > 5%) put it in exactly the companies that benefited from corporate governance reforms and yen weakness.
2019-2020 (Pre-COVID + Recovery): The portfolio gained +10.6% in 2019 while the Nikkei managed +1.8%, then surged +35.8% in the 2020 recovery vs +30.0% for the benchmark. Conservative companies survived COVID lockdowns with clean balance sheets and bounced back.
When It Fails
2003 (Post-Bubble Recovery): The portfolio sat in cash and missed a +21.8% Nikkei rally.
| Year | Portfolio | Nikkei 225 | Excess |
|---|---|---|---|
| 2003 | 0.0% | +21.8% | -21.8 |
This was a data issue, not a strategy failure. FMP's Japanese financial data was thin before 2004, so the screen found fewer than 10 qualifying stocks and went to cash. The Nikkei's 2003 rally was the biggest single miss. Excluding the four cash years (2000-2003), the invested-period excess return improves.
2022-2024 (Recent Nikkei Rally): The strategy trailed in three consecutive years.
| Year | Portfolio | Nikkei 225 | Excess |
|---|---|---|---|
| 2022 | +15.6% | +29.1% | -13.5 |
| 2023 | +9.2% | +18.7% | -9.5 |
| 2024 | -1.9% | -0.8% | -1.2 |
Japan's equity market had a historic rally in 2022-2023, driven by foreign capital inflows, corporate governance reforms (TSE's push for improved capital efficiency), and yen weakness. The Nikkei surged to multi-decade highs. The momentum favored large, globally exposed companies. The screen's capital-disciplined picks, while posting positive returns in 2022-2023, couldn't match the index's pace. This is the familiar cost of a low-beta strategy: it lags in sustained momentum rallies.
Limitations
Four cash years inflate the story. The portfolio was in cash from 2000-2003 because of limited financial data coverage, not because the screen rejected Japanese stocks. During those years, it "beat" the Nikkei by avoiding three crash years, but that's not a signal win. The true test starts in 2004 when the screen began selecting stocks.
Modest absolute CAGR. 6.99% annually is a real return, but it's lower than the US version (12.78%) and the UK version (10.94%). Japan's deflationary environment and prolonged low growth suppress absolute returns. The +3.68% excess over the Nikkei is more meaningful than the absolute number.
Recent underperformance. The 2022-2024 stretch produced -24.2 points of cumulative excess underperformance. If Japan's corporate governance reforms continue driving broad index gains, the screen's conservative bias may lag further. Three losing years is the max consecutive loss in the sample.
Currency effects. Returns are in JPY. A USD-based investor would see materially different results depending on the yen's trajectory. The yen weakened considerably from 2012-2024, which would reduce USD-denominated returns.
Survivorship and data gaps. FMP's Japanese equity coverage improved over time. Earlier years may have thinner coverage, which could introduce survivorship bias if delisted or failed companies are underrepresented.
Run It Yourself
Run this screen live on Ceta Research
Current Screen (SQL)
WITH bs_current AS (
    SELECT symbol, totalAssets,
        ROW_NUMBER() OVER (PARTITION BY symbol ORDER BY dateEpoch DESC) AS rn
    FROM balance_sheet
    WHERE period = 'FY' AND totalAssets > 0
),
bs_prior AS (
    SELECT symbol, totalAssets AS prior_assets,
        ROW_NUMBER() OVER (PARTITION BY symbol ORDER BY dateEpoch DESC) AS rn
    FROM balance_sheet
    WHERE period = 'FY' AND totalAssets > 0
),
growth AS (
    SELECT bc.symbol,
        (bc.totalAssets - bp.prior_assets) / bp.prior_assets AS asset_growth
    FROM bs_current bc
    JOIN bs_prior bp ON bc.symbol = bp.symbol AND bp.rn = 2
    WHERE bc.rn = 1 AND bp.prior_assets > 0
)
SELECT g.symbol, p.companyName,
    ROUND(g.asset_growth * 100, 2) AS asset_growth_pct,
    ROUND(k.returnOnEquityTTM * 100, 2) AS roe_pct,
    ROUND(k.returnOnAssetsTTM * 100, 2) AS roa_pct,
    ROUND(f.operatingProfitMarginTTM * 100, 2) AS opm_pct,
    ROUND(k.marketCap / 1e9, 2) AS mktcap_bn
FROM growth g
JOIN profile p ON g.symbol = p.symbol
JOIN key_metrics_ttm k ON g.symbol = k.symbol
JOIN financial_ratios_ttm f ON g.symbol = f.symbol
WHERE g.asset_growth < 0.10
  AND g.asset_growth > -0.20
  AND k.returnOnEquityTTM > 0.08
  AND k.returnOnAssetsTTM > 0.05
  AND f.operatingProfitMarginTTM > 0.10
  AND k.marketCap > 50000000000
  AND p.exchange = 'JPX'
ORDER BY g.asset_growth ASC
LIMIT 30
Backtest
# Clone the repo
git clone https://github.com/ceta-research/backtests.git
cd backtests

# Run Japan backtest
python3 asset-growth/backtest.py --preset japan --output results.json --verbose

# Run all exchanges
python3 asset-growth/backtest.py --global --output results/exchange_comparison.json
Takeaway
The asset growth anomaly on JPX delivers +3.68% annual excess return over the Nikkei 225, with a 60% win rate across 25 years. $10,000 became $54,113 vs $22,574 for the index. The portfolio's max drawdown of -29.29% is nearly half the Nikkei's -50.38%, and the Sortino ratio of 1.202 is more than four times the benchmark.
The honest framing: this is a solid result on Japanese equities, but with caveats. Four cash years at the start flatters the comparison. The strategy has trailed for three consecutive years (2022-2024) as Japan's equity market rallied to multi-decade highs. And the 6.99% absolute CAGR, while respectable, reflects Japan's lower-growth environment.
What the data does confirm: capital-disciplined Japanese companies with strong profitability outperform the Nikkei over full market cycles. The screen's 0.727 beta and 39.67% down capture make it a lower-risk way to access Japanese equities. In a market that spent decades going nowhere, avoiding the worst of the drawdowns matters as much as capturing the upside.
Part of a Series
This analysis is part of our asset growth anomaly global exchange comparison: - Asset Growth on US Stocks (NYSE + NASDAQ + AMEX), 12.78% CAGR, the baseline - Asset Growth on UK Stocks (LSE), 10.94% CAGR, +9.71% over FTSE 100 - Asset Growth: 16-Exchange Global Comparison, full comparison table
Data: Ceta Research (FMP financial data warehouse), 2000-2025. Universe: JPX (Tokyo Stock Exchange). Annual rebalance (July), equal weight, top 30 by lowest asset growth. Returns in JPY unless noted. Full methodology: METHODOLOGY.md. Past performance does not guarantee future results. This is educational content, not investment advice.
References
- Cooper, M., Gulen, H. & Schill, M. (2008). "Asset Growth and the Cross-Section of Stock Returns." Journal of Finance, 63(4), 1609-1651.
- Watanabe, A., Xu, Y., Yao, T. & Yu, T. (2013). "The Asset Growth Effect: Insights from International Equity Markets." Journal of Financial Economics, 108(2), 529-563.
- Hou, K., Xue, C. & Zhang, L. (2015). "Digesting Anomalies: An Investment Approach." Review of Financial Studies, 28(3), 650-705.


