
Asset Growth Anomaly on Indian Stocks: 14.30% CAGR Over 20 Invested Years

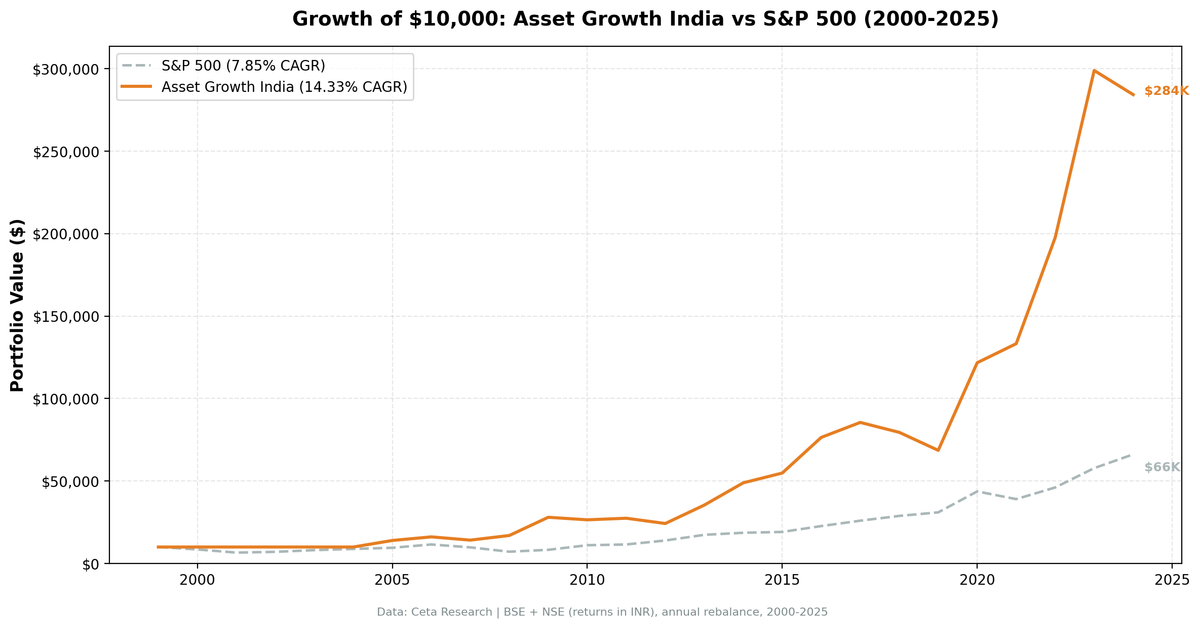
We backtested the asset growth anomaly with quality filters on BSE and NSE from 2000 to 2025. The portfolio returned 14.30% annually vs 12.06% for the Sensex. That +2.25% annual excess held up across India's boom-bust cycles, with the strongest outperformance during post-crisis recoveries. The first five years were dead weight. Data coverage for Indian large-caps was thin before 2005, so the portfolio sat in cash. Once coverage improved, the signal kicked in. The excess over Sensex is modest compared to our earlier SPY comparison (+6.76%), which inflated apparent alpha by comparing INR returns against a USD benchmark. Measured against the right benchmark, the signal still adds value. Capital discipline works in India. The path is just bumpier.
Contents
- Method
- Results
- When It Works
- When It Fails
- Limitations
- Run It Yourself
- Current Screen (SQL)
- Backtest
- Takeaway
- References
Method
Data source: Ceta Research (FMP financial data warehouse) Universe: BSE + NSE (India), market cap > ₹10B (~$120M USD) Period: 2000-2025 (25 annual rebalance periods) Rebalancing: Annual (July), equal weight top 30 by lowest asset growth Benchmark: Sensex (BSE index, INR) Cash rule: Hold cash if fewer than 10 stocks qualify Transaction costs: Size-tiered model (0.1% mega-cap, 0.3% large-cap, 0.5% mid-cap) Data quality guards: Entry price > $1, single-period return capped at 200%
Signal filters: - Asset Growth (YoY): -20% to +10% - ROE > 8% - ROA > 5% - Operating Margin > 10%
Historical financial data with 45-day lag to prevent look-ahead bias. Full methodology: backtests/METHODOLOGY.md
For the full screen logic and research background, see the main US Asset Growth post.
Results
| Metric | Portfolio | Sensex |
|---|---|---|
| CAGR | 14.30% | 12.06% |
| Total Return | 2,728% | 1,622% |
| Max Drawdown | -19.79% | -32.20% |
| Volatility | 26.12% | 19.59% |
| Sharpe Ratio | 0.299 | 0.284 |
| Sortino Ratio | 0.924 | 0.600 |
| Calmar Ratio | 0.723 | -- |
| Win Rate (vs Sensex) | 52% | -- |
| Beta | 0.679 | 1.00 |
| Alpha | 4.03% | -- |
| Up Capture | 107.37% | -- |
| Down Capture | 16.9% | -- |
| Cash Periods | 5 / 25 | -- |
| Avg Stocks | 24.1 | -- |
The portfolio returned 14.30% CAGR against 12.06% for the Sensex. That +2.25% annual excess is modest, but it compounds. $10,000 grew to roughly $282,800 in the portfolio vs $172,200 in the Sensex. Not a blowout, but meaningful over 25 years.
The risk picture is favorable. The portfolio's volatility at 26.12% sits above the Sensex's 19.59%. That's partly the mid-cap tilt showing through. But the max drawdown is much shallower (-19.79% vs -32.20%), and the beta of 0.679 means the portfolio moves at roughly two-thirds the market's intensity. The Sharpe of 0.299 is nearly identical to the Sensex's 0.284. The Sortino at 0.924 is well above the Sensex's 0.600, because most of the portfolio's vol is on the upside.
The capture ratios tell the real story. Up capture of 107.37% and down capture of just 16.9%. The portfolio participates in rallies and largely sits out the crashes. That's the capital-discipline signal working as designed.
When It Works
2009 (Post-GFC Recovery): The strategy's best year on a relative basis. The portfolio returned +65.1% vs +19.1% for the Sensex.
| Year | Portfolio | Sensex | Excess |
|---|---|---|---|
| 2009 | +65.1% | +19.1% | +46.0% |
| 2020 | +77.4% | +46.4% | +31.0% |
Companies that hadn't overextended their balance sheets before the crisis recovered faster when markets snapped back. The screen loaded up on profitable, conservatively-managed Indian businesses. They had less to write down and more room to grow into the recovery.
2014 and 2023 (India Premium): Two standout years. In 2014 the portfolio gained +38.1% vs +8.1% for the Sensex (+30.0% excess). In 2023, +51.3% vs +21.8% (+29.4% excess).
| Year | Portfolio | Sensex | Excess |
|---|---|---|---|
| 2023 | +51.3% | +21.8% | +29.4% |
| 2014 | +38.1% | +8.1% | +30.0% |
India's manufacturing policy (PLI schemes), expanding consumer market, and improving market depth all favored capital-disciplined companies. Foreign institutional investors piled into high-quality Indian names. The screen was perfectly positioned for both rallies.
When It Fails
2012 (Market Rotates Away): The worst single year on a relative basis. The portfolio lost -12.2% while the Sensex gained +11.9%.
| Year | Portfolio | Sensex | Excess |
|---|---|---|---|
| 2012 | -12.2% | +11.9% | -24.0% |
| 2006 | +15.6% | +37.1% | -21.5% |
| 2018 | -7.0% | +12.9% | -19.9% |
2012 saw a broad rally that favored growth stocks over capital-disciplined ones. The screen's conservative tilt missed the aggressive re-rating. This is the same pattern seen in the US backtest during mega-cap-led markets: the signal doesn't add value when investors reward expansion.
2018-2019 (Shadow Banking Crisis): India's IL&FS collapse and the resulting shadow banking stress hammered mid-cap Indian stocks. The portfolio returned -7.0% in 2018 and -13.7% in 2019, while the Sensex posted +12.9% and -10.0% respectively. The screen's quality filters didn't prevent losses when the entire Indian mid-cap segment sold off indiscriminately.
Limitations
Early data gaps. Five of 25 periods were cash (2000-2004). FMP data coverage for Indian companies was thin before 2005. The 14.30% CAGR includes these dead years, which suppresses the headline number. Active returns only started in 2005.
High volatility. 26.12% annualized, above the Sensex's 19.59%. The portfolio's mid-cap tilt adds structural volatility on top of India's already-volatile market. The Sharpe ratio of 0.299 reflects this. You're getting paid, but the ride is rough.
Currency effects. Both the portfolio and the Sensex benchmark are denominated in INR, so the primary comparison is currency-neutral. If you're a USD-based investor, the INR/USD rate moved from roughly 43 in 2000 to roughly 84 in 2024, which would reduce returns by about 2.7% annually when converted to dollars. But the +2.25% excess over Sensex is unaffected by currency.
Survivorship bias. Exchange membership uses current company profiles, not historical. Companies that delisted from BSE or NSE over the past 25 years aren't captured. India's exchange landscape was different in the early 2000s.
Liquidity and transaction costs. Some BSE-listed stocks passing the screen have thin trading volumes. The backtest assumes execution at closing prices. Real-world slippage on Indian mid-caps can be material. India's Securities Transaction Tax (STT) and short-term capital gains tax aren't modeled.
Run It Yourself
Run this screen live on Ceta Research
Current Screen (SQL)
WITH bs_current AS (
    SELECT symbol, totalAssets,
        ROW_NUMBER() OVER (PARTITION BY symbol ORDER BY dateEpoch DESC) AS rn
    FROM balance_sheet
    WHERE period = 'FY' AND totalAssets > 0
),
bs_prior AS (
    SELECT symbol, totalAssets AS prior_assets,
        ROW_NUMBER() OVER (PARTITION BY symbol ORDER BY dateEpoch DESC) AS rn
    FROM balance_sheet
    WHERE period = 'FY' AND totalAssets > 0
),
growth AS (
    SELECT bc.symbol,
        (bc.totalAssets - bp.prior_assets) / bp.prior_assets AS asset_growth
    FROM bs_current bc
    JOIN bs_prior bp ON bc.symbol = bp.symbol AND bp.rn = 2
    WHERE bc.rn = 1 AND bp.prior_assets > 0
)
SELECT g.symbol, p.companyName,
    ROUND(g.asset_growth * 100, 2) AS asset_growth_pct,
    ROUND(k.returnOnEquityTTM * 100, 2) AS roe_pct,
    ROUND(k.returnOnAssetsTTM * 100, 2) AS roa_pct,
    ROUND(f.operatingProfitMarginTTM * 100, 2) AS opm_pct,
    ROUND(k.marketCap / 1e9, 2) AS mktcap_bn
FROM growth g
JOIN profile p ON g.symbol = p.symbol
JOIN key_metrics_ttm k ON g.symbol = k.symbol
JOIN financial_ratios_ttm f ON g.symbol = f.symbol
WHERE g.asset_growth < 0.10
  AND g.asset_growth > -0.20
  AND k.returnOnEquityTTM > 0.08
  AND k.returnOnAssetsTTM > 0.05
  AND f.operatingProfitMarginTTM > 0.10
  AND k.marketCap > 10000000000
  AND p.exchange IN ('BSE', 'NSE')
ORDER BY g.asset_growth ASC
LIMIT 30
Backtest
# Clone the repo
git clone https://github.com/ceta-research/backtests.git
cd backtests

# Run India backtest
python3 asset-growth/backtest.py --preset india --output results.json --verbose

# Run all exchanges
python3 asset-growth/backtest.py --global --output results/exchange_comparison.json
Takeaway
The asset growth anomaly produces +2.25% annual excess return over the Sensex on Indian exchanges over 25 years. The signal is the same one that works in the US: buy profitable companies that grow their balance sheets slowly. Measured against the correct local benchmark, the alpha is smaller than the US result (+2.25% vs +4.84%), but the portfolio's downside protection is striking: -19.79% max drawdown vs -32.20% for the Sensex.
The strategy's value is cyclical. It crushes during post-crisis recoveries (2009: +46.0% excess, 2020: +31.0% excess) and struggles during growth-favoring rotations (2012: -24.0% excess). The 52% win rate and 0.679 beta make it a reasonable factor tilt for Indian equities, but the 26.12% volatility means you need to hold through drawdowns that would make most investors quit.
Don't expect a smooth ride. Expect capital discipline to compound over decades, with long stretches of pain in between.
Data: Ceta Research (FMP financial data warehouse), 2000-2025. Universe: BSE + NSE (India). Annual rebalance (July), equal weight, top 30 by lowest asset growth. Returns in INR unless noted. Past performance does not guarantee future results. This is educational content, not investment advice.
References
- Cooper, M., Gulen, H. & Schill, M. (2008). "Asset Growth and the Cross-Section of Stock Returns." Journal of Finance, 63(4), 1609-1651.
- Watanabe, A., Xu, Y., Yao, T. & Yu, T. (2013). "The Asset Growth Effect: Insights from International Equity Markets." Journal of Financial Economics, 108(2), 529-563.


