
Asset Growth Anomaly on Brazilian Stocks: 10.57% CAGR With a -9.6% Max Drawdown

Asset Growth Anomaly on Brazilian Stocks: 10.6% CAGR With a -9.6% Max Drawdown
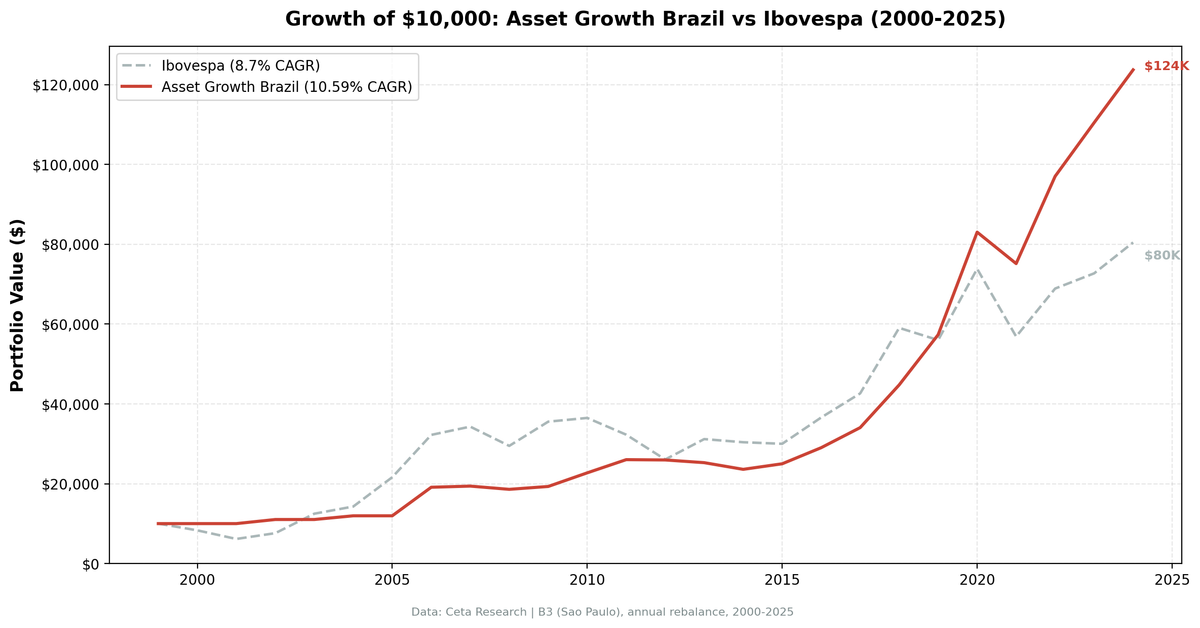
We backtested the asset growth anomaly with quality filters on Brazil's SAO exchange from 2000 to 2025. The portfolio returned 10.57% annually vs 8.70% for the Bovespa. That +1.87% excess is modest, but the real story is the drawdown. The max drawdown was -9.61%, compared to -38.45% for the Bovespa. That's the best of any exchange we tested, across 16 markets worldwide. In a country where the Ibovespa routinely swings 30-50% in a year, a single-digit max drawdown is the kind of number you read twice.
Contents
- Method
- The Screen
- Filters
- Results
- When It Works
- When It Fails
- Limitations
- Run It Yourself
- Current Screen (SQL)
- Backtest
- Takeaway
- References
Method
Data source: Ceta Research (FMP financial data warehouse) Universe: SAO (Sao Paulo), market cap > R$500M (~$100M USD) Period: 2000-2025 (25 annual rebalance periods) Rebalancing: Annual (July), equal weight top 30 by lowest asset growth Benchmark: Bovespa (^BVSP) Cash rule: Hold cash if fewer than 10 stocks qualify Transaction costs: Size-tiered model (0.1% mega-cap, 0.3% large-cap, 0.5% mid-cap) Data quality guards: Entry price > $1, single-period return capped at 200%
Historical financial data with 45-day lag to prevent look-ahead bias. Full methodology: backtests/METHODOLOGY.md
The Screen
Filters
| Criterion | Metric | Threshold | Why |
|---|---|---|---|
| Capital discipline | Asset Growth (YoY) | -20% to +10% | Low growth, not distressed |
| Profitability | Return on Equity | > 8% | Business generates real returns |
| Asset efficiency | Return on Assets | > 5% | Assets are productive |
| Pricing power | Operating Margin | > 10% | Operational efficiency |
| Size | Market Cap | > R$500M (~$100M USD) | Reliable data, investable |
The quality filters are critical in Brazil. Without them, you'd pick up state-controlled companies shrinking due to political interference, not capital discipline. The ROE and ROA gates ensure the company is shrinking by choice, not by force.
Results
| Metric | Portfolio | Bovespa |
|---|---|---|
| CAGR | 10.57% | 8.70% |
| Total Return | 1,133% | 705% |
| Max Drawdown | -9.61% | -38.45% |
| Volatility | 16.62% | 23.94% |
| Sharpe Ratio | 0.004 | -0.075 |
| Sortino Ratio | 0.008 | -0.118 |
| Calmar Ratio | 1.10 | 0.226 |
| Win Rate (vs Bovespa) | 60% | -- |
| Beta | 0.306 | 1.00 |
| Alpha | 0.62% | -- |
| Up Capture | 66.16% | -- |
| Down Capture | -23.40% | -- |
| Cash Periods | 4/25 | -- |
| Avg Stocks | 20.8 | -- |
Start with the drawdown. -9.61% max drawdown vs -38.45% for the Bovespa. Brazilian equities are among the most volatile in the world, and this screen held its max loss under 10% while the local index dropped nearly 4x as much.
The Calmar ratio tells the story cleanly. At 1.10, the portfolio earned 1.10 units of return per unit of worst-case drawdown. The Bovespa's Calmar was 0.226. The strategy delivered 4.9x the return-per-drawdown ratio.
The Sharpe ratio is near zero (0.004). That looks bad in isolation. It's not. Brazil's risk-free rate averaged well above 10% for much of this period (the Selic rate hit 26% in 2003). When your risk-free alternative pays 10-15%, a 10.6% equity return doesn't look great on a Sharpe basis. But the Sharpe doesn't capture the drawdown story. The Bovespa's Sharpe was -0.075, so even by this metric the portfolio came out ahead. A strategy with 10.6% CAGR and a -9.6% max drawdown in an emerging market is doing something right.
The capture ratios explain the mechanics. Up capture: 66.16%. The portfolio captured two-thirds of the Bovespa's upside. Down capture: -23.40%. It didn't just avoid the downside, it moved in the opposite direction during Bovespa drawdowns. That asymmetry is how you get a -9.6% max drawdown in a market that regularly drops 30%+.
When It Works
2008 (Global Financial Crisis): The Bovespa fell 14.1%. The portfolio lost just 4.2%.
| Year | Portfolio | Bovespa | Excess |
|---|---|---|---|
| 2008 | -4.2% | -14.1% | +9.9% |
Brazilian stocks were hit hard during the crisis. Commodity prices collapsed, the Real weakened, and foreign capital fled. But the companies in this screen had clean balance sheets, low asset growth, and strong margins. They didn't need to sell assets or raise dilutive capital. They held steady while leveraged growers got wiped out.
2011 (Domestic Slowdown): The Bovespa dropped 11.5%. The portfolio returned +14.6%.
| Year | Portfolio | Bovespa | Excess |
|---|---|---|---|
| 2011 | +14.6% | -11.5% | +26.1% |
Growth was stalling and the Bovespa sold off, but capital-disciplined companies with strong margins held up. The quality filters selected companies that didn't need a bull market to generate returns.
2019 (Pension Reform Rally): The portfolio returned +28.1% while the Bovespa fell 5.2%.
| Year | Portfolio | Bovespa | Excess |
|---|---|---|---|
| 2019 | +28.1% | -5.2% | +33.3% |
Disciplined companies with strong fundamentals rallied hard while the broader index struggled. Low asset growth meant these companies weren't overextending into new capacity. They collected the upside without betting on it lasting forever.
When It Fails
2003 (Post-Crisis Recovery): The portfolio was in cash while the Bovespa surged 64.2%.
| Year | Portfolio | Bovespa | Excess |
|---|---|---|---|
| 2003 | 0.0% | +64.2% | -64.2% |
Too few stocks passed the quality filters, so the portfolio sat in cash during one of Brazil's strongest rally years. The Bovespa more than doubled off its lows and the strategy missed all of it.
2013 (Brazil's Lost Year): The portfolio returned -2.9% while the Bovespa gained 19.6%.
| Year | Portfolio | Bovespa | Excess |
|---|---|---|---|
| 2013 | -2.9% | +19.6% | -22.5% |
2013 was a mixed year for Brazilian equities. The "taper tantrum" hammered sentiment, the Real weakened sharply, and domestic growth stalled. But the Bovespa still posted a solid gain while the quality-screened portfolio declined. The quality filters didn't help because the companies that rallied were the high-growth names the screen explicitly avoids.
2005 (Bull Market Miss): Another cash year while the Bovespa returned +51.4%.
| Year | Portfolio | Bovespa | Excess |
|---|---|---|---|
| 2005 | 0.0% | +51.4% | -51.4% |
The same pattern as 2003. Not enough qualifying stocks, so the portfolio sat idle during a massive Bovespa rally. Cash periods are the strategy's biggest cost. When the local market runs hard, missing out entirely hurts more than modest underperformance would.
Limitations
AdjClose data quality. SAO has known adjClose issues in the FMP dataset. Some stocks show extreme price ratios that don't reflect real returns. We apply two guards: a 200% single-return cap and a $1 minimum entry price. These handle the worst artifacts, but some noise likely remains in early-period data.
Currency effects. Both the portfolio and the Bovespa are denominated in BRL, so the comparison is apples-to-apples. For a USD-based investor, the Real depreciated roughly 70% against the Dollar over the test period, which would erode absolute returns in Dollar terms. But the excess return over the Bovespa holds regardless of currency, since both sides of the comparison are in the same denomination.
Small qualifying universe. The average portfolio held 20.8 stocks. That's well below the 30-stock target. Brazil's equity market is concentrated. A handful of large companies (Petrobras, Vale, Itau, Ambev) dominate the index. After applying quality filters and the R$500M market cap floor, the qualifying pool is thin. Four of the 25 periods went to cash entirely because fewer than 10 stocks qualified.
High cash periods. Four cash years out of 25 is significant. The 10.57% CAGR includes these zero-return years. When the portfolio was invested (21 out of 25 years), the effective return was higher. But an investor following this strategy would have sat idle 16% of the time, which requires patience.
Survivorship and index composition. We use current SAO exchange membership, not historical. Companies that delisted or were acquired aren't in the backtest universe. This could introduce survivorship bias, though the quality filters partially mitigate it by selecting companies that were already stable.
Political and regulatory risk. Brazil's market is heavily influenced by political cycles. Elections, state intervention in Petrobras and Eletrobras, sudden regulatory changes. These risks aren't captured by balance sheet metrics. A company can have perfect capital discipline and still get hit by a government decree.
Run It Yourself
Run this screen live on Ceta Research
Current Screen (SQL)
WITH bs_current AS (
    SELECT symbol, totalAssets,
        ROW_NUMBER() OVER (PARTITION BY symbol ORDER BY dateEpoch DESC) AS rn
    FROM balance_sheet
    WHERE period = 'FY' AND totalAssets > 0
),
bs_prior AS (
    SELECT symbol, totalAssets AS prior_assets,
        ROW_NUMBER() OVER (PARTITION BY symbol ORDER BY dateEpoch DESC) AS rn
    FROM balance_sheet
    WHERE period = 'FY' AND totalAssets > 0
),
growth AS (
    SELECT bc.symbol,
        (bc.totalAssets - bp.prior_assets) / bp.prior_assets AS asset_growth
    FROM bs_current bc
    JOIN bs_prior bp ON bc.symbol = bp.symbol AND bp.rn = 2
    WHERE bc.rn = 1 AND bp.prior_assets > 0
)
SELECT g.symbol, p.companyName,
    ROUND(g.asset_growth * 100, 2) AS asset_growth_pct,
    ROUND(k.returnOnEquityTTM * 100, 2) AS roe_pct,
    ROUND(k.returnOnAssetsTTM * 100, 2) AS roa_pct,
    ROUND(f.operatingProfitMarginTTM * 100, 2) AS opm_pct,
    ROUND(k.marketCap / 1e9, 2) AS mktcap_bn
FROM growth g
JOIN profile p ON g.symbol = p.symbol
JOIN key_metrics_ttm k ON g.symbol = k.symbol
JOIN financial_ratios_ttm f ON g.symbol = f.symbol
WHERE g.asset_growth < 0.10
  AND g.asset_growth > -0.20
  AND k.returnOnEquityTTM > 0.08
  AND k.returnOnAssetsTTM > 0.05
  AND f.operatingProfitMarginTTM > 0.10
  AND k.marketCap > 500000000
  AND p.exchange = 'SAO'
ORDER BY g.asset_growth ASC
LIMIT 30
Backtest
# Clone the repo
git clone https://github.com/ceta-research/backtests.git
cd backtests

# Run Brazil backtest
python3 asset-growth/backtest.py --preset brazil --output results.json --verbose

# Run all exchanges
python3 asset-growth/backtest.py --global --output results/exchange_comparison.json
Takeaway
$10,000 invested in this strategy in 2000 grew to $123,343. The same $10,000 in the Bovespa grew to $80,474. The +1.87% annual excess over 25 years is a decent number. It's not the headline.
The headline is the -9.61% max drawdown vs -38.45% for the Bovespa. In a market where 30-50% annual swings are normal, the quality-filtered low-asset-growth screen turned Brazil into something that behaves like a conservative allocation. The Calmar ratio of 1.10 is 4.9x the Bovespa's 0.226. The down capture of -23.40% means the portfolio didn't just avoid the downside, it moved in the opposite direction during Bovespa selloffs.
The tradeoffs are real. Four cash years that missed massive Bovespa rallies. A thin qualifying universe. And a Sharpe ratio near zero because Brazil's risk-free rate was sky-high for most of this period.
But the strategy won 60% of years against its local benchmark while keeping drawdowns under 10%. If you're looking for a factor screen that turns one of the world's most volatile equity markets into something you can hold without checking your portfolio every morning, this is it. Capital discipline works everywhere. In Brazil, it works as a drawdown shield.
Data: Ceta Research (FMP financial data warehouse), 2000-2025. Universe: SAO (Sao Paulo). Annual rebalance, equal weight. Returns in BRL unless noted. Full methodology: METHODOLOGY.md. Past performance does not guarantee future results. This is educational content, not investment advice.
References
- Cooper, M., Gulen, H. & Schill, M. (2008). "Asset Growth and the Cross-Section of Stock Returns." Journal of Finance, 63(4), 1609-1651.
- Watanabe, A., Xu, Y., Yao, T. & Yu, T. (2013). "The Asset Growth Effect: Insights from International Equity Markets." Journal of Financial Economics, 108(2), 529-563.
- Hou, K., Xue, C. & Zhang, L. (2015). "Digesting Anomalies: An Investment Approach." Review of Financial Studies, 28(3), 650-705.


