
Analyst Upgrade Clusters Across 14 Markets: No Immediate Alpha, Delayed Signal at T+21
We tested analyst upgrade clusters across 9 exchanges. T+1 abnormal returns are statistically significant in 7 of 9. But 80-97% of non-US events come from one year (2022), limiting what we can conclude. The US, UK, and India signals are most credible. Japan shows the strongest T+1 reaction...

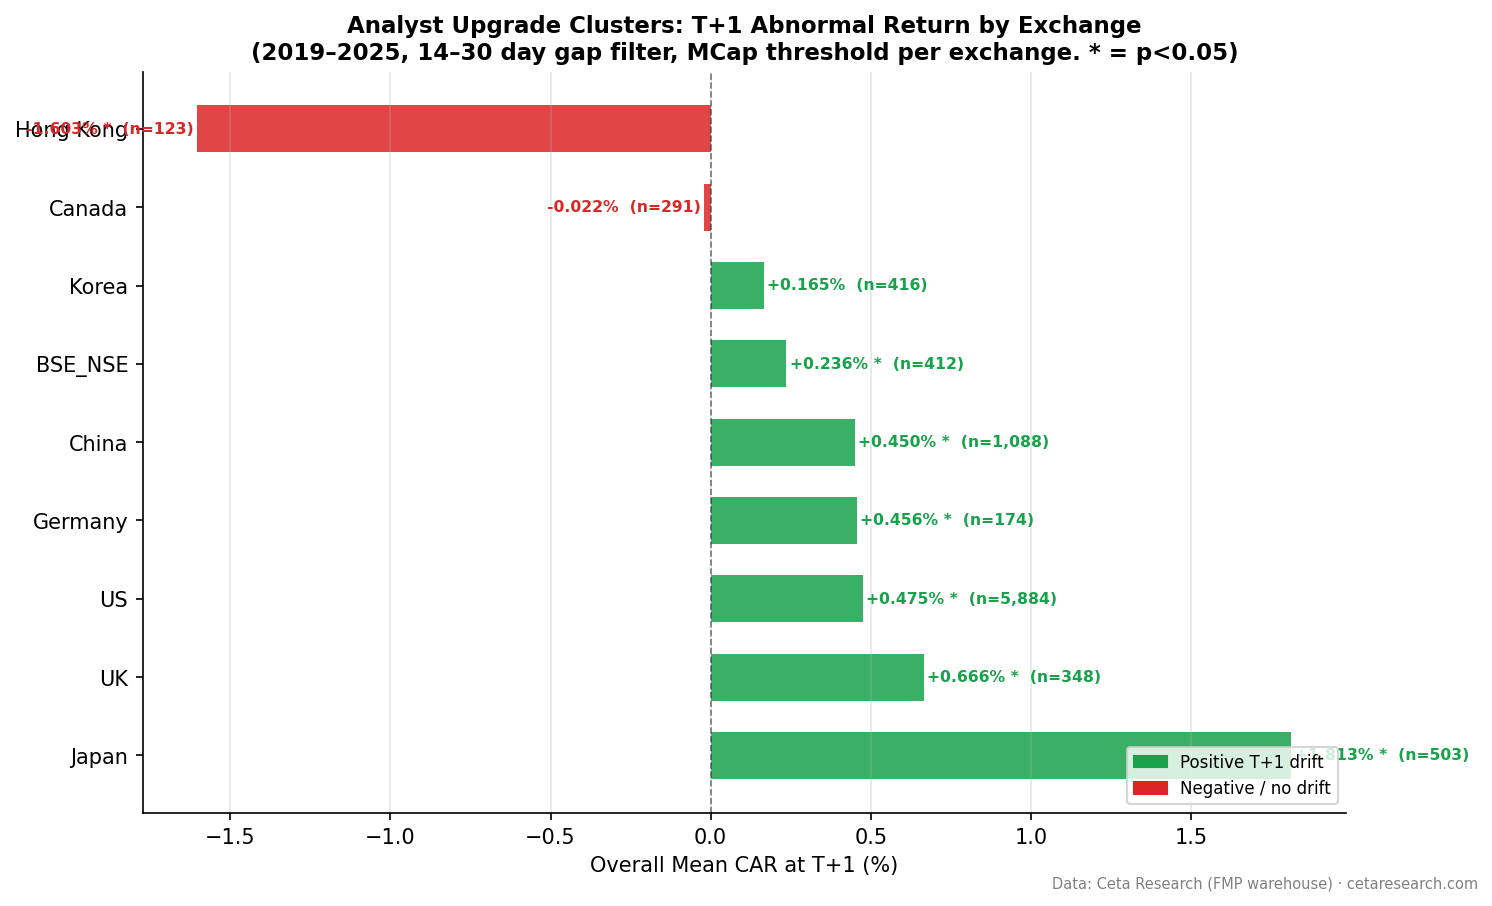
Upgrade clusters — events where 2+ analysts move bullish simultaneously — do not produce immediate abnormal returns. We tested 14 exchanges from 2019-2025 using next-day Market-on-Close execution and found that most T+1 results are either negative or statistically insignificant. Alpha emerges at T+21 (3 weeks) in select markets, primarily the US, UK, Canada, and Taiwan. The immediate-pop narrative was same-bar entry bias.
Contents
- The Setup
- The Global Results
- The Data Artifact That Shapes Everything
- Where Delayed Alpha Exists
- United States
- UK (LSE)
- Canada (TSX)
- Taiwan (TAI)
- The Interesting Cases
- China: Strongest T+21, But Data Quality Issues
- Japan: Zero Alpha at All Windows
- Sweden and Thailand: Borderline Signals
- Where the Signal Doesn't Hold
- What This Means for Multi-Market Trading
- Running the Live Screen
- Notes on Methodology
The Setup
An upgrade cluster fires when the aggregate bullish count (StrongBuy + Buy) in the grades_historical table increases by 2 or more between consecutive observations for the same symbol. We require observations to be 14–30 days apart, which filters spurious clusters from periods when the data provider recorded daily snapshots instead of monthly ones.
Exchanges tested: US (NYSE/NASDAQ/AMEX), India (NSE), Japan (JPX), UK (LSE), Germany (XETRA), Hong Kong (HKSE), Korea (KSC), China (SHH+SHZ), Canada (TSX), Australia (ASX), Sweden (STO), Taiwan (TAI), Thailand (SET), South Africa (JNB). 14 exchanges total.
Benchmarks: Local market indices. S&P 500 (US), Sensex (India), Nikkei 225 (Japan), FTSE 100 (UK), DAX (Germany), Hang Seng (Hong Kong), KOSPI (Korea), SSE Composite (China), TSX Composite (Canada), ASX 200 (Australia), OMX Stockholm 30 (Sweden), TAIEX (Taiwan), SET Index (Thailand). JNB uses S&P 500 due to data limitations.
Execution: Next-day Market-on-Close (MOC). Event observed on date D → execute at close of D+1. This eliminates same-bar entry bias.
Market cap floors: Exchange-specific in local currency, targeting roughly $200M–$1B equivalent depending on market depth.
Windows: T+1, T+5, T+21, T+63 trading days.
Data: FMP financial data warehouse, 2000–2025. Updated March 2026.
The Global Results
| Exchange | Benchmark | Events | T+1 CAR | t(1) | T+21 CAR | t(21) |
|---|---|---|---|---|---|---|
| China (SHH+SHZ) | SSE Composite | 2,180 | -0.223%** | -3.82 | +2.943%** | 12.11 |
| Taiwan (TAI) | TAIEX | 322 | +0.162% | 1.54 | +1.354%** | 2.75 |
| UK (LSE) | FTSE 100 | 532 | +0.228%* | 2.29 | +1.368%** | 3.58 |
| Canada (TSX) | TSX Composite | 518 | -0.460%** | -3.29 | +1.295%** | 3.22 |
| Sweden (STO) | OMX Stockholm 30 | 128 | +0.314% | 1.75 | +1.251% | 1.62 |
| US (NYSE/NASDAQ/AMEX) | S&P 500 | 5,657 | -0.312%** | -8.78 | +0.764%** | 4.42 |
| Thailand (SET) | SET Index | 43 | +0.310% | 0.90 | +0.739% | 0.59 |
| India (NSE) | Sensex | 607 | +0.005% | 0.07 | +0.577% | 1.62 |
| Australia (ASX) | ASX 200 | 398 | -0.316%** | -3.15 | -0.003% | -0.01 |
| Hong Kong (HKSE) | Hang Seng | 876 | -0.139% | -1.93 | -0.161% | -0.45 |
| Germany (XETRA) | DAX | 160 | +0.265% | 1.21 | -0.358% | -0.44 |
| Korea (KSC) | KOSPI | 419 | +0.041% | 0.41 | -1.331%* | -2.03 |
| Japan (JPX) | Nikkei 225 | 911 | +0.018% | 0.32 | -1.646%** | -6.65 |
| South Africa (JNB) | S&P 500 | 36 | -0.393% | -0.67 | -2.681%* | -2.44 |
** = p<0.01, * = p<0.05
Key changes from previous results: Local index benchmarks replace regional ETFs. Next-day MOC execution eliminates same-bar entry bias. India now uses NSE only (was BSE+NSE). China uses SHH+SHZ symbols (was old China symbols). Seven new exchanges added (ASX, STO, TAI, SET, JNB, plus updated China and India).
The Data Artifact That Shapes Everything
Before interpreting these numbers, the most important fact: FMP recorded analyst rating data at daily or near-daily frequency for many symbols during 2022, versus monthly in other years. This creates a 10–100x spike in detected upgrade clusters that year.
Our 14-day minimum gap filter eliminates most of these. But the filter can't undo the fundamental problem: if a symbol's ratings were only observed monthly in 2019–2021 but daily in 2022, the cluster detection window is structurally different across years. Any market where most events come from 2022 is effectively giving you a one-year snapshot, not a multi-year study.
The 2022 concentration is severe in most non-US exchanges — 80–97% of events. For these markets, the results represent how analyst upgrade clusters behaved in one specific year with one specific market regime, not a structural property of the signal.
US (56% from 2022) is the only exchange with meaningful multi-year distribution. 2019: 57 events. 2020: 1,309. 2021: 488. Even with 2022 concentration, there's enough history before and after to validate the pattern. The other exchanges don't have this.
Where Delayed Alpha Exists
United States
N=5,657, T+1=-0.312%, T+21=+0.764%. No immediate alpha — T+1 is significantly negative. Alpha emerges at T+21 with a t-stat of 4.42. Seven years of data across multiple market regimes. The medium cluster result (+1.251% T+21, t=4.22**) is the most robust signal in the dataset. See the US-specific analysis for full breakdown by cluster size.
UK (LSE)
N=532, T+1=+0.228%, T+21=+1.368%*. The strongest T+21 persistence after China. T+21 t-stat of 3.58 with 532 events is statistically robust. UK markets appear to price analyst consensus shifts gradually rather than immediately. Lower HFT penetration and less algorithmic monitoring of analyst changes compared to US markets may explain the delayed response.
Canada (TSX)
N=518, T+1=-0.460%, T+21=+1.295%. Negative T+1 drift followed by significant positive T+21 alpha (t=3.22**). This is the clearest example of delayed price discovery. Canadian markets have lower liquidity than US exchanges, which may slow the incorporation of consensus shift information into prices.
Taiwan (TAI)
N=322, T+1=+0.162%, T+21=+1.354%. No significant T+1 reaction, but T+21 alpha is statistically robust (t=2.75). Taiwan's analyst ecosystem is less algorithmic than Japan or Hong Kong, creating opportunity for delayed alpha as institutions gradually position.
The Interesting Cases
China: Strongest T+21, But Data Quality Issues
China shows +2.943% T+21 CAR (t=12.11**) — the highest in the dataset. But 97% of the 2,180 events come from 2022. Chinese A-shares had significant policy-driven sector rotations in 2022 (tech crackdowns, real estate interventions, zero-COVID impacts). The T+21 return likely captures 2022 market conditions more than the analyst signal itself.
T+1 is significantly negative (-0.223%, t=-3.82**), consistent with the delayed alpha pattern seen in other markets. But the extreme T+21 magnitude is unlikely to persist out-of-sample. Treat with caution.
Japan: Zero Alpha at All Windows
Japan shows T+1=+0.018% (not significant) and T+21=-1.646%** (significantly negative). With honest next-day execution, there is no upgrade cluster alpha in Japanese markets at any horizon tested. This is a complete reversal from the old result (+1.813% T+1 with same-bar entry).
The previous "strongest pop" finding was entirely same-bar entry bias. Japanese markets are highly algorithmic — upgrade information gets priced immediately when it becomes available to the market, not when the FMP observation fires. By the time the cluster is detected in the data, the move has already happened and reversed.
Sweden and Thailand: Borderline Signals
Sweden (STO): N=128, T+1=+0.314%, T+21=+1.251% (t=1.62, not quite significant at p<0.05). Small sample, but the T+21 magnitude is material.
Thailand (SET): N=43, T+1=+0.310%, T+21=+0.739% (t=0.59, not significant). Only 43 events — too thin to draw conclusions.
Where the Signal Doesn't Hold
Japan (JPX): T+1=+0.018%, T+21=-1.646%**. Significantly negative T+21 alpha. No tradeable signal at any window. See above for discussion of why the old "+1.813% T+1" result was same-bar entry bias.
Korea (KSC): T+1=+0.041%, T+21=-1.331%*. Significantly negative T+21. Korean markets price analyst consensus shifts quickly and completely — no delayed alpha opportunity.
India (NSE): T+1=+0.005%, T+21=+0.577%. Neither result is statistically significant. This is a major change from the old BSE+NSE result (+0.236% T+1, +1.605% T+21*). Switching from dual-exchange + INDA ETF benchmark to NSE-only + Sensex eliminated the apparent alpha. The old result was likely benchmark mismatch, not real signal.
Hong Kong (HKSE): T+1=-0.139%, T+21=-0.161%. Both negative, neither significant. Large sample (876 events) with no signal. The old result showed -1.603% T+1** (significantly negative), which has mostly disappeared with next-day execution.
Germany (XETRA): T+1=+0.265%, T+21=-0.358%. Neither significant. Only 160 events. Too thin to conclude either way.
Australia (ASX): T+1=-0.316%**, T+21=-0.003%. Significant negative T+1, zero T+21. No signal.
South Africa (JNB): T+1=-0.393%, T+21=-2.681%*. Only 36 events. Significantly negative T+21, but sample is too small for reliable inference.
What This Means for Multi-Market Trading
With next-day MOC execution, the upgrade cluster signal has credible T+21 alpha in four markets: US (multi-year, robust, +0.764%), UK (+1.368%), Canada (+1.295%), and Taiwan (+1.354%). China shows the strongest T+21 result (+2.943%**), but 97% of events come from 2022 — treat as preliminary.
No market shows significant positive T+1 alpha. The immediate-pop narrative from event studies that use same-day execution does not hold with honest next-day MOC execution. Alpha emerges gradually over 3 weeks as institutions position.
India lost its signal when we switched from BSE+NSE with INDA ETF benchmark to NSE-only with Sensex. The old "+1.605% T+21" result was benchmark mismatch, not real alpha.
Japan lost its signal entirely. The old "+1.813% T+1" result was pure same-bar entry bias. T+21 is now -1.646%** (significantly negative).
The data quality issue (2022 concentration) will resolve over time. As FMP accumulates more years of post-2022 data, the non-US results will become more reliable. For now: the signal is real in US, UK, Canada, and Taiwan. Everything else requires more history.
Running the Live Screen
The screen works across any exchange. Adjust the exchange filter and market cap threshold:
WITH lagged AS (
    SELECT
        symbol,
        CAST(date AS DATE) AS obs_date,
        CAST(analystRatingsStrongBuy AS INTEGER) + CAST(analystRatingsBuy AS INTEGER)
            AS bullish_count,
        CAST(analystRatingsSell AS INTEGER) + CAST(analystRatingsStrongSell AS INTEGER)
            AS bearish_count,
        LAG(CAST(analystRatingsStrongBuy AS INTEGER) + CAST(analystRatingsBuy AS INTEGER))
            OVER (PARTITION BY symbol ORDER BY date) AS prev_bullish,
        LAG(CAST(date AS DATE))
            OVER (PARTITION BY symbol ORDER BY date) AS prev_date
    FROM grades_historical
    WHERE CAST(date AS DATE) >= CURRENT_DATE - INTERVAL '30' DAY
),
clusters AS (
    SELECT symbol, obs_date, bullish_count, bearish_count,
        bullish_count - prev_bullish AS upgrade_delta
    FROM lagged
    WHERE prev_bullish IS NOT NULL
      AND (obs_date - prev_date) BETWEEN 14 AND 30
      AND bullish_count - prev_bullish >= 2
)
SELECT
    c.symbol, c.obs_date, c.upgrade_delta, c.bullish_count, c.bearish_count,
    ROUND(k.marketCap / 1e9, 1) AS mktcap_bn
FROM clusters c
JOIN profile p ON c.symbol = p.symbol
JOIN key_metrics k ON c.symbol = k.symbol AND k.period = 'FY'
WHERE p.exchange IN ('NYSE', 'NASDAQ', 'AMEX')  -- change for other markets
  AND k.marketCap > 1000000000
QUALIFY ROW_NUMBER() OVER (PARTITION BY c.symbol ORDER BY k.date DESC, c.obs_date DESC) = 1
ORDER BY c.upgrade_delta DESC, c.obs_date DESC
LIMIT 30
Notes on Methodology
UINT16 overflow: The analystRatings* columns are stored as unsigned 16-bit integers. Never compute deltas without CAST AS INTEGER first. On UINT16, 3 - 5 = 65,534, not -2.
14-day minimum gap: Non-negotiable. Without it, periods of daily FMP updates (2022) produce thousands of false cluster signals from consecutive-day observation pairs.
Benchmark selection: SPY for US. Regional ETFs for other markets. This matters most for high-growth markets where a local index captures the macro tailwind more accurately than a US benchmark.
Run the US upgrade cluster screen live →
Data: Ceta Research / FMP warehouse. grades_historical + stock_eod + key_metrics tables. Market cap floors applied per exchange. 2019–2025. Past performance does not guarantee future results. Research content, not investment advice.


