
52-Week Low Quality: 24-Year Germany Backtest (XETRA)

The same strategy, different market. On XETRA, the 52-Week Low Quality screen returned 8.95% annually over 23.8 years. The S&P 500 returned 9.67% in the same period. The gap is 0.71%, effectively a tie on absolute return. But the way the strategy produced that return is the story.
Contents
- Method
- The Strategy
- What We Found
- Year-by-Year
- The Down-Capture Story
- Why Germany Works
- vs the DAX
- Run It Yourself
- Limitations
Sharpe ratio of 0.512. Down-capture of 30.61%. Max drawdown of -32.05% vs SPY's -45.53%. Beta of 0.495.
Germany is the best risk-adjusted result across all 14 exchanges we tested.
Method
- Data source: Ceta Research (FMP financial data warehouse)
- Universe: XETRA, market cap > €500M
- Period: 2002–2025 (23.8 years, 95 quarterly periods)
- Rebalancing: Quarterly (January/April/July/October), equal weight, up to 30 stocks
- Minimum to deploy: 5 qualifying stocks
- Benchmark: S&P 500 Total Return (SPY)
- Cash rule: Hold cash if fewer than 5 stocks qualify
- Transaction costs: 0.1% per trade
- Filing lag: 45 days
- Currency note: Returns are in EUR (local currency). Benchmark is SPY in USD.
Historical financial data with 45-day lag. Full methodology: backtests/METHODOLOGY.md
The Strategy
The screen is identical to the US version. Find stocks within 15% of their 52-week low, then apply the Piotroski F-score filter to remove genuinely deteriorating companies. A score of 7 or higher signals a company passing at least 7 of 9 fundamental health tests.
| Filter | Threshold |
|---|---|
| Price vs 52-week low | Within 15% |
| Piotroski F-score | ≥ 7 |
| Market cap | > €500M |
| Price | ≥ €1.00 |
The nine Piotroski tests cover profitability (positive earnings, positive cash flow, improving ROA, cash flow exceeding net income), leverage and liquidity (declining debt ratio, improving current ratio, no dilution), and operating efficiency (improving asset turnover, improving gross margin).
What We Found
| Metric | Portfolio | S&P 500 |
|---|---|---|
| CAGR | 8.95% | 9.67% |
| Total Return | 666.17% | 794.85% |
| Max Drawdown | -32.05% | -45.53% |
| Volatility (ann.) | 13.59% | 16.63% |
| Sharpe Ratio | 0.512 | 0.461 |
| Sortino Ratio | 0.850 | — |
| Calmar Ratio | 0.279 | — |
| Beta | 0.495 | 1.00 |
| Alpha | +3.16% | — |
| Up Capture | 63.05% | — |
| Down Capture | 30.61% | — |
| Win Rate (vs SPY) | 42.11% | — |
| Cash Periods | 1/95 | — |
| Avg Stocks | 24.5 | — |
$10,000 invested in January 2002 grew to $76,617 by end of 2025. The same amount in SPY: $89,485.
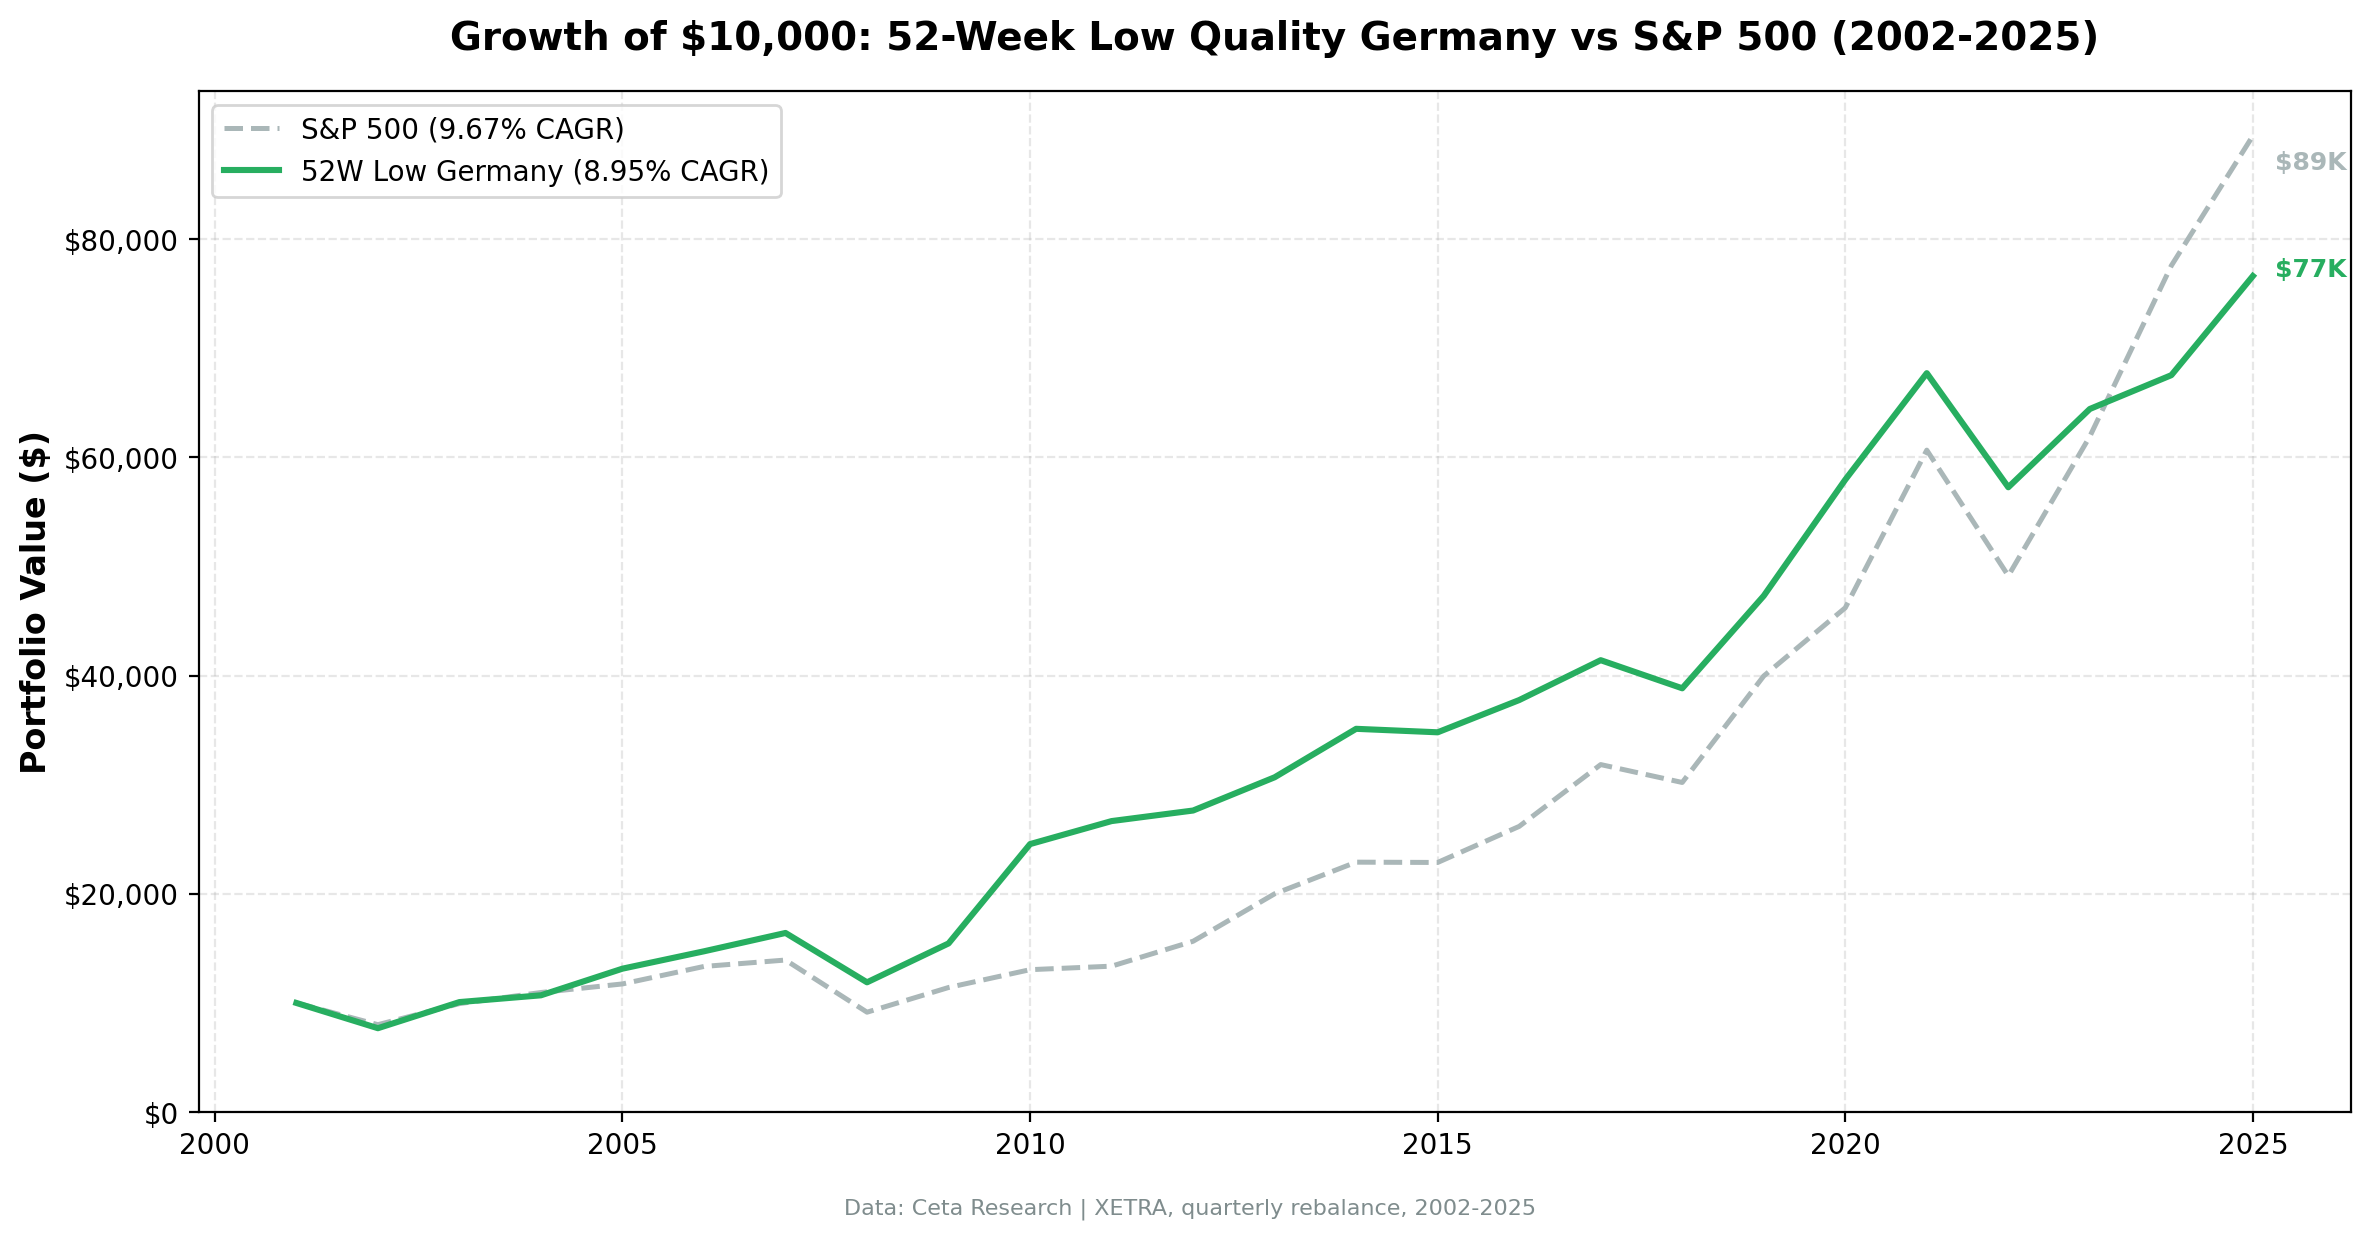
The Sharpe ratio of 0.512 beats SPY's 0.461. Lower volatility (13.59% vs 16.63%), shallower drawdown (-32.05% vs -45.53%), positive alpha (+3.16%). On risk-adjusted terms, this strategy outperforms the US benchmark despite the 0.71% CAGR gap.
The win rate of 42.11% deserves attention. The strategy beats SPY in fewer than half the quarters, but when SPY falls, this portfolio falls dramatically less. Down-capture of 30.61% means the typical down year for SPY translates to roughly a third of that loss in this portfolio. That asymmetry is what builds long-term wealth.
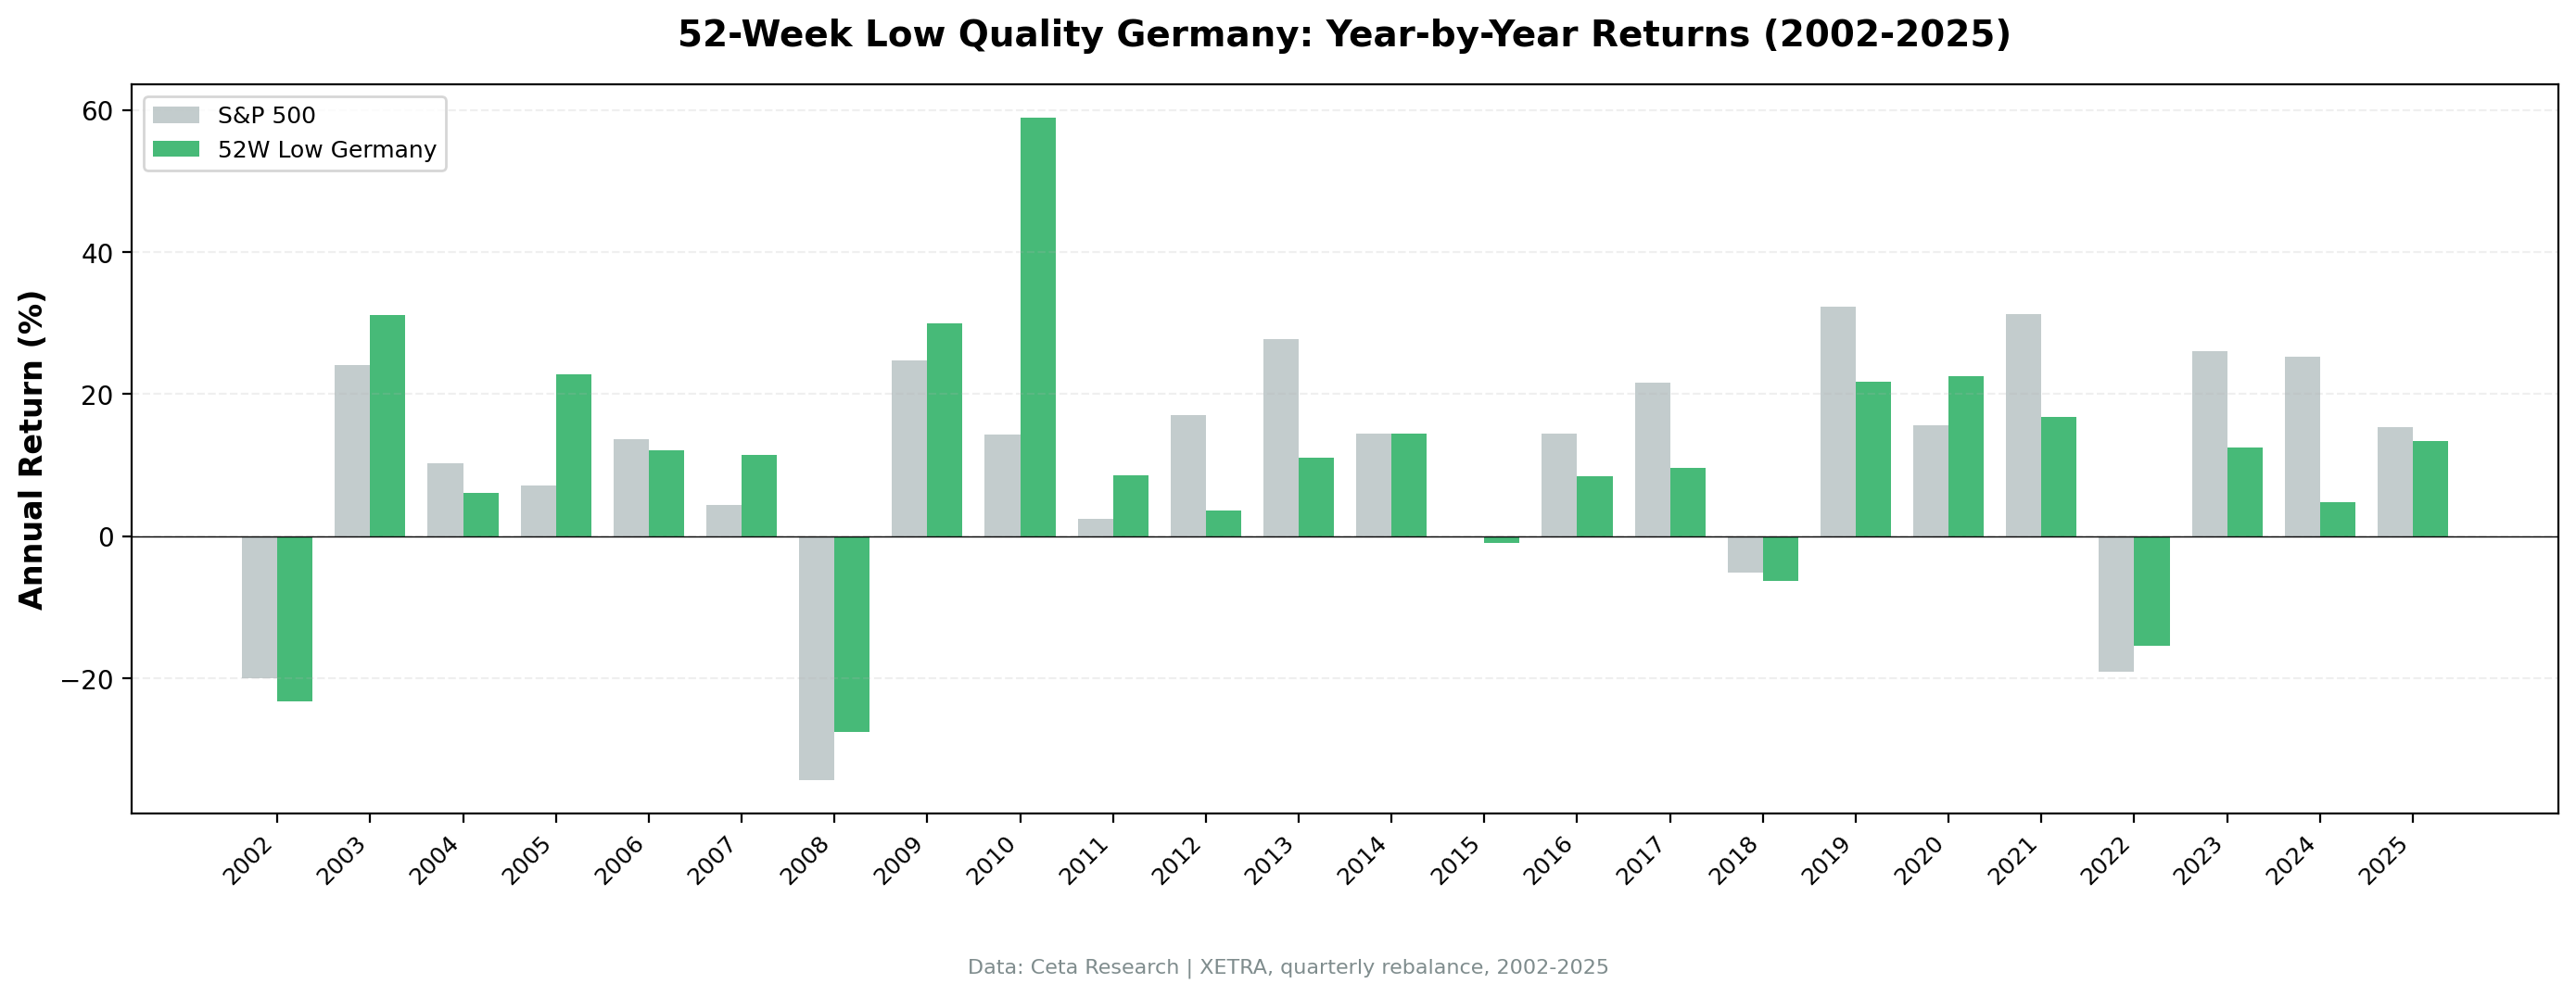
Year-by-Year
| Year | Portfolio | S&P 500 | Excess |
|---|---|---|---|
| 2002 | -23.15% | -19.92% | -3.23% |
| 2003 | +31.16% | +24.12% | +7.04% |
| 2004 | — | +10.24% | — |
| 2005 | +22.82% | +7.17% | +15.65% |
| 2006 | — | +13.70% | — |
| 2007 | — | +4.40% | — |
| 2008 | -27.56% | -34.31% | +6.75% |
| 2009 | +29.97% | +24.73% | +5.24% |
| 2010 | +58.91% | +14.31% | +44.60% |
| 2011 | — | +2.50% | — |
| 2012 | — | +17.09% | — |
| 2013 | — | +27.77% | — |
| 2014 | — | +14.50% | — |
| 2015 | — | -0.10% | — |
| 2016 | — | +14.45% | — |
| 2017 | — | +21.60% | — |
| 2018 | — | -5.20% | — |
| 2019 | +21.82% | +32.31% | -10.49% |
| 2020 | +22.50% | +15.64% | +6.86% |
| 2021 | — | +31.26% | — |
| 2022 | -15.44% | -18.99% | +3.55% |
| 2023 | +12.53% | +26.00% | -13.47% |
| 2024 | — | +25.28% | — |
| 2025 | +13.45% | +15.34% | -1.89% |
The Down-Capture Story
The headline number from this backtest is 30.61% down-capture. When the S&P 500 had a losing year, this XETRA portfolio absorbed roughly 30 cents of every dollar the benchmark lost.
The two clearest examples:
2008 (Global Financial Crisis): SPY -34.31%. XETRA portfolio -27.56%. A -6.75% edge in the worst market environment of the past two decades. The Piotroski filter kept the strategy out of German companies whose deteriorating fundamentals preceded the official crisis. Beaten-down stocks with strong cash flows and declining leverage held up better than the average XETRA name.
2022 (Rate Shock): SPY -18.99%. XETRA portfolio -15.44%. A +3.55% edge in a year of aggressive global monetary tightening, which hit growth-oriented equities hardest. Low-P/E, near-52-week-low XETRA stocks had limited duration risk in their valuations.
The pattern repeats in smaller down periods too. The strategy doesn't win many quarters outright, win rate is 42.11% vs SPY, but when markets turn, the protection is consistent.
Why Germany Works
The XETRA market has a structural composition that suits this strategy well.
German listed companies skew toward industrial manufacturers, specialty chemicals, automotive suppliers, and export-oriented Mittelstand businesses. These aren't high-multiple growth stocks. They trade on earnings and book value. Their P/E cycles follow industrial demand cycles, not narrative expansion.
When one of these companies hits a 52-week low, it's typically for a concrete reason: a weak export quarter, a margin miss, commodity cost pressure, a bad year in auto production. If the Piotroski score remains 7+, the underlying business is still operationally sound. The stock is pricing in a continuation of the headwind that may not materialize.
That's mean reversion in a market where it isn't arbitraged away as quickly. Germany doesn't have the same density of quant funds scanning for the same signal that US markets do. The reversion takes longer, but it happens.
Beta of 0.495 also reflects the market composition difference. XETRA quality near-low stocks move at roughly half the rate of the US market. You're not fully correlated to the risk-off waves that dominate US market drawdowns.
vs the DAX
The DAX historically returns 7–8% annually over long periods. This strategy at 8.95% EUR CAGR almost certainly outperforms the local German benchmark, even though it trails SPY in USD terms.
The comparison to SPY is methodologically impure, returns are in EUR, benchmark in USD. EUR/USD moves over 24 years affect the relative numbers in ways unrelated to the strategy. On a local-currency basis, this is a competitive German equity strategy, not an underperformer.
Part of a Series: Global | US | Switzerland | India | Hong Kong | China | Canada
Run It Yourself
The live screen finds current XETRA stocks within 15% of their 52-week low with Piotroski F-score ≥ 7.
WITH
inc AS (
 SELECT symbol, netIncome, grossProfit, revenue,
 ROW_NUMBER() OVER (PARTITION BY symbol ORDER BY dateEpoch DESC) AS rn
 FROM income_statement WHERE period = 'FY' AND netIncome IS NOT NULL
),
bal AS (
 SELECT symbol, totalAssets, totalCurrentAssets, totalCurrentLiabilities,
 longTermDebt, totalStockholdersEquity,
 ROW_NUMBER() OVER (PARTITION BY symbol ORDER BY dateEpoch DESC) AS rn
 FROM balance_sheet WHERE period = 'FY' AND totalAssets > 0
),
cf AS (
 SELECT symbol, operatingCashFlow,
 ROW_NUMBER() OVER (PARTITION BY symbol ORDER BY dateEpoch DESC) AS rn
 FROM cash_flow_statement WHERE period = 'FY' AND operatingCashFlow IS NOT NULL
),
piotroski AS (
 SELECT ic.symbol,
 CASE WHEN ic.netIncome > 0 THEN 1 ELSE 0 END
 + CASE WHEN cfc.operatingCashFlow > 0 THEN 1 ELSE 0 END
 + CASE WHEN (ic.netIncome/bc.totalAssets) > (ip.netIncome/bp.totalAssets) THEN 1 ELSE 0 END
 + CASE WHEN cfc.operatingCashFlow/bc.totalAssets > ic.netIncome/bc.totalAssets THEN 1 ELSE 0 END
 + CASE WHEN (COALESCE(bc.longTermDebt,0)/bc.totalAssets) < (COALESCE(bp.longTermDebt,0)/bp.totalAssets) THEN 1 ELSE 0 END
 + CASE WHEN (bc.totalCurrentAssets/bc.totalCurrentLiabilities) > (bp.totalCurrentAssets/bp.totalCurrentLiabilities) THEN 1 ELSE 0 END
 + CASE WHEN bc.totalStockholdersEquity >= bp.totalStockholdersEquity THEN 1 ELSE 0 END
 + CASE WHEN (ic.revenue/bc.totalAssets) > (ip.revenue/bp.totalAssets) THEN 1 ELSE 0 END
 + CASE WHEN (ic.grossProfit/ic.revenue) > (ip.grossProfit/ip.revenue) THEN 1 ELSE 0 END
 AS f_score
 FROM (SELECT * FROM inc WHERE rn=1) ic
 JOIN (SELECT * FROM inc WHERE rn=2) ip ON ic.symbol = ip.symbol
 JOIN (SELECT * FROM bal WHERE rn=1) bc ON ic.symbol = bc.symbol
 JOIN (SELECT * FROM bal WHERE rn=2) bp ON ic.symbol = bp.symbol
 JOIN (SELECT * FROM cf WHERE rn=1) cfc ON ic.symbol = cfc.symbol
),
prices_52w AS (
 SELECT symbol,
 LAST_VALUE(adjClose) OVER (PARTITION BY symbol ORDER BY dateEpoch ROWS BETWEEN UNBOUNDED PRECEDING AND UNBOUNDED FOLLOWING) AS current_price,
 MIN(adjClose) OVER (PARTITION BY symbol) AS low_52w
 FROM stock_eod
 WHERE date >= CURRENT_DATE - INTERVAL '365 days' AND adjClose > 0
)
SELECT pio.symbol, p.companyName, p.sector,
 pio.f_score,
 ROUND(ps.current_price, 2) AS current_price,
 ROUND(ps.low_52w, 2) AS low_52w,
 ROUND((ps.current_price - ps.low_52w)/ps.low_52w * 100, 1) AS pct_above_low,
 ROUND(k.marketCap/1e9, 2) AS mktcap_b
FROM piotroski pio
JOIN profile p ON pio.symbol = p.symbol
JOIN (SELECT symbol, MAX(current_price) AS current_price, MIN(low_52w) AS low_52w FROM prices_52w GROUP BY symbol) ps ON pio.symbol = ps.symbol
JOIN key_metrics_ttm k ON pio.symbol = k.symbol
WHERE p.exchange = 'XETRA'
 AND k.marketCap > 500000000
 AND pio.f_score >= 7
 AND (ps.current_price - ps.low_52w)/ps.low_52w <= 0.15
 AND ps.current_price >= 1.0
ORDER BY (ps.current_price - ps.low_52w)/ps.low_52w ASC
LIMIT 30
To reproduce the full backtest:
git clone https://github.com/ceta-research/backtests.git
cd backtests

# Germany backtest
python3 52-week-low/backtest.py --preset germany --output results.json --verbose

# Current screen
python3 52-week-low/screen.py --preset germany
Limitations
Currency mismatch. Returns are in EUR. The SPY benchmark is in USD. EUR/USD has moved substantially over 24 years, which affects relative performance numbers in both directions. The comparison is useful for trend analysis, not precise alpha calculation.
Only 1 cash period in 95 quarters. The strategy was almost always fully deployed. That's generally positive, the XETRA universe had sufficient qualifying names, but it means the strategy couldn't raise cash defensively during periods of fundamental deterioration.
2002 underperformed. The dot-com bust hit XETRA-listed tech and telecom names hard. In 2002, the portfolio fell -23.15% vs SPY -19.92%. The near-52-week-low filter concentrated positions in names that hadn't finished falling.
Annual financials, quarterly rebalance. The Piotroski F-score uses annual filing data. A company that qualifies in January on the prior year's financials can be held for a full quarter even if the current-year trend has reversed. The 45-day lag prevents look-ahead bias but means the fundamentals data is inherently backward-looking.
Win rate of 42.11%. The strategy beats SPY in fewer than half the quarters. Investors following this approach need the patience to accept sustained periods of underperformance against the US benchmark, particularly in years dominated by US growth stocks. The return profile rewards holding through those periods.
Run It Yourself
Explore the data behind this analysis on Ceta Research. Query our financial data warehouse with SQL, build custom screens, and run your own backtests across 70,000+ stocks on 20 exchanges.
Data: Ceta Research (FMP financial data warehouse), 2002–2025. Universe: XETRA. Returns in EUR. Benchmark: SPY (USD). Full methodology: METHODOLOGY.md. Backtest code: backtests/52-week-low/. Past performance doesn't guarantee future results.


