
Volume-Confirmed Momentum on India Stocks: 12.21% CAGR, But the Sensex Did Better
Volume-confirmed momentum on Indian equities from 2001 to 2025: 12.21% CAGR with 70.6% down capture. Strong absolute returns, but the Sensex returned 13.18% over the same period. The factor provides downside protection but doesn't beat the index.

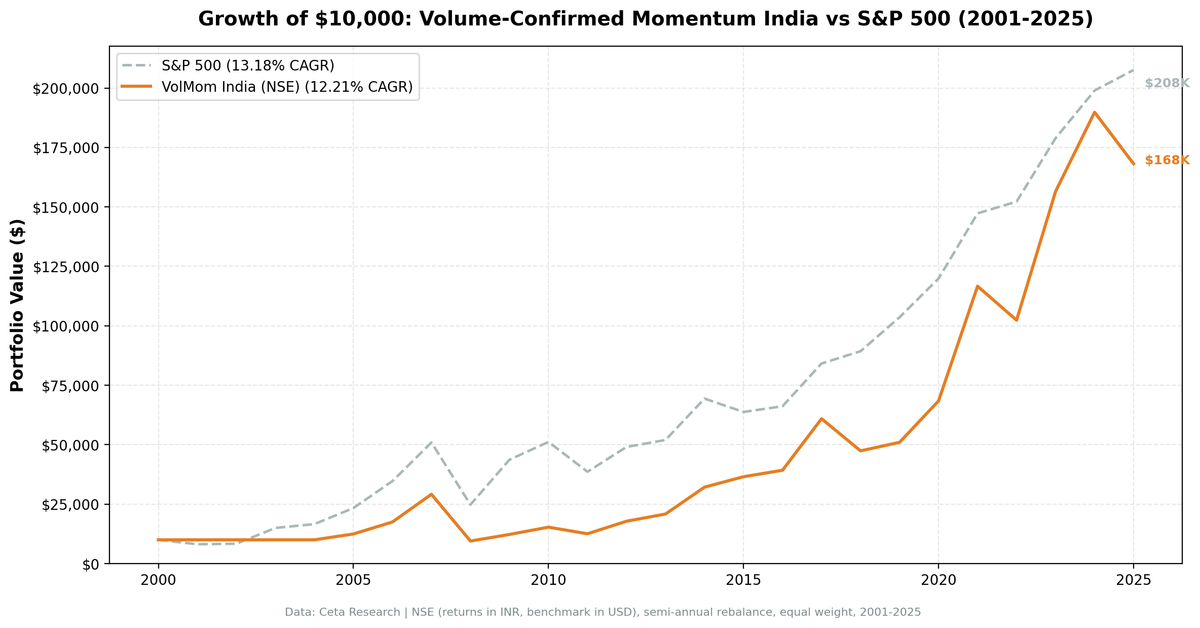
Volume confirmation produces strong absolute returns in India. We ran the top 30 NSE stocks by 12-month momentum, filtered for rising volume and positive earnings, and rebalanced semi-annually from 2001 to 2025. The strategy returned 12.21% annually with a max drawdown of -67.44%. But here's what the standard SPY comparison misses: the Sensex itself returned 13.18% over the same period. The momentum filter didn't outperform the index.
Contents
Data: FMP financial data warehouse, 2000–2025. Updated March 2026.
Method
| Parameter | Value |
|---|---|
| Universe | NSE (India) |
| Rebalancing | Semi-annual (January, July) |
| Signal | 12-month return, skip last month (T-1M to T-12M) |
| Volume filter | 3-month avg daily volume > 12-month avg (vol_ratio > 1.0) |
| Quality filter | netIncome > 0 AND operatingCashFlow > 0 (FY, 45-day lag) |
| Selection | Top 30 by momentum, equal weight |
| Min threshold | 10 qualifying stocks to deploy capital |
| Data source | FMP via Ceta Research warehouse |
| Benchmark | Sensex (^BSESN) |
| Period | 2001–2025 |
| Academic basis | Lee & Swaminathan (2000), Journal of Finance 55(5) |
The quality filter — positive net income and positive operating cash flow — is especially valuable in Indian markets where speculative small caps can dominate momentum screens during bull runs. The 45-day reporting lag ensures no look-ahead bias.
What We Found
India delivered 12.21% annual returns over 24.5 years. In absolute terms, that's excellent — compounding to roughly 17x over the period. The problem is the benchmark. The Sensex returned 13.18% over the same period. An investor who simply held an index fund would have done better by about 1% per year.
24.5-year summary (2001–2025):
| Metric | Volume-Confirmed Momentum | Sensex |
|---|---|---|
| CAGR | 12.21% | 13.18% |
| Sharpe Ratio | 0.213 | — |
| Max Drawdown | -67.44% | — |
| Down Capture | 70.6% | 100% |
| Up Capture | 89.95% | 100% |
| Cash Periods | 10 of 49 (20%) | — |
| Avg Stocks Held (when invested) | 28.4 | — |
The down capture of 70.6% tells a genuine story: when the Sensex falls, the strategy tends to fall only 70% as hard. That's real defensive value. And the strategy was in cash 20% of the time, which helped during the 2001-2003 period when the Sensex was volatile.
But the up capture of 89.95% explains the underperformance. During Sensex bull runs, the portfolio captured only 90% of the gains. When the market was flat or falling, the strategy held up. When the market ran hard, it fell behind.
Year-by-year standouts:
| Year | Portfolio | Sensex | Notes |
|---|---|---|---|
| 2001–2004 | 0% | various | Cash — not enough qualifying stocks |
| 2005 | +24.6% | +40.6% | India bull run: strategy missed 16pp |
| 2006 | +40.4% | +48.5% | Second consecutive underperformance vs Sensex |
| 2007 | +66.6% | +46.8% | Best relative year: +19.8% vs Sensex |
| 2008 | -67.4% | -51.3% | Worst year — 16pp worse than Sensex |
| 2009 | +29.1% | +76.3% | Missed the recovery by 47pp |
| 2014 | +54.2% | +33.5% | Modi election rally: outperformed by 20.7pp |
| 2017 | +55.2% | +27.1% | Strong outperformance |
| 2021 | +70.5% | +22.9% | Best year vs Sensex: +47.7pp |
| 2023 | +52.9% | +17.5% | Continued strong outperformance |
| 2025 | -11.4% | +4.3% | Underperformed as momentum reversed |
The 2001-2004 cash periods cost returns. The strategy held no positions for its first four years because fewer than 10 Indian stocks passed all filters. During this period the Sensex had significant moves in both directions. Missing these periods isn't cleanly good or bad, but the 2003 Sensex recovery (+79.1%) happened while the strategy sat in cash.
2009 is the clearest underperformance. The Sensex rebounded 76.3% after the 2008 crash. The strategy captured only 29.1%. The stocks with the best volume-confirmed momentum entering 2009 were defensive names that hadn't fallen far. The beaten-down cyclicals and financials that led India's recovery weren't in the portfolio. That's a 47pp miss in one year that took years to recover from.
2021 and 2023 show the factor can work. The strategy delivered +47.7pp and +35.4pp excess over the Sensex in those years. When Indian institutional investors were systematically accumulating positions in specific sectors, the volume filter picked up those names early. The factor fires in the right conditions — it just doesn't fire consistently enough to outperform the index over 24.5 years.
Why the strategy underperforms the Sensex overall. The bulk of India's equity returns over 2001-2025 came from the broad market growing — Sensex 13.18% CAGR reflects genuine structural growth in Indian corporate earnings. A momentum filter adds selection complexity without reliably picking the stocks that drove index returns. The 2005-2006 bull run largely bypassed the momentum-volume screen. The 2009 recovery was led by sectors with bad trailing momentum. Volume confirmation, however well-grounded academically, doesn't consistently identify the next year's best performers.
Live screen. The current India volume-confirmed momentum screen is live on Ceta Research: cetaresearch.com/data-explorer?q=HG2Mwr2zxt
Backtest Methodology
- Data: FMP financial data via Ceta Research warehouse. Price data from
stock_eod(adjusted closes). - Point-in-time: Quality filters use annual FY filings with 45-day reporting lag. No look-ahead bias.
- Signal: Price at T-12M to T-1M. Skip last month avoids short-term reversal contamination per Jegadeesh & Titman (1993).
- Volume ratio: 63-day avg daily volume divided by 252-day avg daily volume, computed at each rebalance date.
- Data quality: Stocks with adjusted close < $1 at either lookback date excluded. Portfolio momentum capped at 200% per stock.
- Equal weight: 30 positions, 3.33% each. No intraperiod rebalancing.
- Transaction costs: Modeled as size-tiered commissions. See methodology.
- Benchmark: Sensex (^BSESN), INR-denominated. Strategy returns are also INR-denominated.
- Execution: Next-day close (MOC model). Entry prices use the trading day after the rebalance signal date.
Limitations
Currency risk. The strategy and Sensex returns are in INR. A USD-based investor would face INR/USD exchange rate exposure. The INR has depreciated against the USD over this period — a USD investor's actual returns would be lower than the 12.21% CAGR shown.
The Sensex beat it. Over 24.5 years, a passive Sensex investment returned 13.18% CAGR vs the strategy's 12.21%. The strategy's lower down capture (70.6%) provides some risk reduction, but the cost is lower compounded wealth over a full cycle.
Cash periods hurt in a bull market. The strategy sat in cash 20% of the time. When India was in a structural bull market (2004-2007, 2014-2017, 2021-2023), cash periods meant missed returns.
2008 tail risk. The -67.4% drawdown is severe. A portfolio that drops 67% needs a 200%+ gain to recover. The strategy did recover, but investors who couldn't hold through the drawdown locked in catastrophic losses.
Data coverage pre-2004. The 2001-2004 cash periods reflect thin FMP coverage for Indian stocks at that time. The effective track record starts from 2005.
Takeaway
India produced 12.21% CAGR over 24.5 years — strong absolute performance by any standard. But the Sensex produced 13.18%. The volume-confirmed momentum filter added selection complexity without adding net alpha over the full period.
The factor shows genuine value in specific years (2021, 2023) and provides real downside protection (70.6% down capture). But the cash periods during India's strongest years, plus the missed 2009 recovery, erode the advantage that individual good years provide.
Investors who want Indian equity exposure with somewhat lower drawdown exposure can consider this profile. The trade-off is clear: lower up capture in the best years, lower down capture in bad ones. Over 24.5 years, that asymmetry slightly underperforms the index.
Part of a Series
This is part of a multi-exchange volume-confirmed momentum study:
- Volume-Confirmed Momentum: US Stocks
- Volume-Confirmed Momentum: India
- Volume-Confirmed Momentum: Canada
- Volume-Confirmed Momentum: Sweden
- Volume-Confirmed Momentum: 17-Exchange Comparison
References
- Lee, C. & Swaminathan, B. (2000). Price Momentum and Trading Volume. Journal of Finance, 55(5), 2017-2069.
- Jegadeesh, N. & Titman, S. (1993). Returns to Buying Winners and Selling Losers. Journal of Finance, 48(1), 65-91.
- Daniel, K. & Moskowitz, T. (2016). Momentum Crashes. Journal of Financial Economics.
Past performance does not guarantee future results. This is educational content, not investment advice.


