UK stocks
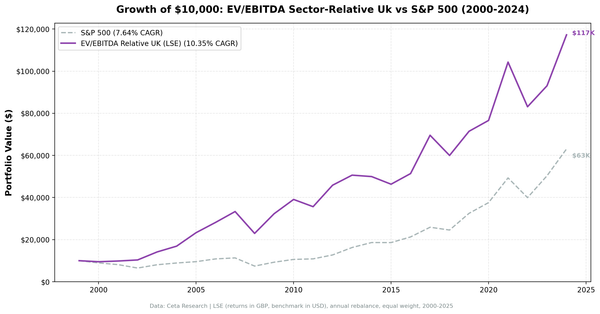
EV/EBITDA Sector Discount on UK Stocks: Consistent, Not Spectacular
We backtested a sector-relative EV/EBITDA screen on 25 years of UK stock data (LSE). 9.77% CAGR vs 0.86% for the FTSE 100 (price return), zero cash periods, and a max drawdown of -31.12%. Note: FTSE 100 is price-only — true excess vs total-return FTSE is closer to +5-6% annually.