
Sustained ROIC on Indian Stocks: 14.25% CAGR, Beats Sensex by 2.76%
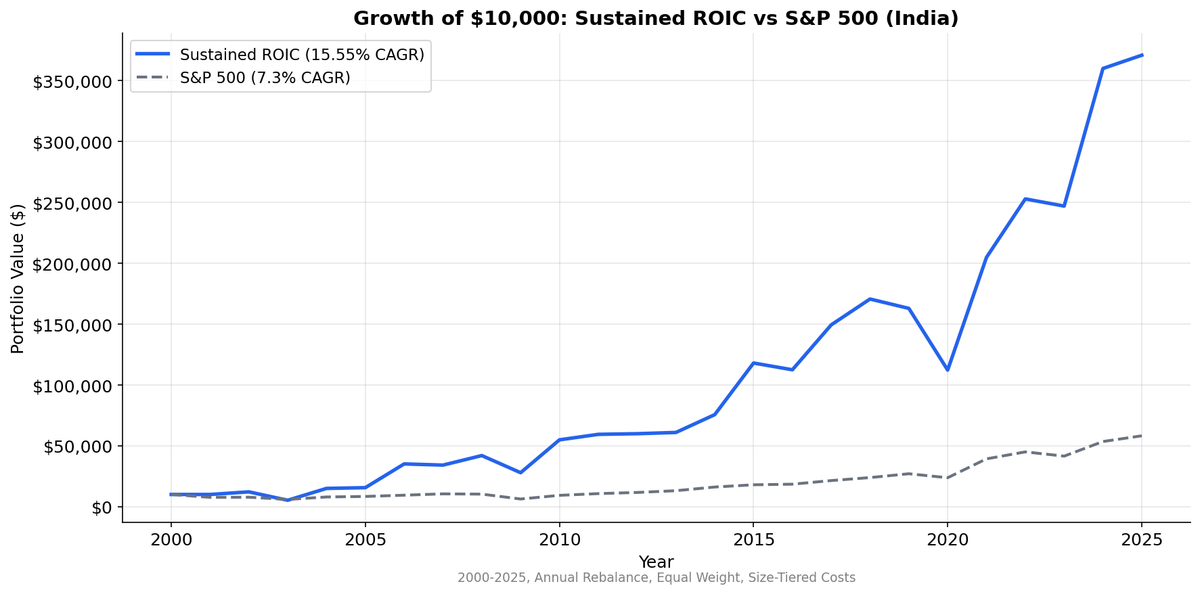
Sustained high ROIC on BSE+NSE from 2000 to 2025. 15.55% CAGR vs 7.30% SPY. India is the only market where persistence alpha (+4.98%) is positive. The trade-off: 52% volatility and -56.9% max drawdown.

India delivers exceptional absolute returns for sustained ROIC. NSE stocks with ROIC above 12% in three or more of the last five fiscal years returned 14.25% annually from 2000 to 2025, beating the Sensex by 2.76%. The +4.31% persistence alpha, the gap between sustained and single-year high-ROIC stocks, is among the highest globally. In most developed markets the persistence premium is negative or flat.
Contents
- Part of a Series
- Method
- The Screen
- What We Found
- Sustained ROIC vs Benchmarks: 2000-2025
- Decade Breakdown
- Why India Works for This Strategy
- When It Fails
- Annual Returns
- Limitations
- Takeaway
- Run It Yourself
The trade-off is volatility. At 51.86%, this is a rough ride. Max drawdown hit -55.9%. But for investors who can stomach that, 14.25% CAGR with +2.76% excess over Sensex across 25 years is compelling.
Data: FMP financial data warehouse, 2000–2025. Updated March 2026.
Part of a Series
This is the India regional analysis for the Sustained ROIC strategy. The US blog covers the full methodology, ROIC formula, and why multi-year persistence matters more than single-year screening.
Method
| Parameter | Value |
|---|---|
| Universe | NSE, market cap > Rs.20B (~$240M USD) |
| Signal | ROIC > 12% in 3+ of last 5 fiscal years |
| ROIC formula | NOPAT / Invested Capital |
| Rebalancing | Annual (April 1), equal weight |
| Data lag | 45-day minimum (point-in-time) |
| Transaction costs | Size-tiered (0.1-0.5% per trade) |
| Benchmark | Sensex (NSE equity index) |
| Period | 2000-2025 (25 years) |
| Data source | FMP via Ceta Research warehouse |
| Code | github.com/ceta-research/backtests |
ROIC = NOPAT / Invested Capital, where NOPAT = Operating Income x (1 - effective tax rate) and Invested Capital = Total Assets - Current Liabilities - Cash. Three portfolios are compared: sustained (3+ years above 12%), single-year (current year above 12% but fewer qualifying years), and low (current ROIC below 12%).
Returns are in INR. Sensex benchmark is also INR (local currency comparison).
The Screen
The SQL below runs against Ceta Research's FMP financial data warehouse. It identifies Indian-listed stocks with sustained high ROIC using a five-year lookback.
WITH roic_history AS (
    SELECT
        k.symbol,
        k.fiscalYear,
        CASE
            WHEN (bs.totalAssets - bs.totalCurrentLiabilities
                  - COALESCE(bs.cashAndCashEquivalents, 0)) > 0
            THEN (ic.operatingIncome
                  * (1.0 - COALESCE(ic.incomeTaxExpense
                    / NULLIF(ic.incomeBeforeTax, 0), 0.25)))
                 / (bs.totalAssets - bs.totalCurrentLiabilities
                    - COALESCE(bs.cashAndCashEquivalents, 0))
            ELSE NULL
        END AS roic
    FROM key_metrics k
    JOIN income_statement ic ON k.symbol = ic.symbol
        AND k.fiscalYear = ic.fiscalYear AND ic.period = 'FY'
    JOIN balance_sheet_statement bs ON k.symbol = bs.symbol
        AND k.fiscalYear = bs.fiscalYear AND bs.period = 'FY'
    JOIN profile p ON k.symbol = p.symbol
    WHERE k.period = 'FY'
      AND p.exchange IN ('NSE')
      AND k.marketCap > 20000000000
      AND k.fiscalYear >= YEAR(CURRENT_DATE) - 5
),
roic_summary AS (
    SELECT
        symbol,
        COUNT(*) AS years_available,
        SUM(CASE WHEN roic > 0.12 THEN 1 ELSE 0 END) AS years_above_12,
        MAX(CASE WHEN fiscalYear = (SELECT MAX(fiscalYear) FROM roic_history)
            THEN roic ELSE NULL END) AS current_roic
    FROM roic_history
    WHERE roic IS NOT NULL
    GROUP BY symbol
    HAVING COUNT(*) >= 3
)
SELECT
    rs.symbol,
    p.companyName,
    ROUND(rs.current_roic * 100, 1) AS current_roic_pct,
    rs.years_above_12,
    rs.years_available,
    ROUND(k.marketCap / 1e9, 2) AS mktcap_bn_inr,
    p.sector
FROM roic_summary rs
JOIN profile p ON rs.symbol = p.symbol
JOIN key_metrics_ttm k ON rs.symbol = k.symbol
WHERE rs.years_above_12 >= 3
  AND p.exchange IN ('NSE')
  AND k.marketCap > 20000000000
ORDER BY rs.years_above_12 DESC, rs.current_roic DESC
LIMIT 50
The query computes ROIC manually from income statement and balance sheet data rather than relying on pre-computed fields. This gives transparency into the formula: NOPAT divided by invested capital, with a 25% default tax rate when the effective rate is unavailable.
What We Found
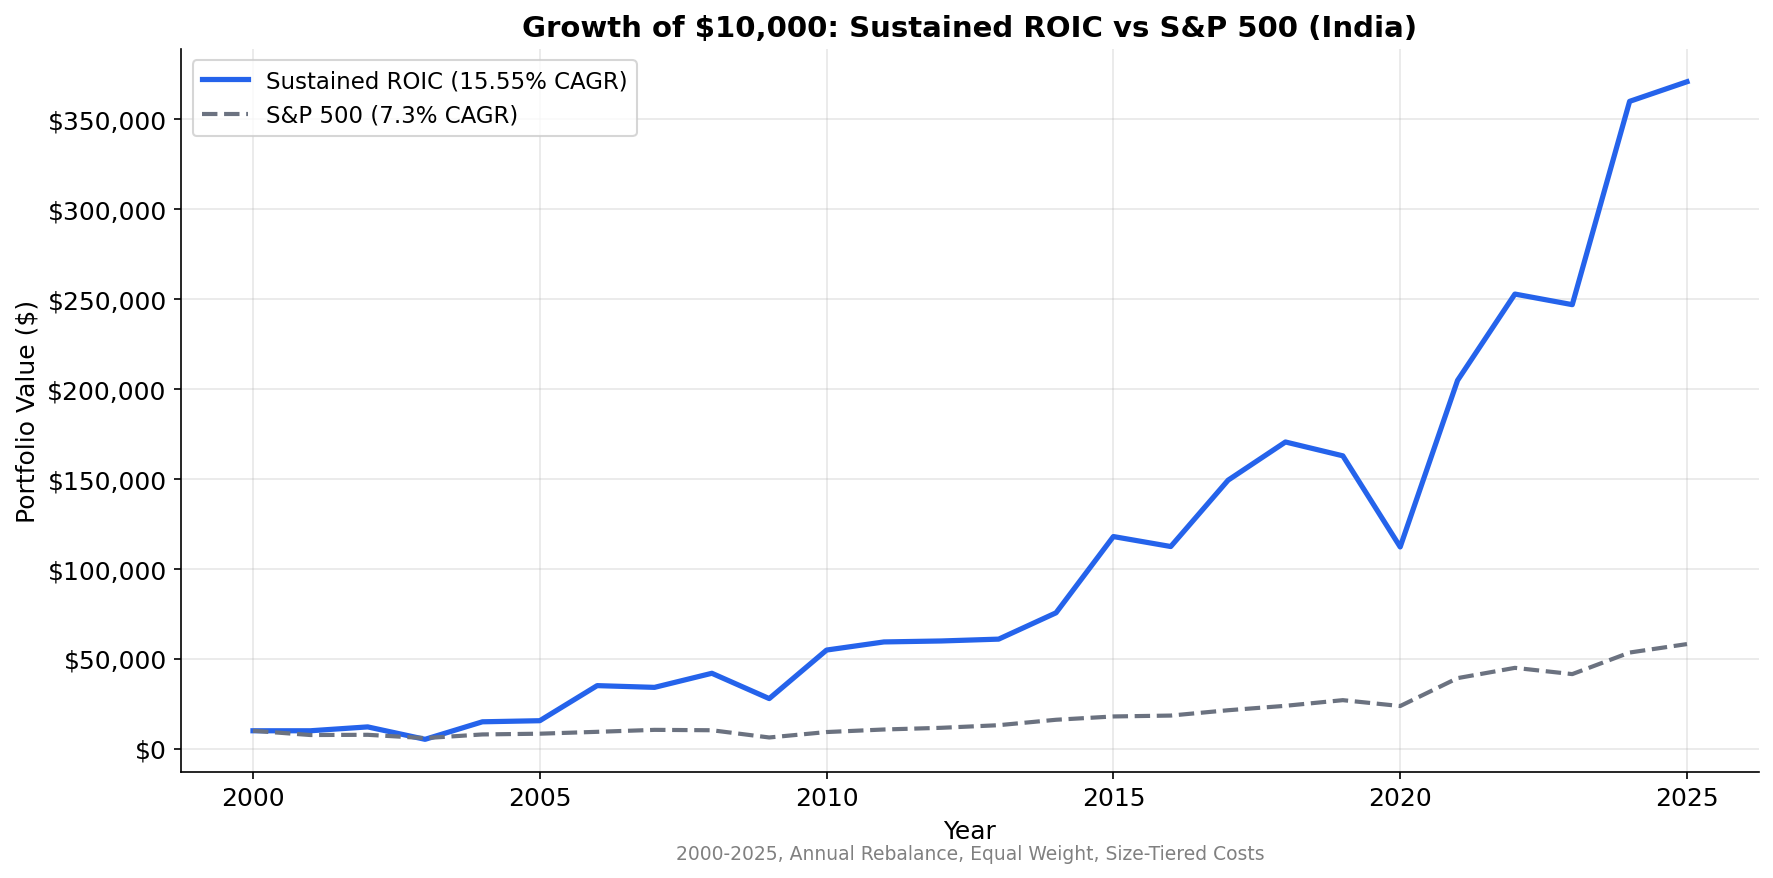
Sustained ROIC vs Benchmarks: 2000-2025
| Metric | Sustained ROIC | Single-Year ROIC | Low ROIC | Sensex |
|---|---|---|---|---|
| CAGR | 14.25% | 9.94% | 12.27% | 11.49% |
| Volatility | 51.86% | 41.32% | 40.52% | — |
| Sharpe | 0.149 | — | — | — |
| Sortino | 0.422 | — | — | — |
| Max Drawdown | -55.9% | — | — | -38.3% |
| Win Rate vs Sensex | 64% | — | — | — |
| Up Capture | 131.9% | — | — | 100% |
| Down Capture | 81.3% | — | — | 100% |
| Information Ratio | 0.372 | — | — | — |
| Beta | 1.416 | — | — | 1.0 |
| Alpha | +0.68% | — | — | — |
| Excess CAGR vs Sensex | +2.76% | -1.55% | +0.78% | — |
| Persistence Alpha | +4.31% | — | — | — |
| Avg Stocks | 141 | — | — | — |
| Total Universe | 269 | — | — | — |
| Sustained % of Universe | 49% | — | — | — |
| Cash Periods | 1 of 25 | — | — | — |
The persistence alpha of +4.31% is the headline number. That's the gap between sustained and single-year ROIC portfolios. In the US, persistence alpha was -0.48%. In Germany, -0.86%. In the UK, -3.40%. India has one of the strongest persistence premiums globally. Companies that maintain high ROIC for multiple years in India earn a genuine premium over companies that hit it once.
The 49% sustained rate is also notable. Nearly half the qualifying Indian universe passes the three-year persistence test. That's a much higher rate than the US (~30%) or Germany (~33%). Indian companies that cross the ROIC threshold tend to stay there.
Decade Breakdown
| Period | Sustained vs Sensex | Notes |
|---|---|---|
| 2000-04 | +12.2% | Strong outperformance, Sensex recovery period |
| 2005-09 | +12.2% | India growth era, sustained ROIC captured compounders |
| 2010-14 | +8.3% | Continued outperformance |
| 2015-19 | -0.0% | Flat, GST/demonetization hit both groups equally |
| 2020-25 | +5.5% | Post-COVID domestic demand recovery |
The early 2000s and mid-2000s numbers show consistent outperformance. The 2005-2009 period is the cleanest signal: +12.2% excess when India's domestic growth boom rewarded companies with real competitive advantages.
The 2015-2019 flat performance is real. GST implementation disrupted working capital across Indian businesses. Demonetization added friction. The IL&FS and NBFC crises triggered a credit squeeze. Sustained ROIC companies weren't immune because these were structural macro disruptions, not competitive failures. The screen looks backward at historical ROIC but can't predict regulatory shocks.
Why India Works for This Strategy
Three structural factors explain why persistence alpha is positive in India but not in other markets.
ROIC persistence is genuinely scarce. In the US, hundreds of large companies maintain ROIC above 12% for years. The signal is crowded. In India, achieving sustained high ROIC requires navigating high borrowing costs (repo rate above 6% for most of this period), infrastructure constraints, complex regulatory compliance, and working capital pressures from long receivable cycles. Companies that manage all of this for three or more years have proven something real about their business model.
Sector composition favors moat businesses. The sustained ROIC universe in India concentrates in IT services (Infosys, TCS, HCL Tech: USD revenue, INR costs, minimal capex), consumer staples (Hindustan Unilever, Asian Paints: pricing power, brand loyalty, asset-light distribution), and private sector banks that manage their spread and provisioning well. These businesses have structural advantages that compound over time.
Less institutional arbitrage of the quality factor. India's mid-cap universe has lower quant fund penetration than the US. The quality premium, specifically the persistence premium, hasn't been arbitraged away to the same extent. Domestic retail and institutional investors recognize quality, but they don't systematically screen for multi-year ROIC persistence the way US quant funds do.
When It Fails
The 52.22% volatility and -56.9% max drawdown aren't abstract numbers. They represent specific periods where the strategy inflicted pain.
2015-2019: Four years of frustration. The sustained portfolio matched Sensex across this entire stretch. Demonetization (November 2016) temporarily disrupted cash flows for consumer businesses. GST implementation (July 2017) created a multi-quarter working capital disruption across sectors. The NBFC crisis (2018) triggered a liquidity squeeze that hit mid-cap quality names through contagion selling. These were macro events that overwhelmed company-level quality signals.
Volatility tax. A 51.86% annual volatility means large drawdowns are inevitable. The -55.9% max drawdown requires a 129% recovery just to break even. The 14.25% CAGR compensates for this over 25 years, but most investors can't sit through a 56% drawdown without reducing positions, which would destroy the realized return.
High beta (1.416) amplifies everything. The portfolio moves 1.4x the benchmark in both directions. The 131.9% up capture is attractive, but the 81.3% down capture means you're giving back most of the downside when markets fall. This isn't a defensive quality strategy. It's a leveraged bet on India's best businesses.
Annual Returns
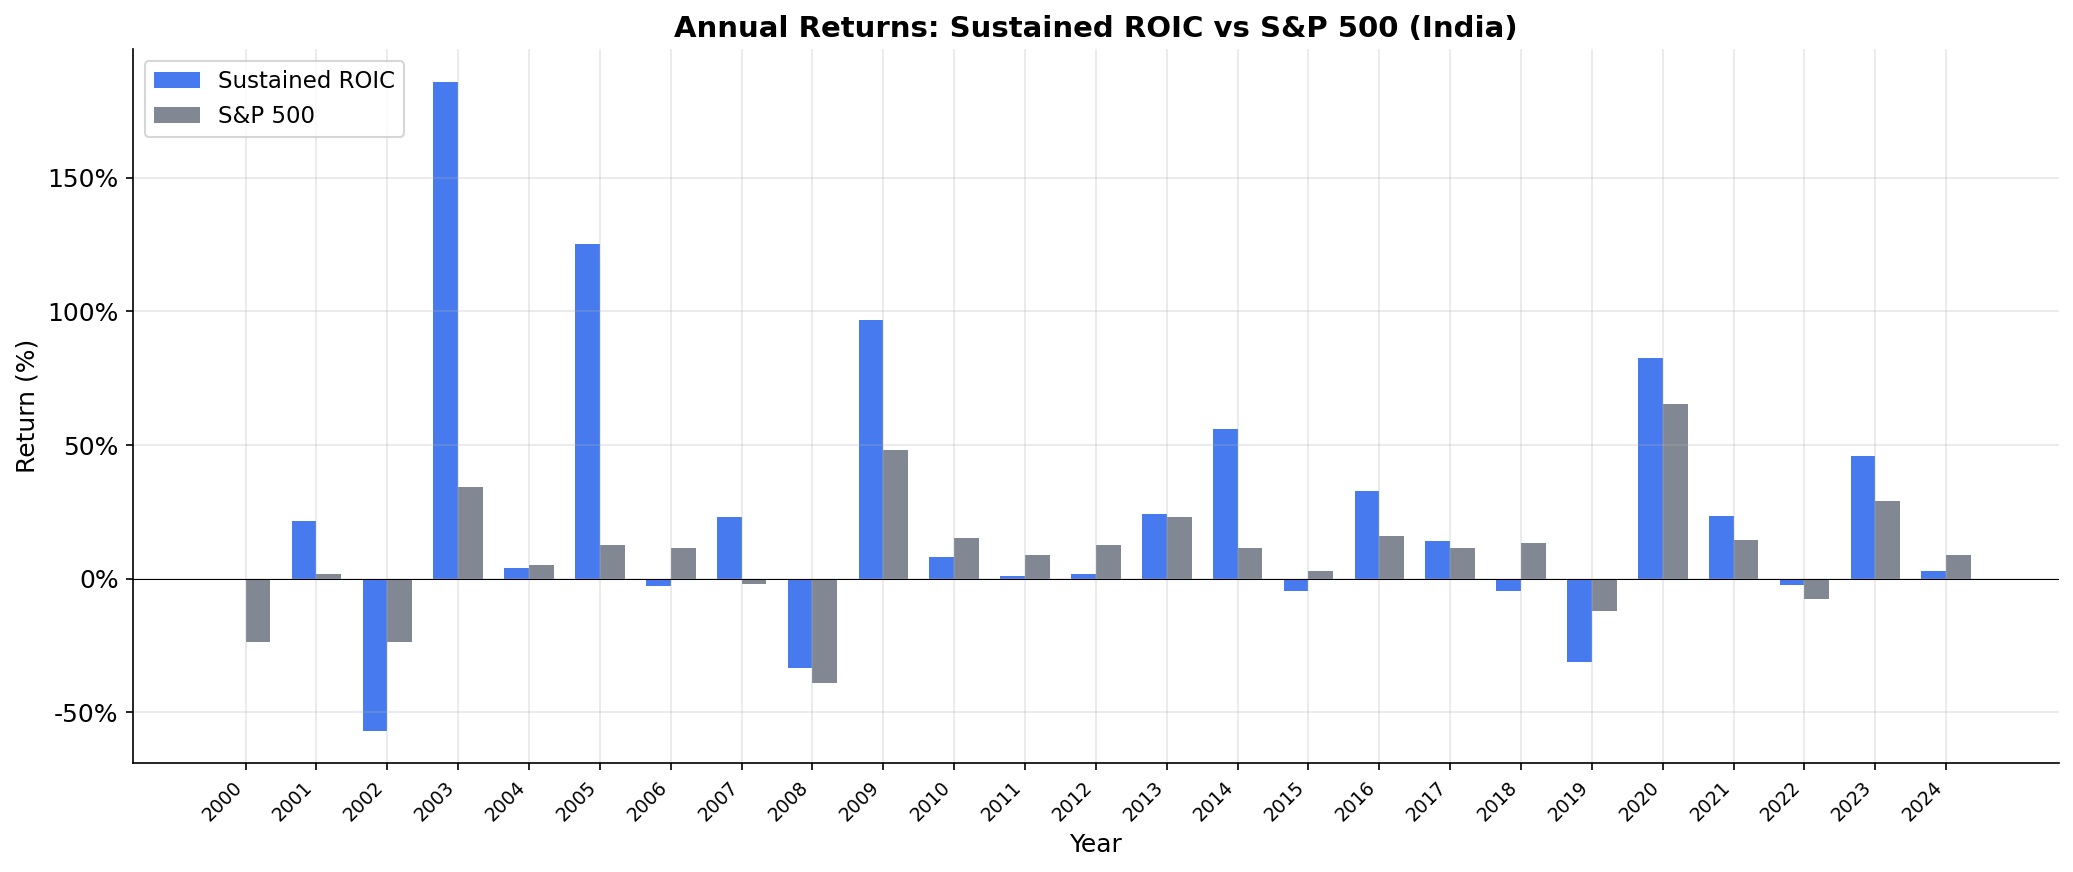
The year-by-year data shows the volatility of the excess return. The strategy produced +12.2% excess in the early 2000s but then flattened for the 2015-2019 stretch. The post-COVID recovery (2020-2025) shows the strategy working again as domestic demand recovered and quality businesses outperformed cyclicals.
Limitations
High volatility makes position sizing critical. At 51.86% annual volatility, a full allocation to this strategy would dominate any portfolio's risk profile. Most investors would need to size this as a partial allocation and accept lower portfolio-level returns.
Persistence premium may not persist. India's quality premium has been driven partly by the scarcity of sustained ROIC businesses and partly by lower institutional arbitrage. As index funds grow in India and quant strategies expand, the persistence alpha could compress.
Cash period in early years. One cash period in the early 2000s, when the universe was smaller and fewer companies had sufficient financial history.
Takeaway
India is the strongest market in this study for sustained ROIC. The 14.25% CAGR and +4.31% persistence alpha tell a clear story: in a market where maintaining high returns on capital is genuinely difficult, the companies that manage it get rewarded disproportionately.
The honest caveat is the volatility. At 51.86% with a -55.9% max drawdown, this strategy requires conviction and a long time horizon. The Sharpe of 0.149 reflects the risk-adjusted reality: the returns are high, but so is the price you pay in drawdowns.
Run It Yourself
The backtest code, methodology, and exchange-by-exchange results are open source.
github.com/ceta-research/backtests
The framework uses point-in-time data with a 45-day reporting lag. Annual rebalancing in April. Transaction costs are size-tiered. The same methodology runs across all exchanges in the study.
Data: Ceta Research (FMP financial data warehouse), 2000-2025. Universe: NSE, market cap > Rs.20B (~$240M USD). Annual rebalance (April 1), equal weight. Returns in INR. Benchmark: Sensex (NSE equity index, INR). Past performance does not guarantee future results. This is research, not investment advice.


