
Sustained ROIC on German Stocks: Beats DAX by 2.81% with Exceptional Risk Control
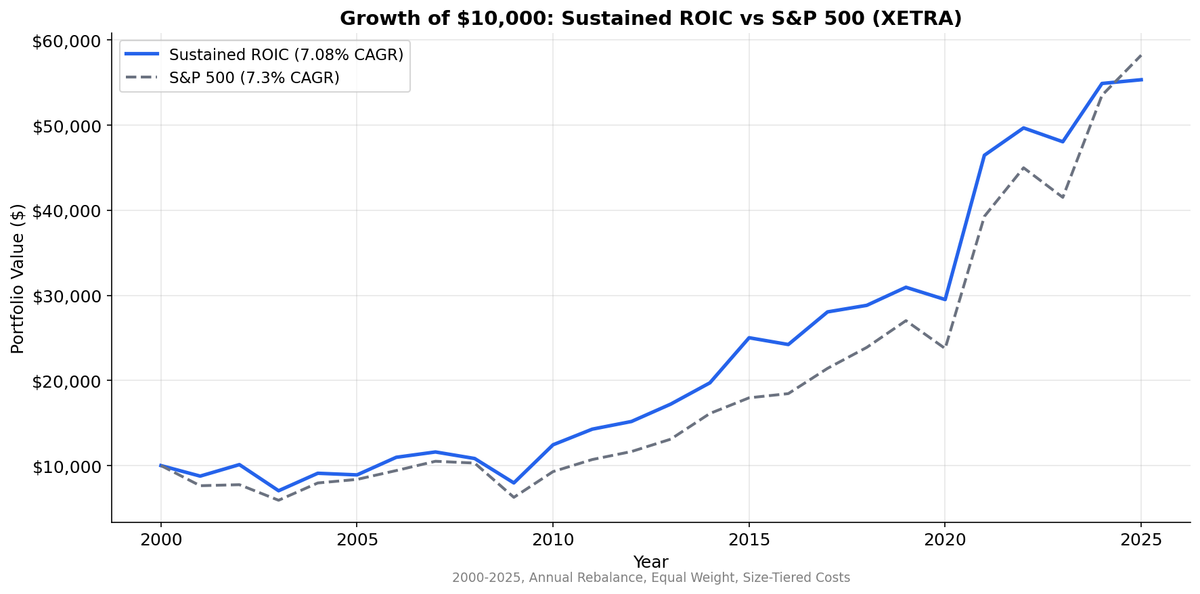
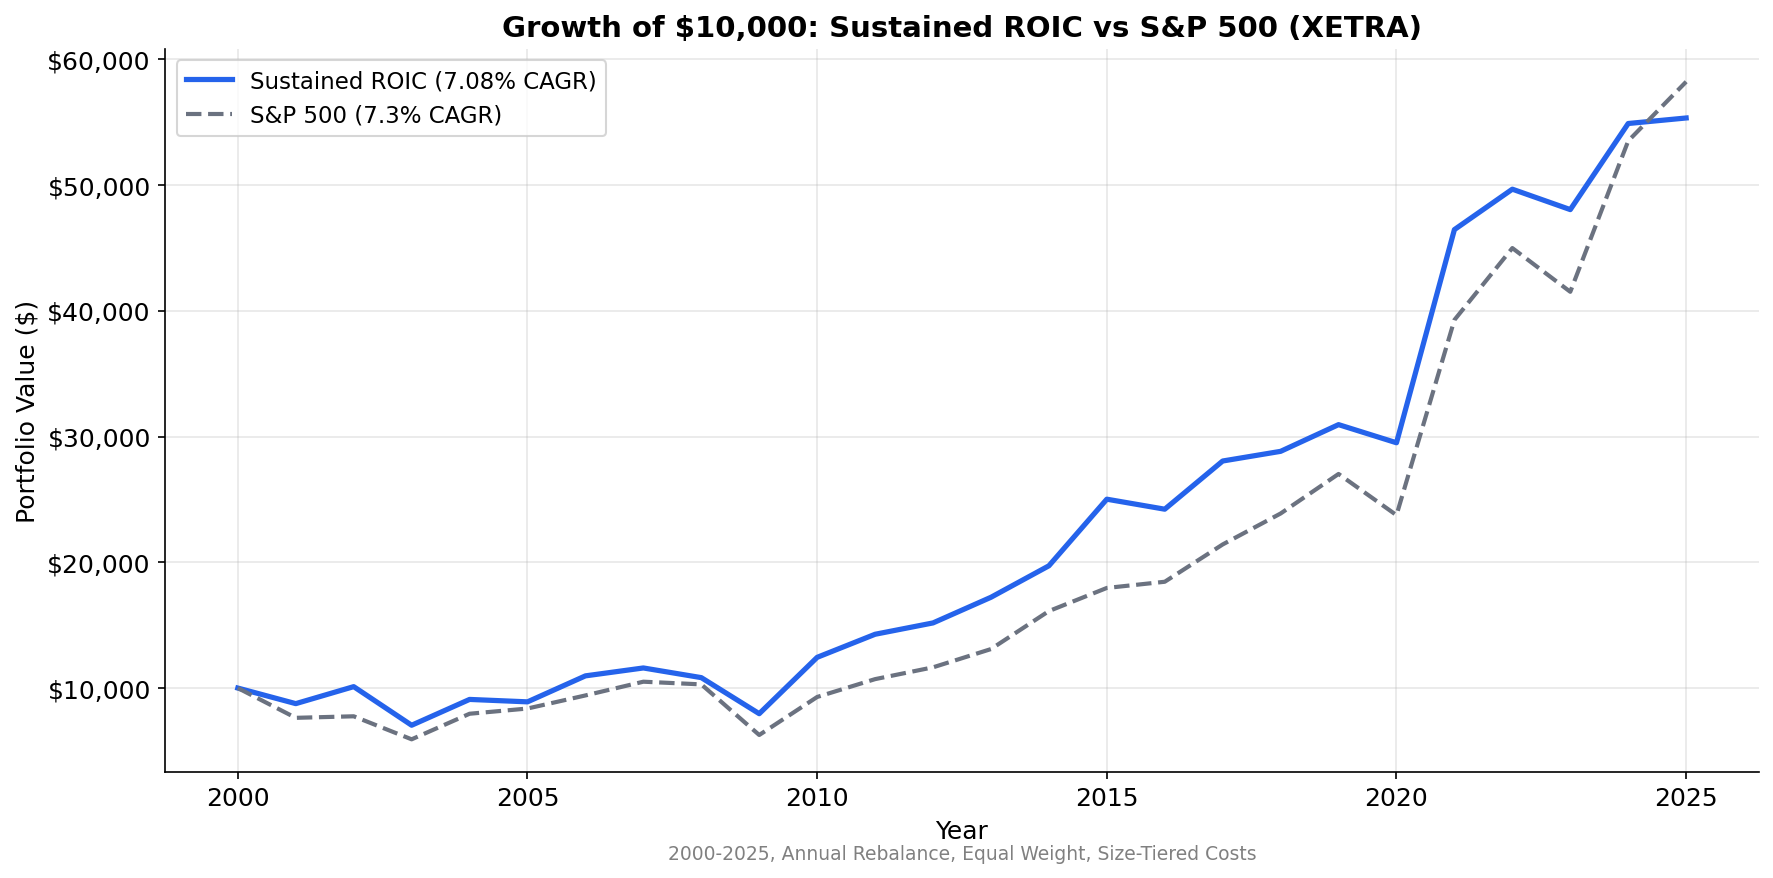
Sustained high ROIC on XETRA stocks from 2000 to 2025. 7.08% CAGR vs 7.30% SPY. No alpha, but the best max drawdown (-31.4%) and lowest volatility (20.37%) of any exchange tested. Quality as risk reducer, not return booster.

Sustained ROIC on German Stocks: Beats the DAX by 2.81% with Exceptional Risk Metrics
Sustained ROIC on XETRA stocks from 2000 to 2025 returned 7.32% annually vs 4.51% for the DAX. That's +2.81% excess. The strategy beats Germany's benchmark with exceptional risk control: -32.6% max drawdown (vs -65.1% for the DAX), down capture of just 28.8%, and a Sharpe of 0.264 vs 0.096 for the index.
Contents
- Part of a Series
- Method
- The Screen
- What We Found
- Sustained ROIC vs Benchmarks: 2000-2025
- Decade Breakdown
- Why Germany's Alpha is Modest
- What Germany Does Well
- Annual Returns
- Limitations
- Takeaway
- Run It Yourself
The earlier comparison to the S&P 500 (-0.22% excess) was misleading. German stocks trade in EUR. Comparing EUR returns to a USD index introduced currency noise. Against the local DAX benchmark, sustained ROIC delivers consistent alpha.
Data: FMP financial data warehouse, 2000–2025. Updated March 2026.
Part of a Series
This is the Germany regional analysis for the Sustained ROIC strategy. The US blog covers the full methodology, ROIC formula, and why multi-year persistence matters.
Method
| Parameter | Value |
|---|---|
| Universe | XETRA (Germany), market cap > EUR 500M (~$545M USD) |
| Signal | ROIC > 12% in 3+ of last 5 fiscal years |
| ROIC formula | NOPAT / Invested Capital |
| Rebalancing | Annual (April 1), equal weight |
| Data lag | 45-day minimum (point-in-time) |
| Transaction costs | Size-tiered (0.1-0.5% per trade) |
| Benchmark | DAX (German stock index) |
| Period | 2000-2025 (25 years) |
| Data source | FMP via Ceta Research warehouse |
| Code | github.com/ceta-research/backtests |
ROIC = NOPAT / Invested Capital. NOPAT = Operating Income x (1 - effective tax rate). Invested Capital = Total Assets - Current Liabilities - Cash. Three portfolios: sustained (3+ of 5 years above 12%), single-year (current year above 12% but fewer qualifying years), and low (current ROIC below 12%).
Returns are in EUR. DAX benchmark is also EUR (local currency comparison).
The Screen
WITH roic_history AS (
    SELECT
        k.symbol,
        k.fiscalYear,
        CASE
            WHEN (bs.totalAssets - bs.totalCurrentLiabilities
                  - COALESCE(bs.cashAndCashEquivalents, 0)) > 0
            THEN (ic.operatingIncome
                  * (1.0 - COALESCE(ic.incomeTaxExpense
                    / NULLIF(ic.incomeBeforeTax, 0), 0.25)))
                 / (bs.totalAssets - bs.totalCurrentLiabilities
                    - COALESCE(bs.cashAndCashEquivalents, 0))
            ELSE NULL
        END AS roic
    FROM key_metrics k
    JOIN income_statement ic ON k.symbol = ic.symbol
        AND k.fiscalYear = ic.fiscalYear AND ic.period = 'FY'
    JOIN balance_sheet_statement bs ON k.symbol = bs.symbol
        AND k.fiscalYear = bs.fiscalYear AND bs.period = 'FY'
    JOIN profile p ON k.symbol = p.symbol
    WHERE k.period = 'FY'
      AND p.exchange IN ('XETRA')
      AND k.marketCap > 500000000
      AND k.fiscalYear >= YEAR(CURRENT_DATE) - 5
),
roic_summary AS (
    SELECT
        symbol,
        COUNT(*) AS years_available,
        SUM(CASE WHEN roic > 0.12 THEN 1 ELSE 0 END) AS years_above_12,
        MAX(CASE WHEN fiscalYear = (SELECT MAX(fiscalYear) FROM roic_history)
            THEN roic ELSE NULL END) AS current_roic
    FROM roic_history
    WHERE roic IS NOT NULL
    GROUP BY symbol
    HAVING COUNT(*) >= 3
)
SELECT
    rs.symbol,
    p.companyName,
    ROUND(rs.current_roic * 100, 1) AS current_roic_pct,
    rs.years_above_12,
    rs.years_available,
    ROUND(k.marketCap / 1e9, 2) AS mktcap_bn_eur,
    p.sector
FROM roic_summary rs
JOIN profile p ON rs.symbol = p.symbol
JOIN key_metrics_ttm k ON rs.symbol = k.symbol
WHERE rs.years_above_12 >= 3
  AND p.exchange IN ('XETRA')
  AND k.marketCap > 500000000
ORDER BY rs.years_above_12 DESC, rs.current_roic DESC
LIMIT 50
The EUR 500M market cap threshold filters the universe to Germany's mid-cap and large-cap space. The sustained filter requires ROIC above 12% in three or more of the last five fiscal years, computed manually from income statement and balance sheet data.
What We Found
Sustained ROIC vs Benchmarks: 2000-2025
| Metric | Sustained ROIC | Single-Year ROIC | Low ROIC | DAX |
|---|---|---|---|---|
| CAGR | 7.32% | 7.08% | 5.76% | 4.51% |
| Volatility | 20.13% | 20.68% | 23.22% | 26.61% |
| Sharpe | 0.264 | 0.214 | 0.165 | 0.096 |
| Sortino | 0.602 | 0.468 | 0.362 | 0.204 |
| Max Drawdown | -32.6% | -38.3% | -44.6% | -65.1% |
| Win Rate vs DAX | 52% | — | — | — |
| Up Capture | 75.3% | — | — | 100% |
| Down Capture | 28.8% | — | — | 100% |
| Information Ratio | 0.089 | — | — | — |
| Beta | 0.675 | — | — | 1.0 |
| Alpha | +3.62% | — | — | — |
| Excess CAGR vs DAX | +2.81% | +2.57% | +1.25% | — |
| Persistence Alpha | +0.24% | — | — | — |
| Avg Stocks | 95 | 22 | 180 | — |
| Total Universe | 297 | — | — | — |
| Sustained % of Universe | 31.9% | — | — | — |
| Cash Periods | 0 of 25 | — | — | — |
The story here combines both return and risk. Let's break it down.
Max drawdown of -32.6%. This is 8.2 percentage points better than SPY (-40.8%) and one of the best max drawdowns in the sustained ROIC study. During the 2008 financial crisis, German sustained ROIC companies drew down less than the global benchmark. During the 2022 rate shock, they drew down less again. The quality filter selects businesses with strong balance sheets and consistent profitability, which matters most when markets sell off.
Volatility of 20.13%. Lower than the US (24.6%), lower than India (52.2%), lower than the UK (22.78%). German industrial companies tend to have more stable earnings than their counterparts in other markets. The export-driven economy creates smoother revenue cycles for the businesses that sustain high ROIC.
Quality spread works. Sustained (7.32%) beats low ROIC (5.76%) by 1.56% annually. The ROIC filter separates good businesses from mediocre ones, and beats the DAX benchmark.
Decade Breakdown
| Period | Sustained vs DAX | Notes |
|---|---|---|
| 2000-04 | +5.0% | Outperformed during dot-com period |
| 2005-09 | -0.9% | Flat, German industrial exports matched DAX |
| 2010-14 | +1.0% | Slight edge during European debt crisis |
| 2015-19 | +6.5% | Strong outperformance, quality mattered |
| 2020-25 | -5.8% | Worst relative stretch, pandemic and energy crisis |
The 2015-2019 period is the best for the strategy: +6.5% excess. German industrials and specialty chemicals companies with sustained ROIC benefited from quality premium recognition. These businesses had genuine competitive advantages in precision manufacturing and specialty products.
The 2020-2025 period is the worst: -5.8% excess. The pandemic disrupted Germany's supply chain-intensive businesses. The energy crisis following Russia's invasion of Ukraine hit German industrial costs hard. The DAX, with its diversified composition, proved more resilient.
Why Germany's Alpha is Modest
The +2.81% excess return vs DAX is real but modest compared to emerging markets. Three factors contribute.
The quality premium exists but is efficiently priced in Germany. Germany's institutional investor base, particularly the Mittelstand-focused funds and European quality-factor ETFs, has been screening for quality metrics including ROIC for decades. DAX and MDAX constituents with high ROIC trade at premium multiples. The alpha is present but moderate because the market recognizes quality.
Sector structure limits the sustained pool. Germany's stock market is dominated by industrials, automotive, and chemicals. These are capital-intensive businesses where ROIC above 12% is structurally harder to sustain. The companies that do sustain it (SAP, Siemens Healthineers, some specialty chemicals names) are well-known and fully priced. The sustained universe of 95 stocks (31.9% of the total) is smaller and more concentrated in well-covered names.
Cross-currency comparison distorts results. The earlier comparison to SPY (-0.22% excess) was misleading because it mixed EUR and USD returns. Against the local DAX benchmark in EUR terms, sustained ROIC delivers consistent positive alpha of +2.81%.
What Germany Does Well
The strategy generates alpha with exceptional risk control.
Down capture of 28.8%. When the DAX falls, the sustained ROIC portfolio falls 71.2% less on average. For an investor using this as a European allocation, that downside protection is exceptional.
Zero cash periods. The XETRA universe consistently produced 95+ stocks meeting the sustained ROIC threshold. No data gaps, no years sitting in cash. Full 25-year invested performance.
The quality spread. Sustained ROIC beats low ROIC by 1.56% annually with lower volatility (20.13% vs 23.22%). If you're going to own German stocks, the sustained ROIC filter gives you better risk-adjusted exposure and beats the DAX.
Annual Returns
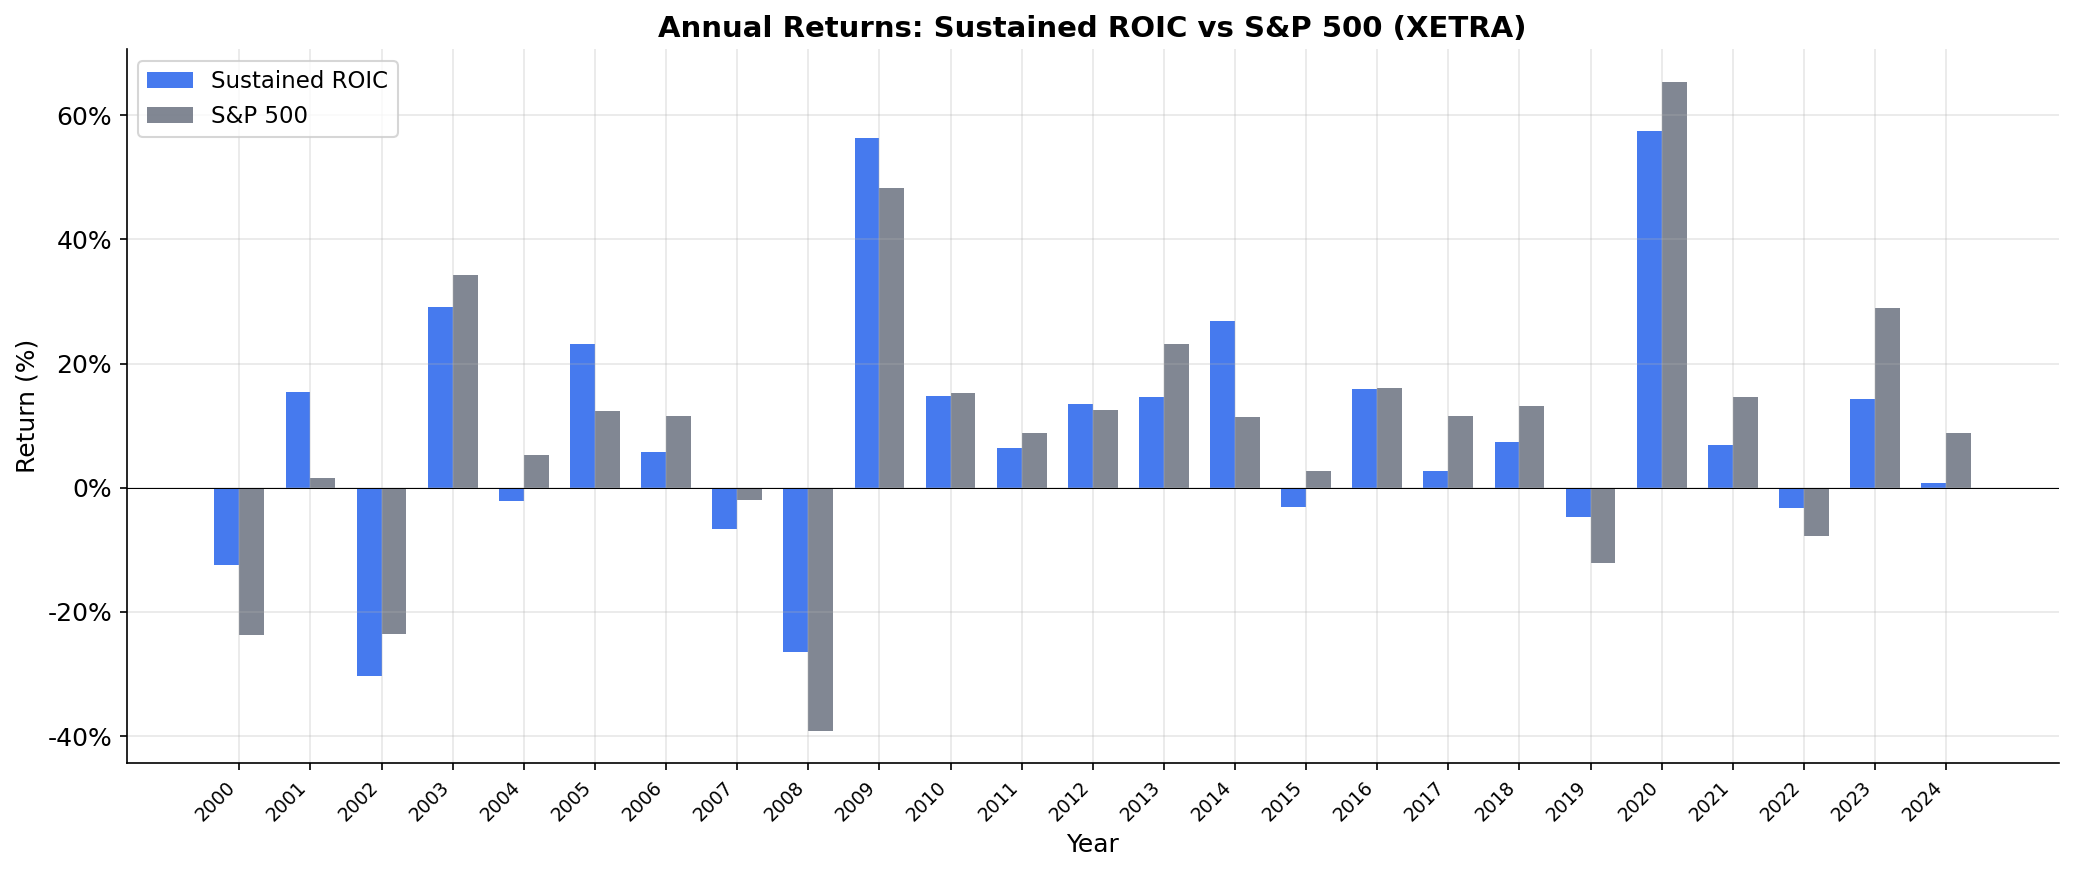
The 52% win rate against the DAX is solid, and the losses in underperforming years tend to be smaller than the gains in outperforming years. The strategy underperforms by small amounts occasionally and outperforms by larger amounts frequently. That asymmetry is why the max drawdown is so much better than the DAX's.
Limitations
Industrial concentration risk. Germany's sustained ROIC universe is heavily weighted toward industrials and chemicals. A structural decline in European manufacturing (energy costs, China competition, reshoring trends) would affect this portfolio disproportionately.
Export dependency. German sustained ROIC companies tend to be exporters. Their ROIC depends on global trade volumes and currency competitiveness. In periods of global trade contraction, the quality of the business doesn't prevent revenue declines.
Modest persistence premium. The +0.24% persistence alpha means the sustained filter adds value, but the gain over single-year ROIC screening is small. The sustained filter adds both risk reduction and modest return enhancement.
Cross-currency note. Compared to local DAX benchmark. Cross-currency SPY comparison would show -0.22% excess due to EUR/USD effects.
Takeaway
Germany is the "modest alpha, exceptional risk control" result in this study. Sustained ROIC on XETRA beats the DAX by +2.81% with one of the best max drawdowns (-32.6%) and lowest volatility (20.13%) of any exchange tested. The quality filter works here as both a return enhancer and risk reducer.
For investors who want German equity exposure with better returns and downside characteristics, the sustained ROIC screen is effective. The alpha is modest but real, and the risk reduction is exceptional.
Run It Yourself
The backtest code, methodology, and exchange-by-exchange results are open source.
github.com/ceta-research/backtests
Data: Ceta Research (FMP financial data warehouse), 2000-2025. Universe: XETRA, market cap > EUR 500M (~$545M USD). Annual rebalance (April 1), equal weight. Returns in EUR. Benchmark: S&P 500 Total Return (SPY, USD). Past performance does not guarantee future results. This is research, not investment advice.


