
Survivorship Bias: The 2% Error in Every S&P 500 Backtest
We ran the same value screen on the S&P 500 twice: once with today's members, once with historical membership. Survivorship bias inflated CAGR by 2.02% and hid 7.8 percentage points of drawdown over 25 years. The risk distortion is worse than the return distortion.

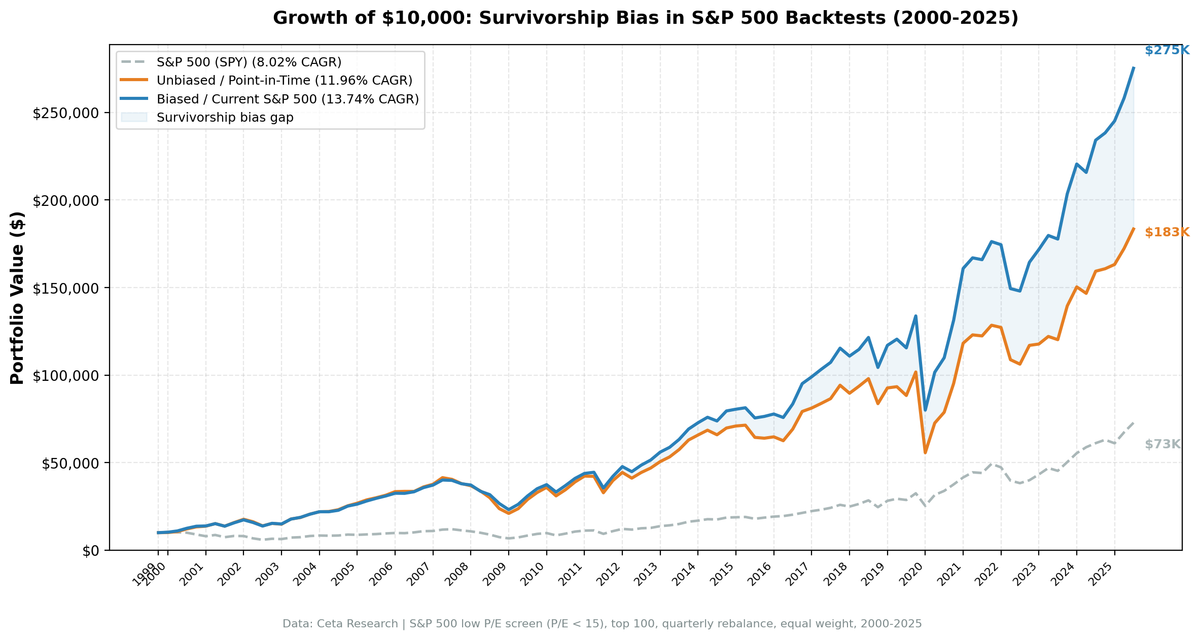
Survivorship bias inflates S&P 500 value backtest returns by 1.78% CAGR annually. Over 25 years, that turns a $183k terminal value into $275k of phantom gains. The return distortion gets all the attention, but the risk distortion is worse: biased backtests hide 7.1 percentage points of drawdown and overstate the Sharpe ratio by 0.141.
Contents
- Method
- The Screens
- Biased Screen (Current S&P 500)
- Unbiased Screen (Point-in-Time S&P 500)
- Results
- Survivorship bias inflates CAGR by 1.78%, but the risk distortion matters more.
- Both universes beat SPY.
- Where the Bias Comes From
- Decade Breakdown (Average Quarterly Returns)
- Specific examples that drove the gap:
- When It's Worst
- How to Avoid It
- Limitations
Data: FMP financial data warehouse, 2000–2025. Updated March 2026.
Method
We ran the same value strategy twice on the S&P 500, from Q1 2000 through Q3 2025 (103 quarterly periods).
Strategy: Buy the lowest P/E quintile (0 < P/E < 15), equal weight, quarterly rebalance.
Two universes:
- Biased: At every rebalance date, use today's S&P 500 members. Look up their historical financials. This is how most backtests work.
- Unbiased: At every rebalance date, reconstruct the S&P 500 as it existed at that time using point-in-time constituent data. This includes companies that were later removed, acquired, or went bankrupt.
Benchmark: SPY (S&P 500 Total Return).
Transaction costs: Size-tiered, 0.1-0.5% per trade depending on market cap.
Filing lag: 45 days. January rebalances use Q3 data. This prevents look-ahead bias on earnings.
Data: FMP financial data via Ceta Research. Historical S&P 500 membership from the historical_sp500_constituent table, which tracks additions and removals with dates.
Average portfolio: 90 stocks per rebalance in both universes. The point-in-time S&P 500 averaged 669 members (including companies awaiting removal), with 25.4 survivorship victims per period.
The Screens
Biased Screen (Current S&P 500)
-- Uses today's S&P 500 list for historical dates (WRONG)
SELECT
    f.symbol,
    f.peRatioTTM AS pe_ratio,
    k.marketCap / 1e9 AS market_cap_billions
FROM financial_ratios f
JOIN key_metrics k
    ON f.symbol = k.symbol AND CAST(f.date AS DATE) = CAST(k.date AS DATE)
WHERE f.symbol IN (
    SELECT symbol FROM sp500_constituent
)
  AND CAST(f.date AS DATE) = '2008-01-01'
  AND f.peRatioTTM > 0
  AND f.peRatioTTM < 15
ORDER BY f.peRatioTTM ASC
LIMIT 100
This query joins today's membership with historical financials. Every stock on this list survived to the present. Lehman Brothers, Washington Mutual, Enron? Not here. They were all in the S&P 500 at various points, but they aren't in today's list. Their losses vanish from the backtest.
Unbiased Screen (Point-in-Time S&P 500)
-- Reconstructs S&P 500 as it existed at the historical date (CORRECT)
WITH sp500_at_date AS (
    SELECT DISTINCT symbol
    FROM historical_sp500_constituent
    WHERE TRY_STRPTIME(dateAdded, '%B %d, %Y') <= '2008-01-01'
      AND (CAST(date AS DATE) > '2008-01-01' OR date IS NULL)
)
SELECT
    f.symbol,
    f.peRatioTTM AS pe_ratio,
    k.marketCap / 1e9 AS market_cap_billions
FROM financial_ratios f
JOIN key_metrics k
    ON f.symbol = k.symbol AND CAST(f.date AS DATE) = CAST(k.date AS DATE)
WHERE f.symbol IN (SELECT symbol FROM sp500_at_date)
  AND CAST(f.date AS DATE) = '2008-01-01'
  AND f.peRatioTTM > 0
  AND f.peRatioTTM < 15
ORDER BY f.peRatioTTM ASC
LIMIT 100
The CTE sp500_at_date reconstructs the index as of January 1, 2008. A stock is included if it was added before that date and not yet removed. On this date, Lehman Brothers, Bear Stearns, and Washington Mutual were all S&P 500 members. They all had low P/E ratios. They would have been selected by the value screen. Within a year, all three were gone.
Results
Survivorship bias inflates CAGR by 1.78%, but the risk distortion matters more.
| Metric | Biased | Unbiased | SPY | Bias Gap |
|---|---|---|---|---|
| CAGR | 13.74% | 11.96% | 8.02% | +1.78% |
| Total Return | 2652.66% | 1734.19% | 628.28% | +918.47% |
| Sharpe Ratio | 0.619 | 0.478 | 0.361 | +0.141 |
| Sortino Ratio | 0.961 | 0.726 | 0.536 | +0.235 |
| Calmar Ratio | 0.325 | 0.242 | 0.183 | +0.083 |
| Max Drawdown | -42.2% | -49.3% | -43.9% | +7.1pp |
| Volatility | 18.98% | 20.85% | 16.68% | -1.87pp |
| VaR (95%) | -13.2% | -14.4% | -14.6% | +1.2pp |
| Terminal Value ($10k) | ~$275k | ~$183k | ~$73k | +$92k |
The 1.78% CAGR gap is the headline. But look at the drawdown line. The biased backtest shows a 42.2% max drawdown. The unbiased version: 49.3%. That's 7.1 percentage points of hidden risk. An investor following this strategy during the 2008 crisis would have experienced the 49.3% drawdown, not the 42.2% the biased backtest promised.
The Sharpe ratio tells a similar story. Biased: 0.619. Unbiased: 0.478. The biased version makes this look like a meaningfully better risk-adjusted strategy than it actually was. The Sortino ratio gap (0.961 vs 0.726) shows the same pattern specifically for downside risk.
Both universes beat SPY.
| Metric | Biased vs SPY | Unbiased vs SPY |
|---|---|---|
| Excess CAGR | +5.72% | +3.94% |
| Alpha | +5.80% | +3.55% |
| Beta | 0.987 | 1.065 |
| Up Capture | 114.0% | 113.3% |
| Down Capture | 66.7% | 77.8% |
The value strategy works in both universes. The unbiased version still delivers 3.94% excess CAGR over SPY, with an alpha of 3.55%. That's a real edge.
But look at down capture. Biased: 66.7%. Unbiased: 77.8%. The biased backtest claims the strategy captures only two-thirds of market declines. The reality is closer to four-fifths. During crashes, the performance gap widens because that's exactly when the survivorship victims (failed financials, bankrupt energy companies) drag the unbiased portfolio down hardest.
Where the Bias Comes From
The bias isn't uniform across time. It's concentrated in periods with major corporate failures.
Decade Breakdown (Average Quarterly Returns)
| Period | Biased | Unbiased | Gap | SPY |
|---|---|---|---|---|
| 2000-04 | 5.1% | 5.1% | 0.0% | -0.2% |
| 2005-09 | 2.0% | 1.8% | +0.2% | 0.5% |
| 2010-14 | 4.6% | 4.3% | +0.3% | 3.9% |
| 2015-19 | 2.9% | 2.2% | +0.7% | 3.0% |
| 2020-25 | 4.1% | 3.8% | +0.4% | 4.0% |
The early 2000s show no gap. Both universes performed identically because the dot-com victims were mostly high-P/E tech stocks that wouldn't have appeared in a low-P/E screen anyway.
The gap peaks in 2015-19 at 0.7% per quarter. By this period, cumulative constituent changes had created a large divergence between today's list and historical membership. The biased universe was increasingly populated by stocks that "made it," while the unbiased universe kept including the ones that didn't.
Specific examples that drove the gap:
Financials (2007-2009): Lehman Brothers (P/E ~8 before collapse), Washington Mutual (P/E ~7), Bear Stearns (P/E ~10). All appeared cheap on trailing earnings. All would have been selected by the value screen. All went to zero or near-zero. Q4 2008 tells the story: biased returned -15.89%, unbiased returned -20.86%. That 5 percentage point gap in a single quarter came from holding financial stocks the biased backtest conveniently excluded.
Energy (2001-2002): Enron had a P/E around 10 before the collapse. It was a top-10 S&P 500 company. The biased backtest pretends it never existed.
Technology (2000-2001): Profitable tech companies that still failed when the bubble burst. They had positive P/E ratios and looked like reasonable value picks right up until they didn't.
When It's Worst
The bias amplifies during market crises because that's when companies actually fail.
Q4 2008: Biased -15.89%, Unbiased -20.86%. A 5pp gap in one quarter. Lehman, WaMu, and other financial sector victims were all in the unbiased portfolio.
Q1 2020 (COVID): Biased -40.22%, Unbiased -45.32%. A 5.10pp gap. Energy and travel-related companies that were later removed from the index got hit hardest.
Q3 2015: Biased -7.15%, Unbiased -9.77%. Energy sector stress. Oil company removals from the S&P 500 hadn't happened yet in the unbiased universe but had effectively been pre-screened out in the biased universe.
In calm markets, the gap narrows to near-zero. Survivorship bias is a tail-risk problem. It hides losses precisely when losses matter most.
How to Avoid It
Use point-in-time constituent data. If your data source only provides today's index membership, your historical backtests are biased. The historical_sp500_constituent table tracks additions and removals with dates, letting you reconstruct the index at any point.
Haircut published results. If a paper or strategy report doesn't mention survivorship bias adjustment, assume 1-2% annual CAGR inflation and substantially worse risk metrics. For value strategies specifically, the risk distortion (drawdown, Sharpe) is typically larger than the return distortion.
Stress-test for failures. Ask: what happens if 2-3 portfolio holdings go to zero? The biased backtest hides this scenario. The unbiased backtest shows it happened multiple times over 25 years.
Watch the sector composition. Financials and energy drove most of the bias in our test. If your screen overweights these sectors, expect larger survivorship distortion.
Limitations
Delisting returns. When a company goes bankrupt, the exact final price is sometimes unclear. We use the last available close, which may not reflect the true loss. This could understate the bias for the worst outcomes.
Constituent timing. The historical S&P 500 data tracks announcement dates, not effective dates. There's typically a few days gap. We use announcement dates consistently across both universes.
Single strategy. We tested one value strategy (low P/E). Other strategies will show different bias magnitudes. Momentum strategies may have lower survivorship bias because they favor recent outperformers, not cheap stocks. Quality strategies may also be less affected because high-quality companies tend to survive.
Filing lag imprecision. We used a fixed 45-day lag. In practice, reporting delays vary by company. Some Q4 earnings are available in late January, others not until March. This affects both universes equally, so it doesn't bias the comparison, but it adds noise.
No sector-neutral control. We didn't test whether a sector-neutral version of the value screen would reduce the survivorship bias gap. Given that financials and energy drove most of the bias, sector constraints might significantly reduce it.
Data: Ceta Research (FMP financial data warehouse, 2000-2025). Backtest: 103 quarterly periods, equal weight, size-tiered transaction costs (0.1-0.5%), 45-day filing lag. Code: github.com/ceta-research/backtests/sp500-survivorship
Past performance does not guarantee future results. This is educational content, not investment advice.


