S&P 500 Index Reconstitution: 25 Years of Forced Trade Data
We measured every S&P 500 addition and removal from 2000-2025. Additions underperform SPY by -0.98% in the first week. Removals average +7.22% but the median is +0.73%. Here's what the gap means.

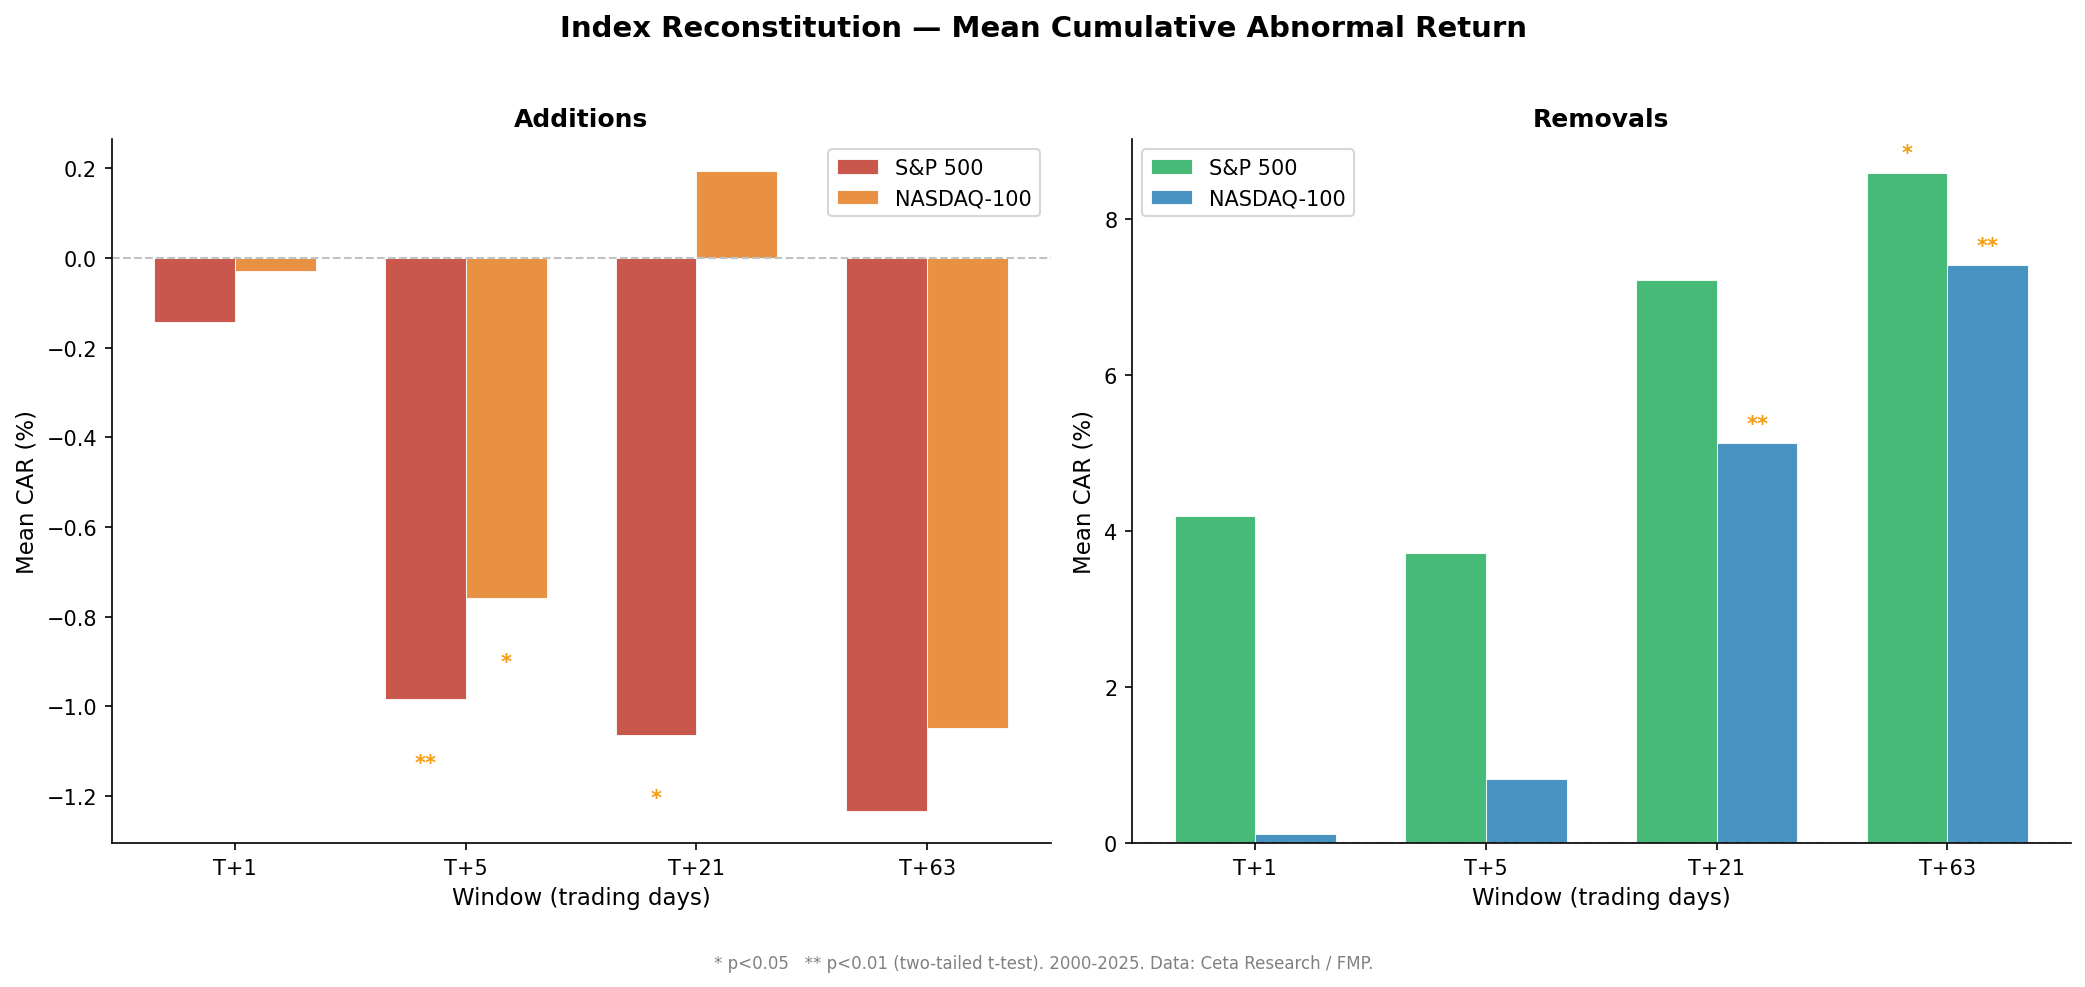
We measured every S&P 500 addition and removal from 2000–2025 using corrected event dates from the FMP constituent database. Additions underperform SPY by -0.98% in the first five trading days (t=-3.68, significant at 1%). Removals show a mean of +7.22% at T+21, but the median is +0.73%, and the gap matters.
Contents
- Method
- Academic Background
- What We Found
- Additions: a real, consistent effect
- Removals: the mean vs median story
- The Data
- S&P 500 Additions (N=465)
- S&P 500 Removals (N=186–196)
- The Screen
- Limitations
- Takeaway
- References
See also: NASDAQ-100 Index Reconstitution: the cleaner removal signal
Method
Data source: Ceta Research (FMP financial data warehouse) Event table: historical_sp500_constituent: symbol, dateAdded, removedTicker Price data: stock_eod: daily adjusted close prices Period: 2000–2025 Benchmark: SPY Event windows: T+1, T+5, T+21, T+63 trading days after the event date Event N: 465 additions, 214 removals (679 total)
The event date for both additions and removals is TRY_STRPTIME(dateAdded, '%B %d, %Y'). The date column in the constituent table is an FMP snapshot date (the same value for every row), not the historical change date. Removals use the same dateAdded as the corresponding row, because the removed stock was replaced on the day its replacement was added.
Abnormal return = stock return minus SPY return over the same window, measured from T+0 (first available close on or after the event date). This is an analytical framework: T+0 is the reference price, not a trading entry point. A realistic portfolio entry would use T+1 (next-day close), missing the event-day price move.
Academic Background
Andrei Shleifer's 1986 paper "Do Demand Curves for Stocks Slope Down?" documented the first systematic evidence of the inclusion effect. Stocks added to the S&P 500 saw ~3% price increases around inclusion with no fundamental change. Harris and Gurel (1986) confirmed the finding and showed that inclusion-day volume spikes matched the scale of expected index fund rebalancing.
Chen, Noronha, and Singal (2004) extended the analysis to removals and found asymmetry: additions showed more persistent price effects, while removals showed temporary declines that partially recovered. The asymmetry was consistent with the "investor awareness" hypothesis. Additions bring visibility, removals don't remove it.
Our results are broadly consistent with this literature, though the addition effect is now smaller and the removal effect is contaminated by acquisition-and-bankruptcy outliers we'll explain in detail.
What We Found
Additions: a real, consistent effect
Stocks added to the S&P 500 underperform SPY in the days and weeks after inclusion. The effect peaks at T+5 (-0.98%, t=-3.68) and persists at T+21 (-1.06%, t=-2.11), then fades and loses significance by T+63.
The pattern is what you'd expect if front-running is compressing the post-inclusion return. Traders buy anticipated additions before the official effective date, capturing the bulk of the demand shock in advance. By the time index funds complete their buying, much of the upward pressure has already been absorbed. The stock then drifts lower as short-term demand normalizes.
Tesla's December 2020 addition is the clearest example at scale. Index funds needed to buy roughly $80 billion of TSLA stock. In the week before inclusion (Dec 14-18), TSLA rallied +8.6% as traders front-ran the mandatory buying. On the effective date (Dec 21), TSLA dropped -6.5% and underperformed SPY by -6.1%. The bulk of the price move happened before the inclusion, not on it. For average mid-cap additions with less pre-announcement attention, the pattern is similar but smaller in magnitude.
Hit rates: only 44.3% of additions outperform SPY at T+5. The negative drift is consistent but not uniform. Roughly 56% of additions underperform. This is a statistical tendency, not a guarantee.
Removals: the mean vs median story
Removed stocks average +7.22% CAR at T+21 (N=191 with price data). The median is +0.73%. The hit rate is 53.9%, barely above a coin flip.
The gap between mean and median is the finding. Four events account for most of the mean:
- SOV (Santander acquisition, 2009): +591% post-removal. Santander acquired Sovereign Bancorp during the financial crisis at a large premium.
- PCG (PG&E, 2019): +173% after bankruptcy filing. PCG filed Chapter 11 and was removed from the index. Its subsequent recovery is captured in our returns.
- NCR (Atleos spinoff, 2023): +115%. Corporate action inflated the return.
- OI (Owens-Illinois, 2024): +110%.
These aren't "the index removal effect." These are M&A premiums and bankruptcy bounces that happened to coincide with index removal. Strip them out and the remaining 187 events show a much more modest pattern.
The t-statistic for T+21 removals is 1.95, just under the 1.96 threshold for 5% significance. The T+63 removal is significant (t=2.16*), but the median at T+63 is -0.19%. The mean is being pulled by the same handful of events.
The honest summary: the S&P 500 removal recovery effect is real but small in the typical case. The mean (+7.22%) is technically accurate and includes real events that happened in this dataset. The median (+0.73%) is closer to what you'd expect for a stock with no M&A or bankruptcy catalysts.
The Data
S&P 500 Additions (N=465)
| Window | Mean CAR | Median CAR | t-stat | Sig? | Hit Rate |
|---|---|---|---|---|---|
| T+1 | -0.14% | -0.15% | -0.92 | 46.0% | |
| T+5 | -0.98% | -0.61% | -3.68 | ** | 44.3% |
| T+21 | -1.06% | -1.14% | -2.11 | * | 44.2% |
| T+63 | -1.23% | -1.14% | -1.56 | 46.5% |
The addition effect is the cleaner result in this dataset. Mean and median are aligned, the t-statistic is strong at T+5, and the direction is consistent across windows.
S&P 500 Removals (N=186–196)
| Window | Mean CAR | Median CAR | t-stat | Sig? | Hit Rate |
|---|---|---|---|---|---|
| T+1 | +4.20% | -0.07% | 1.10 | 46.9% | |
| T+5 | +3.72% | -0.15% | 0.97 | 48.7% | |
| T+21 | +7.22% | +0.73% | 1.95 | 53.9% | |
| T+63 | +8.60% | -0.19% | 2.16 | * | 48.9% |
The large spread between mean and median at every window signals outlier contamination. At T+63, the mean is +8.60% and the median is -0.19%. Same dataset, opposite directions. The mean is capturing a handful of M&A/bankruptcy events; the median is capturing the typical removed stock.
The Screen
Find recent S&P 500 changes on the Ceta Research data explorer:
SELECT DISTINCT
    symbol AS added_ticker,
    removedTicker AS removed_ticker,
    TRY_STRPTIME(dateAdded, '%B %d, %Y') AS event_date,
    reason
FROM historical_sp500_constituent
WHERE TRY_STRPTIME(dateAdded, '%B %d, %Y') IS NOT NULL
  AND TRY_STRPTIME(dateAdded, '%B %d, %Y') >= CURRENT_DATE - INTERVAL '180' DAY
ORDER BY event_date DESC
Run this screen on Ceta Research →
For removal recovery candidates, add a price join to see how each removed stock is tracking:
WITH removals AS (
    SELECT DISTINCT
        removedTicker AS symbol,
        TRY_STRPTIME(dateAdded, '%B %d, %Y') AS removal_date
    FROM historical_sp500_constituent
    WHERE removedTicker IS NOT NULL
      AND LENGTH(TRIM(removedTicker)) > 0
      AND TRY_STRPTIME(dateAdded, '%B %d, %Y') IS NOT NULL
      AND TRY_STRPTIME(dateAdded, '%B %d, %Y') >= CURRENT_DATE - INTERVAL '90' DAY
),
prices AS (
    SELECT symbol, CAST(date AS DATE) AS trade_date, adjClose
    FROM stock_eod
    WHERE symbol IN (SELECT symbol FROM removals)
      AND CAST(date AS DATE) >= CURRENT_DATE - INTERVAL '90' DAY
),
spy AS (
    SELECT CAST(date AS DATE) AS trade_date, adjClose AS spy_close
    FROM stock_eod
    WHERE symbol = 'SPY'
      AND CAST(date AS DATE) >= CURRENT_DATE - INTERVAL '90' DAY
)
SELECT
    r.symbol,
    r.removal_date,
    p0.adjClose AS entry_price,
    p_now.adjClose AS current_price,
    ROUND((p_now.adjClose - p0.adjClose) / p0.adjClose * 100, 2) AS stock_return_pct,
    ROUND((s_now.spy_close - s0.spy_close) / s0.spy_close * 100, 2) AS spy_return_pct,
    ROUND(
        (p_now.adjClose - p0.adjClose) / p0.adjClose * 100
        - (s_now.spy_close - s0.spy_close) / s0.spy_close * 100, 2
    ) AS car_pct
FROM removals r
JOIN prices p0 ON p0.symbol = r.symbol AND p0.trade_date = (
    SELECT MIN(trade_date) FROM prices WHERE symbol = r.symbol AND trade_date >= r.removal_date
)
JOIN prices p_now ON p_now.symbol = r.symbol AND p_now.trade_date = (
    SELECT MAX(trade_date) FROM prices WHERE symbol = r.symbol
)
JOIN spy s0 ON s0.trade_date = p0.trade_date
JOIN spy s_now ON s_now.trade_date = p_now.trade_date
ORDER BY r.removal_date DESC
Run this query on Ceta Research →
Limitations
Missing price data for removals. Of 574 historical removal events, only 214 had price data available (37%). Stocks that were delisted, acquired, or went bankrupt often have no post-removal prices. The surviving sample over-represents acquisitions and companies that continued trading, which is part of why the mean is inflated.
Outlier contamination in removals. Four events with CAR >100% dominate the mean. These are real returns from the data, but they're driven by M&A premiums and bankruptcy recoveries, not index reconstitution mechanics. For a typical removed stock, the expected outcome is closer to the median (+0.73%).
Front-running compression. The addition effect was likely larger in the early 2000s. As more traders anticipated index changes, the price impact moved earlier: from the effective date to the announcement date, and sometimes earlier still for predictable additions. Our T+0 start date likely misses some of the early-period effect.
Event study, not a portfolio strategy. This measures cumulative abnormal returns around specific events. It's not a monthly rebalancing strategy with CAGR and Sharpe ratio. Constructing a tradable portfolio from removal events faces: sparse monthly events (average 1.6 removals/month in S&P 500), low hit rates (53.9%), and the M&A/bankruptcy contamination described above.
Dow Jones and international indices excluded. The Dow Jones has roughly 1.5 additions per year, too few for statistical analysis. FMP doesn't have constituent history for FTSE 100, DAX, Nikkei, or other international indices.
Takeaway
The S&P 500 addition drift is a real, statistically robust phenomenon: -0.98% vs SPY in the first five trading days (t=-3.68). 25 years, 465 events, mean and median aligned. Additions get bought ahead of the effective date and drift lower as that pressure normalizes.
The removal recovery is real in the mean but weak in the typical case. The +7.22% T+21 average exists because some removed stocks get acquired or bounce from bankruptcy. Strip those out and the median is +0.73%. The t-statistic for T+21 is 1.95, just under significance.
If you want the cleaner removal signal, the NASDAQ-100 is where it is. NDX removals average +5.13% at T+21 (t=3.29**), median +2.61%, hit rate 63.2%, without the M&A contamination that distorts the S&P 500 numbers. We cover that in the companion post.
For the NASDAQ-100 analysis, see: NASDAQ-100 Index Reconstitution: The Cleaner Removal Signal
References
- Shleifer, A. (1986). "Do Demand Curves for Stocks Slope Down?" Journal of Finance, 41(3), 579-590.
- Harris, L. & Gurel, E. (1986). "Price and Volume Effects Associated with Changes in the S&P 500 List: New Evidence for the Existence of Price Pressures." Journal of Finance, 41(4), 815-829.
- Chen, H., Noronha, G., & Singal, V. (2004). "The Price Response to S&P 500 Index Additions and Deletions: Evidence of Asymmetry and a New Explanation." Journal of Finance, 59(4), 1901-1930.
Data: Ceta Research (FMP financial data warehouse). Event study: historical_sp500_constituent + stock_eod, 2000–2025. Abnormal returns vs SPY. Removal price coverage: 214 of 574 events (63% missing: delisted, acquired, or bankrupt stocks). This is educational content, not investment advice.