
S&P 500 Additions: 25 Years of Index Effect Data
We measured the price impact of 537 S&P 500 additions from 2000 to 2025. Additions underperform the market by 0.86% at T+5 (t = -3.63). The classic academic finding has reversed.

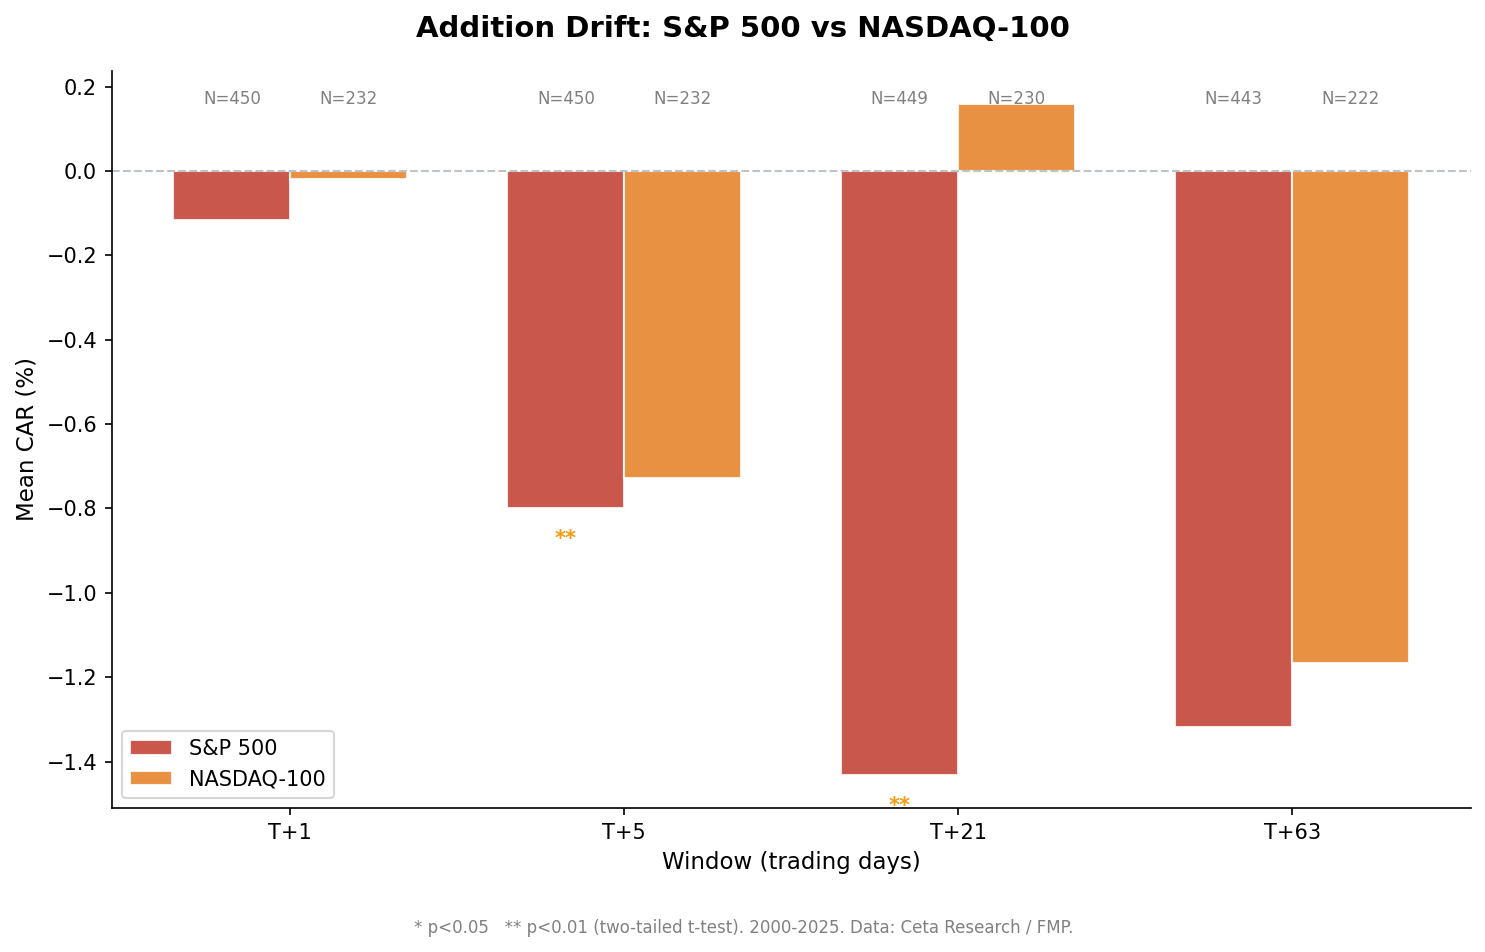
We measured the price impact of 450 S&P 500 additions from 2000 to 2025. Additions underperform the market after joining the index. At T+5, the mean abnormal return is -0.80% with a t-statistic of -3.38, significant at the 1% level. At T+21, the underperformance deepens to -1.43% (t = -3.09), also significant at the 1% level. The classic "index inclusion effect" from the 1980s has reversed.
Contents
- Method
- The Screens
- Simple Screen: Recent Additions
- Advanced Screen: Additions with Volume Confirmation
- Results
- Decade Breakdown
- Why the Effect Reversed
- Notable Examples
- Can You Trade This?
- Limitations
- Run It Yourself
- Recent Additions Screen
- Full Event Study
- Takeaway
- References
Data: FMP financial data warehouse, 2000–2025. Updated April 2026.
Method
Events: 450 S&P 500 additions from January 2000 to December 2025 with complete price data, extracted from FMP's historical_sp500_constituent table. Each event is a unique (symbol, dateAdded) pair.
Measurement windows: - T+1: One trading day after effective date - T+5: One trading week after - T+21: One trading month after - T+63: One trading quarter after
Abnormal return: Stock return minus SPY return over the same window. This isolates the stock-specific effect from broad market moves.
Statistics: Mean and median cumulative abnormal return (CAR), two-sided t-test for significance, and hit rate (percentage of events where the addition outperformed SPY).
Trading day alignment: We build a calendar from SPY trading days and map T+N offsets to actual dates. This avoids weekends and holidays.
The Screens
Simple Screen: Recent Additions
Pull every stock added to the S&P 500 in the last 12 months.
SELECT
    symbol,
    TRY_STRPTIME(dateAdded, '%B %d, %Y') AS add_date
FROM historical_sp500_constituent
WHERE TRY_STRPTIME(dateAdded, '%B %d, %Y') >= CURRENT_DATE - INTERVAL '365' DAY
  AND TRY_STRPTIME(dateAdded, '%B %d, %Y') IS NOT NULL
ORDER BY add_date DESC
LIMIT 30
Try this screen on Ceta Research →
This returns the 30 most recent additions with their effective dates. Useful for tracking index turnover, but not a trading signal on its own.
Advanced Screen: Additions with Volume Confirmation
Index fund buying creates volume spikes. This screen filters for additions where inclusion-day volume exceeded twice the 20-day average, confirming real forced buying took place.
WITH additions AS (
    SELECT DISTINCT symbol, TRY_STRPTIME(dateAdded, '%B %d, %Y') AS add_date
    FROM historical_sp500_constituent
    WHERE TRY_STRPTIME(dateAdded, '%B %d, %Y') >= '2020-01-01'
      AND TRY_STRPTIME(dateAdded, '%B %d, %Y') IS NOT NULL
),
volume_on_day AS (
    SELECT a.symbol, a.add_date, p.volume AS inclusion_volume
    FROM additions a
    JOIN stock_eod p ON a.symbol = p.symbol AND CAST(p.date AS DATE) = a.add_date
),
volume_prior AS (
    SELECT a.symbol, a.add_date, AVG(p.volume) AS avg_volume_20d
    FROM additions a
    JOIN stock_eod p ON a.symbol = p.symbol
        AND CAST(p.date AS DATE) BETWEEN a.add_date - INTERVAL '30' DAY AND a.add_date - INTERVAL '1' DAY
    GROUP BY a.symbol, a.add_date
)
SELECT v.symbol, v.add_date,
    ROUND(v.inclusion_volume * 1.0 / NULLIF(p.avg_volume_20d, 0), 1) AS volume_ratio
FROM volume_on_day v
JOIN volume_prior p ON v.symbol = p.symbol AND v.add_date = p.add_date
WHERE v.inclusion_volume > p.avg_volume_20d * 2
ORDER BY volume_ratio DESC
LIMIT 30
A volume ratio above 2x confirms that index funds were actively buying. Higher ratios mean more concentrated forced demand.
Results
Additions underperform after the effective date. This holds across every measurement window. The T+5 result is statistically significant at the 1% level.
| Window | Mean CAR (%) | Median CAR (%) | t-stat | Hit Rate | Significant? |
|---|---|---|---|---|---|
| T+1 | -0.12 | -0.14 | -0.73 | 46.4% | No |
| T+5 | -0.80 | -0.56 | -3.38 | 44.4% | Yes (1%) |
| T+21 | -1.43 | -1.23 | -3.09 | 43.9% | Yes (1%) |
| T+63 | -1.32 | -1.38 | -1.65 | 46.3% | No |
450 events. CAR = cumulative abnormal return (stock return minus SPY return).
The sign is negative at every horizon. Hit rates stay below 50% throughout, meaning fewer than half of additions beat the market. Both the T+5 and T+21 results are significant at the 1% level, with t-statistics of -3.38 and -3.09 respectively.
The median tells a cleaner story than the mean. At T+5, the median CAR is -0.56% vs the mean of -0.80%. At T+21, the median is -1.23% vs the mean of -1.43%. Even the typical addition underperforms, not just the worst cases.
Decade Breakdown
The effect is consistent across time periods. No decade shows positive post-addition returns.
| Decade | Events | T+1 CAR | T+5 CAR | T+21 CAR | T+63 CAR |
|---|---|---|---|---|---|
| 2000s | 149 | -0.12% | -1.04%* | -2.10%* | -1.46% |
| 2010s | 178 | -0.17% | -0.49% | -0.29% | -0.63% |
| 2020s | 111 | -0.07% | -0.94% | -1.82% | -1.73% |
* = significant at 5%
The 2000s show the worst sustained underperformance: -1.04% at T+5 (significant at 5%) and -2.10% at T+21 (also significant at 5%). The 2010s were the mildest decade, with no window reaching significance. The 2020s sit in between, with consistent negative returns at every horizon but not reaching significance individually.
The effect persists across all decades. No decade shows the positive addition returns that Shleifer documented in 1986.
Why the Effect Reversed
The classic academic finding was positive. Shleifer (1986) documented a ~3% abnormal return for additions. Harris and Gurel (1986) found similar results. So what changed?
Pre-addition run-up. The S&P committee tends to add stocks that have already performed well. By the time inclusion is official, the stock has often rallied 10-20% over the prior months. The effective date marks the end of the run-up, not the beginning.
Front-running. Once S&P announces an addition (typically 5-7 business days before the effective date), hedge funds and prop desks buy ahead of index funds. This pulls the price impact forward. By T+0, the forced buying is already reflected in the price.
Improved execution. Index funds in the 1980s had to buy everything on the close of the effective date. Modern funds spread their purchases across multiple days and use algorithmic execution. Less concentrated buying means less price impact on any single day.
The net result: whatever pop used to exist on the effective date has been arbitraged away. What remains is the hangover from the pre-addition rally.
Notable Examples
Tesla (December 21, 2020). The largest S&P 500 addition in history. Tesla's market cap was roughly $660 billion at inclusion, forcing index funds to buy approximately $80 billion worth of shares. The stock had already rallied over 700% that year. At T+5, Tesla showed a positive abnormal return, but it was an extreme outlier driven by meme dynamics and short squeezes. Most additions look nothing like this.
Meta (June 2023 re-addition). Meta was removed from the index during its 2022 decline. When it was re-added in 2023, the stock was already in recovery mode. The re-addition confirmed what the market already knew. Events like this dilute the "forced buying" narrative because the stock was rising on fundamentals, not index demand.
These outliers highlight why the median matters more than the mean. Tesla's anomalous return pulls the mean in one direction. The median of -0.45% at T+5 reflects what actually happens to a typical addition.
Can You Trade This?
Buying S&P 500 additions after the effective date is a losing strategy. The data is clear on this.
The mean abnormal return is negative at every horizon. The hit rate never exceeds 47.2%. And the most statistically significant result (T+5, t = -3.63) points firmly in the wrong direction for buyers.
Shorting additions looks slightly more promising on paper, but the t-statistic at T+63 is only -1.65, which isn't significant. Variance is high. You'd need significant capital and a long time horizon to capture a -1.32% mean return, with plenty of individual events going against you.
The real opportunity, if one exists, is in the announcement-to-effective window. Our data starts at the effective date. The 5-7 day window between announcement and inclusion is where the original academic effect likely still lives, compressed and front-run but possibly not fully arbitraged. We don't test that here because announcement dates aren't in our dataset.
Limitations
Announcement vs. effective date. We measure from the effective date (when the stock officially enters the index). The announcement date is typically 5-7 business days earlier. Some or all of the positive price impact may occur in that window, before our T+0.
No transaction costs. We report gross abnormal returns. Real trading costs (bid-ask spread, market impact, commissions) would make the negative returns even worse for a buyer and would eat into any short-side returns.
SPY as benchmark. We benchmark against SPY (the SPDR S&P 500 ETF) rather than the exact S&P 500 total return index. The tracking error is small but nonzero.
Date parsing. The dateAdded field is stored as text in natural language format ("January 15, 2020"). We parse with TRY_STRPTIME. A small number of records with non-standard formatting fail to parse and are excluded.
Survivorship in the constituent list. The historical_sp500_constituent table may not capture every historical addition. Some short-lived members could be missing from the data, which would bias results toward larger, more liquid additions.
Run It Yourself
Run the simple screen on Ceta Research →
Recent Additions Screen
SELECT
    symbol,
    TRY_STRPTIME(dateAdded, '%B %d, %Y') AS add_date
FROM historical_sp500_constituent
WHERE TRY_STRPTIME(dateAdded, '%B %d, %Y') >= CURRENT_DATE - INTERVAL '365' DAY
  AND TRY_STRPTIME(dateAdded, '%B %d, %Y') IS NOT NULL
ORDER BY add_date DESC
LIMIT 30
Full Event Study
The event study SQL and Python harness are in the repository. The backtest computes abnormal returns at T+1, T+5, T+21, and T+63 for each addition, then aggregates across all events with t-tests and hit rates.
Takeaway
S&P 500 additions don't pop anymore. They underperform. Across 450 events from 2000 to 2025, the mean abnormal return at T+5 is -0.80% (t = -3.38). At T+21, it deepens to -1.43% (t = -3.09). Both results are significant at the 1% level. The hit rate never breaks 50%.
The original finding from Shleifer (1986) and Harris and Gurel (1986) was real in its time. Demand curves for stocks did slope down when index tracking was small and execution was clumsy. But $7 trillion in passive assets, algorithmic execution, and a generation of front-runners have flipped the sign. The forced buying gets priced in before the effective date. What's left is mean reversion.
Don't buy additions on the effective date. The edge is gone.
Data: Ceta Research (FMP financial data warehouse), 2000-2025. Universe: 450 S&P 500 addition events with complete price data. Benchmark: SPY. Past performance does not guarantee future results. This is educational content, not investment advice.
References
- Shleifer, A. (1986). "Do Demand Curves for Stocks Slope Down?" Journal of Finance, 41(3), 579-590.
- Harris, L. & Gurel, E. (1986). "Price and Volume Effects Associated with Changes in the S&P 500 List." Journal of Finance, 41(4), 815-829.
- Lynch, A. & Mendenhall, R. (1997). "New Evidence on Stock Price Effects Associated with Changes in the S&P 500 Index." Journal of Business, 70(3), 351-383.
- Chen, H., Noronha, G. & Singal, V. (2004). "The Price Response to S&P 500 Index Additions and Deletions: Evidence of Asymmetry and a New Explanation." Journal of Finance, 59(4), 1901-1929.


