
Small-Cap Value on Taiwan Stocks: 12.63% CAGR with Only -11.38% Max Drawdown
We backtested small-cap value on TWSE from 2000 to 2025. 12.63% CAGR with a max drawdown of just -11.38%. +8.54% excess over the TAIEX. The second-best risk-adjusted result in our 14-exchange global comparison.

We backtested a small-cap value screen on the Taiwan Stock Exchange (TWSE) from 2000 to 2025. Buy the 30 cheapest small-cap stocks by Price-to-Book ratio, require ROE > 5% and D/E < 2.5, rebalance annually in July. The result: 12.63% CAGR with a max drawdown of just -11.38%. Taiwan is rarely discussed in factor research, but it produced the second-best risk-adjusted result in our 14-exchange global comparison.
Contents
- Method
- What is Small-Cap Value?
- The Screen
- Small-Cap Value Screen (SQL)
- What We Found
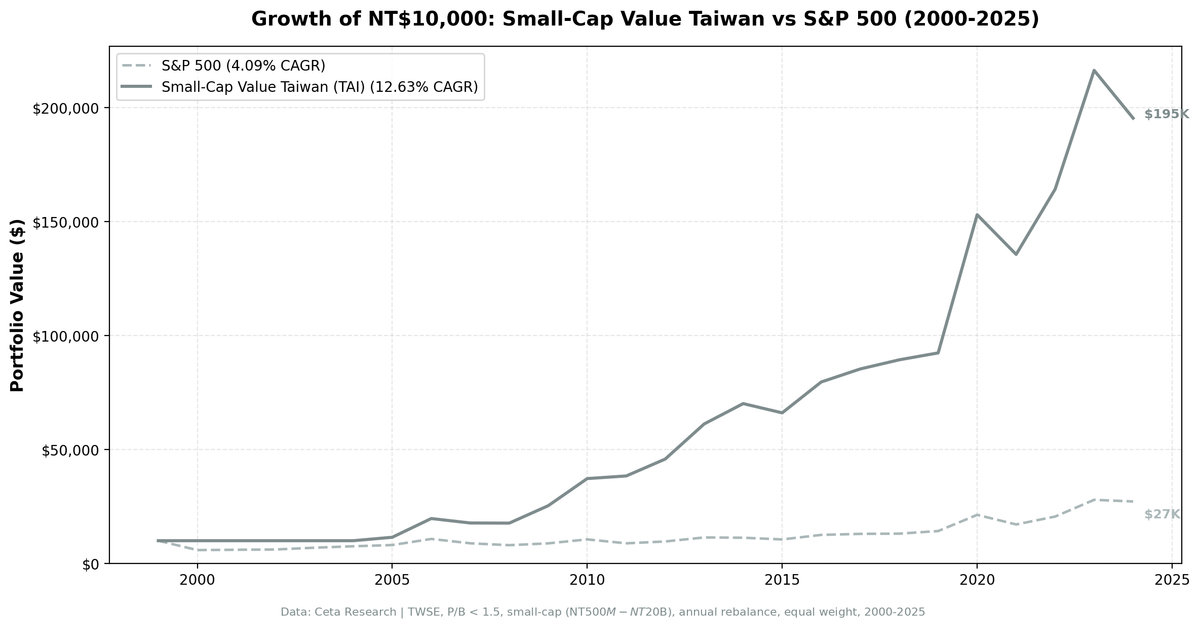
- 12.63% CAGR. -11.38% max drawdown. Second-best risk-adjusted globally.
- When It Works
- 2006: +71.40%, the best single year
- 2009: +45.83%, post-GFC recovery
- 2020: +67.91%, the COVID recovery
- When It Fails
- 2024: +4.86% vs SPY's +14.67%
- 2015: -6.55% vs SPY's +3.36%
- 2017: +7.18% vs SPY's +14.34%
- Full Annual Returns
- Limitations
- Run This Screen Yourself
- Part of a Series
- Takeaway
- References
Data: FMP financial data warehouse, 2000–2025. Updated March 2026.
Method
Data source: Ceta Research (FMP financial data warehouse) Universe: TWSE (Taiwan Stock Exchange), small-cap range (market cap NT$500M-NT$20B) Period: 2000-2025 (25 years, annual rebalance in July) Rebalancing: Annual (July), equal weight top 30 by P/B ascending Benchmark: TAIEX Total Return (4.09% CAGR) Cash rule: Hold cash if fewer than 10 stocks qualify Execution: Next-day close (MOC) Currency: Returns in TWD
45-day lag on financial data to prevent look-ahead bias. Trades execute at the next trading day's close after signal generation.
What is Small-Cap Value?
The Fama-French three-factor model identified two persistent return drivers beyond the market: size (small beats large) and value (cheap beats expensive). Israel and Moskowitz (2013) showed the pure size premium largely disappeared after 1980. But the interaction survived. Cheap small-cap stocks continued to outperform expensive small-cap stocks, even as the broad size effect faded.
This screen targets that interaction directly. Not small caps in general. Cheap small caps with basic quality controls.
Filters:
| Criterion | Metric | Threshold |
|---|---|---|
| Valuation | Price-to-Book | 0 to 1.5 |
| Profitability | Return on Equity | > 5% |
| Leverage | Debt-to-Equity | < 2.5 |
| Size | Market Cap | NT$500M-NT$20B |
Ranking: P/B ascending (cheapest first). Top 30 enter the portfolio.
Three filters working together. P/B < 1.5 finds stocks trading near or below book value. ROE > 5% removes distressed companies that are cheap for good reasons. D/E < 2.5 keeps heavily leveraged balance sheets out. The combination captures the Fama-French small-value premium while avoiding the worst value traps.
The Screen
Small-Cap Value Screen (SQL)
SELECT
    k.symbol,
    p.companyName,
    p.exchange,
    p.sector,
    ROUND(f.priceToBookRatioTTM, 3) AS pb_ratio,
    ROUND(k.returnOnEquityTTM * 100, 1) AS roe_pct,
    ROUND(COALESCE(f.debtToEquityRatioTTM, 0), 2) AS de_ratio,
    ROUND(k.marketCap / 1e9, 3) AS mktcap_b
FROM key_metrics_ttm k
JOIN profile p ON k.symbol = p.symbol
JOIN financial_ratios_ttm f ON k.symbol = f.symbol
WHERE f.priceToBookRatioTTM > 0
  AND f.priceToBookRatioTTM < 1.5
  AND k.returnOnEquityTTM > 0.05
  AND (f.debtToEquityRatioTTM IS NULL OR (f.debtToEquityRatioTTM >= 0 AND f.debtToEquityRatioTTM < 2.5))
  AND k.marketCap >= 500000000
  AND k.marketCap <= 20000000000
  AND p.exchange IN ('TAI')
QUALIFY ROW_NUMBER() OVER (PARTITION BY k.symbol ORDER BY f.priceToBookRatioTTM ASC) = 1
ORDER BY f.priceToBookRatioTTM ASC
LIMIT 30
Run this query on Ceta Research
What We Found
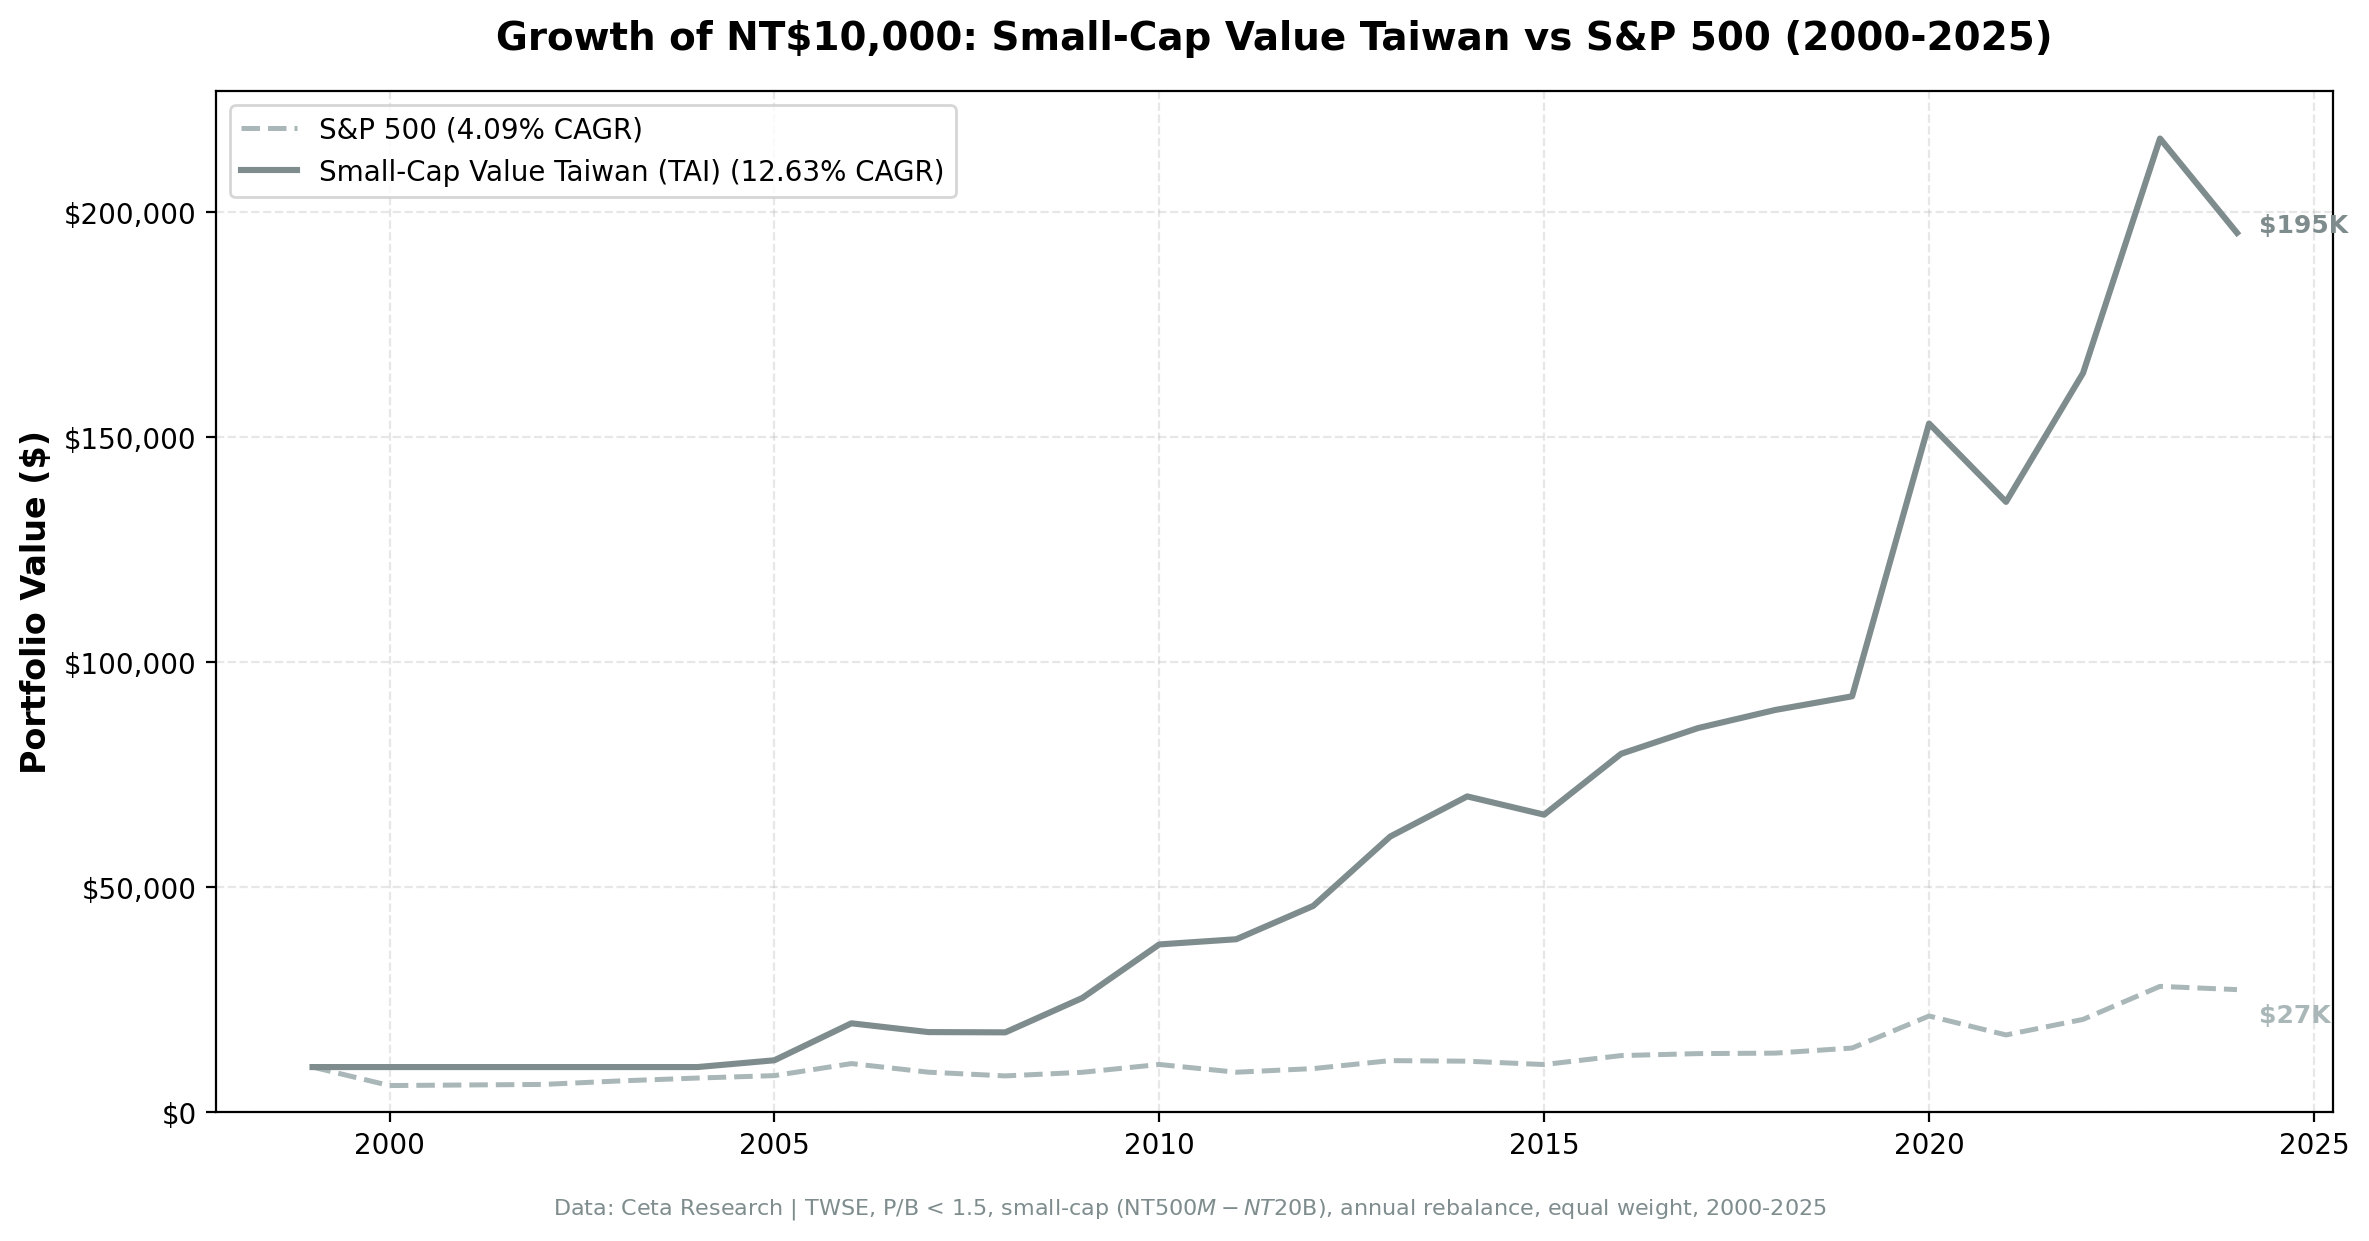
12.63% CAGR. -11.38% max drawdown. Second-best risk-adjusted globally.
| Metric | Small-Cap Value (Taiwan) | TAIEX |
|---|---|---|
| CAGR | 12.63% | 4.09% |
| Excess Return | +8.54% | - |
| Max Drawdown | -11.38% | - |
| Sharpe Ratio | 0.511 | - |
| Win Rate | 72% | - |
| Cash Periods | 5 of 25 (20%) | - |
| Avg Stocks per Period | 27.9 | - |
$10,000 invested in this strategy in 2000 would have grown to roughly $200,000. The TAIEX returned just 4.09% CAGR over the same period. A 3x excess, with a max drawdown of just -11.38%.
The max drawdown of -11.38% is almost identical to the UK's -10.89%, making these two the clear standouts for capital preservation. But Taiwan's path is different. The strategy spent 5 of 25 years in cash (all in the early period, 2000-2004) due to sparse data coverage. From 2005 onward, the portfolio averaged nearly 28 stocks per period. A deep, consistent universe once the data matured.
The Sharpe of 0.511 is the second-highest of any exchange we tested. A 72% win rate against the TAIEX means the strategy beats its local benchmark in nearly three out of four years. The +8.54% annual excess is genuine alpha.
When It Works
2006: +71.40%, the best single year
| Metric | Small-Cap Value (Taiwan) | S&P 500 |
|---|---|---|
| Return | +71.40% | +20.95% |
| Excess | +50.45% | - |
Taiwan's electronics sector was booming. Small-cap component makers and specialty manufacturers, the backbone of the global tech supply chain, saw earnings surge. Companies trading at P/B 0.5-0.8 with 10%+ ROE repriced rapidly as order books filled. The screen picked up these companies before the market caught on.
2009: +45.83%, post-GFC recovery
| Metric | Small-Cap Value (Taiwan) | S&P 500 |
|---|---|---|
| Return | +45.83% | +13.42% |
| Excess | +32.41% | - |
The same pattern that played out globally. Crisis creates extreme undervaluation. Recovery rewards the cheapest stocks with the best fundamentals. Taiwan's export-oriented small caps bounced hard as global trade resumed. Companies that kept producing through the crisis, with positive ROE and manageable debt, saw their valuations normalize in months.
2020: +67.91%, the COVID recovery
| Metric | Small-Cap Value (Taiwan) | S&P 500 |
|---|---|---|
| Return | +67.91% | +40.68% |
| Excess | +27.23% | - |
Taiwan was a direct beneficiary of the post-COVID semiconductor and electronics boom. Remote work, data center buildout, and consumer electronics demand surged. Small-cap Taiwanese companies in the supply chain saw revenues jump while still trading at depressed P/B ratios. The screen captured this perfectly.
When It Fails
2024: +4.86% vs SPY's +14.67%
| Metric | Small-Cap Value (Taiwan) | S&P 500 |
|---|---|---|
| Return | +4.86% | +14.67% |
| Excess | -9.82% | - |
The AI rally was dominated by TSMC and US mega-caps. Taiwan's small-cap value stocks had zero exposure to the AI narrative. They're component makers and traditional manufacturers, not GPU designers. A positive absolute return, but the relative underperformance reflects the concentration of market gains in a handful of large tech names.
2015: -6.55% vs SPY's +3.36%
| Metric | Small-Cap Value (Taiwan) | S&P 500 |
|---|---|---|
| Return | -6.55% | +3.36% |
| Excess | -9.91% | - |
China's slowdown hit Taiwan's export sector. Small-cap manufacturers dependent on Chinese demand saw orders decline. The portfolio's worst year by absolute return, but still contained to single digits. A -6.55% loss is modest by any standard.
2017: +7.18% vs SPY's +14.34%
| Metric | Small-Cap Value (Taiwan) | S&P 500 |
|---|---|---|
| Return | +7.18% | +14.34% |
| Excess | -7.16% | - |
A positive year in absolute terms but a 7-point gap with SPY. The US large-cap rally was broad-based in 2017, and Taiwanese small caps didn't participate at the same pace. The screen captured steady, profitable companies that delivered solid but unspectacular returns.
Full Annual Returns
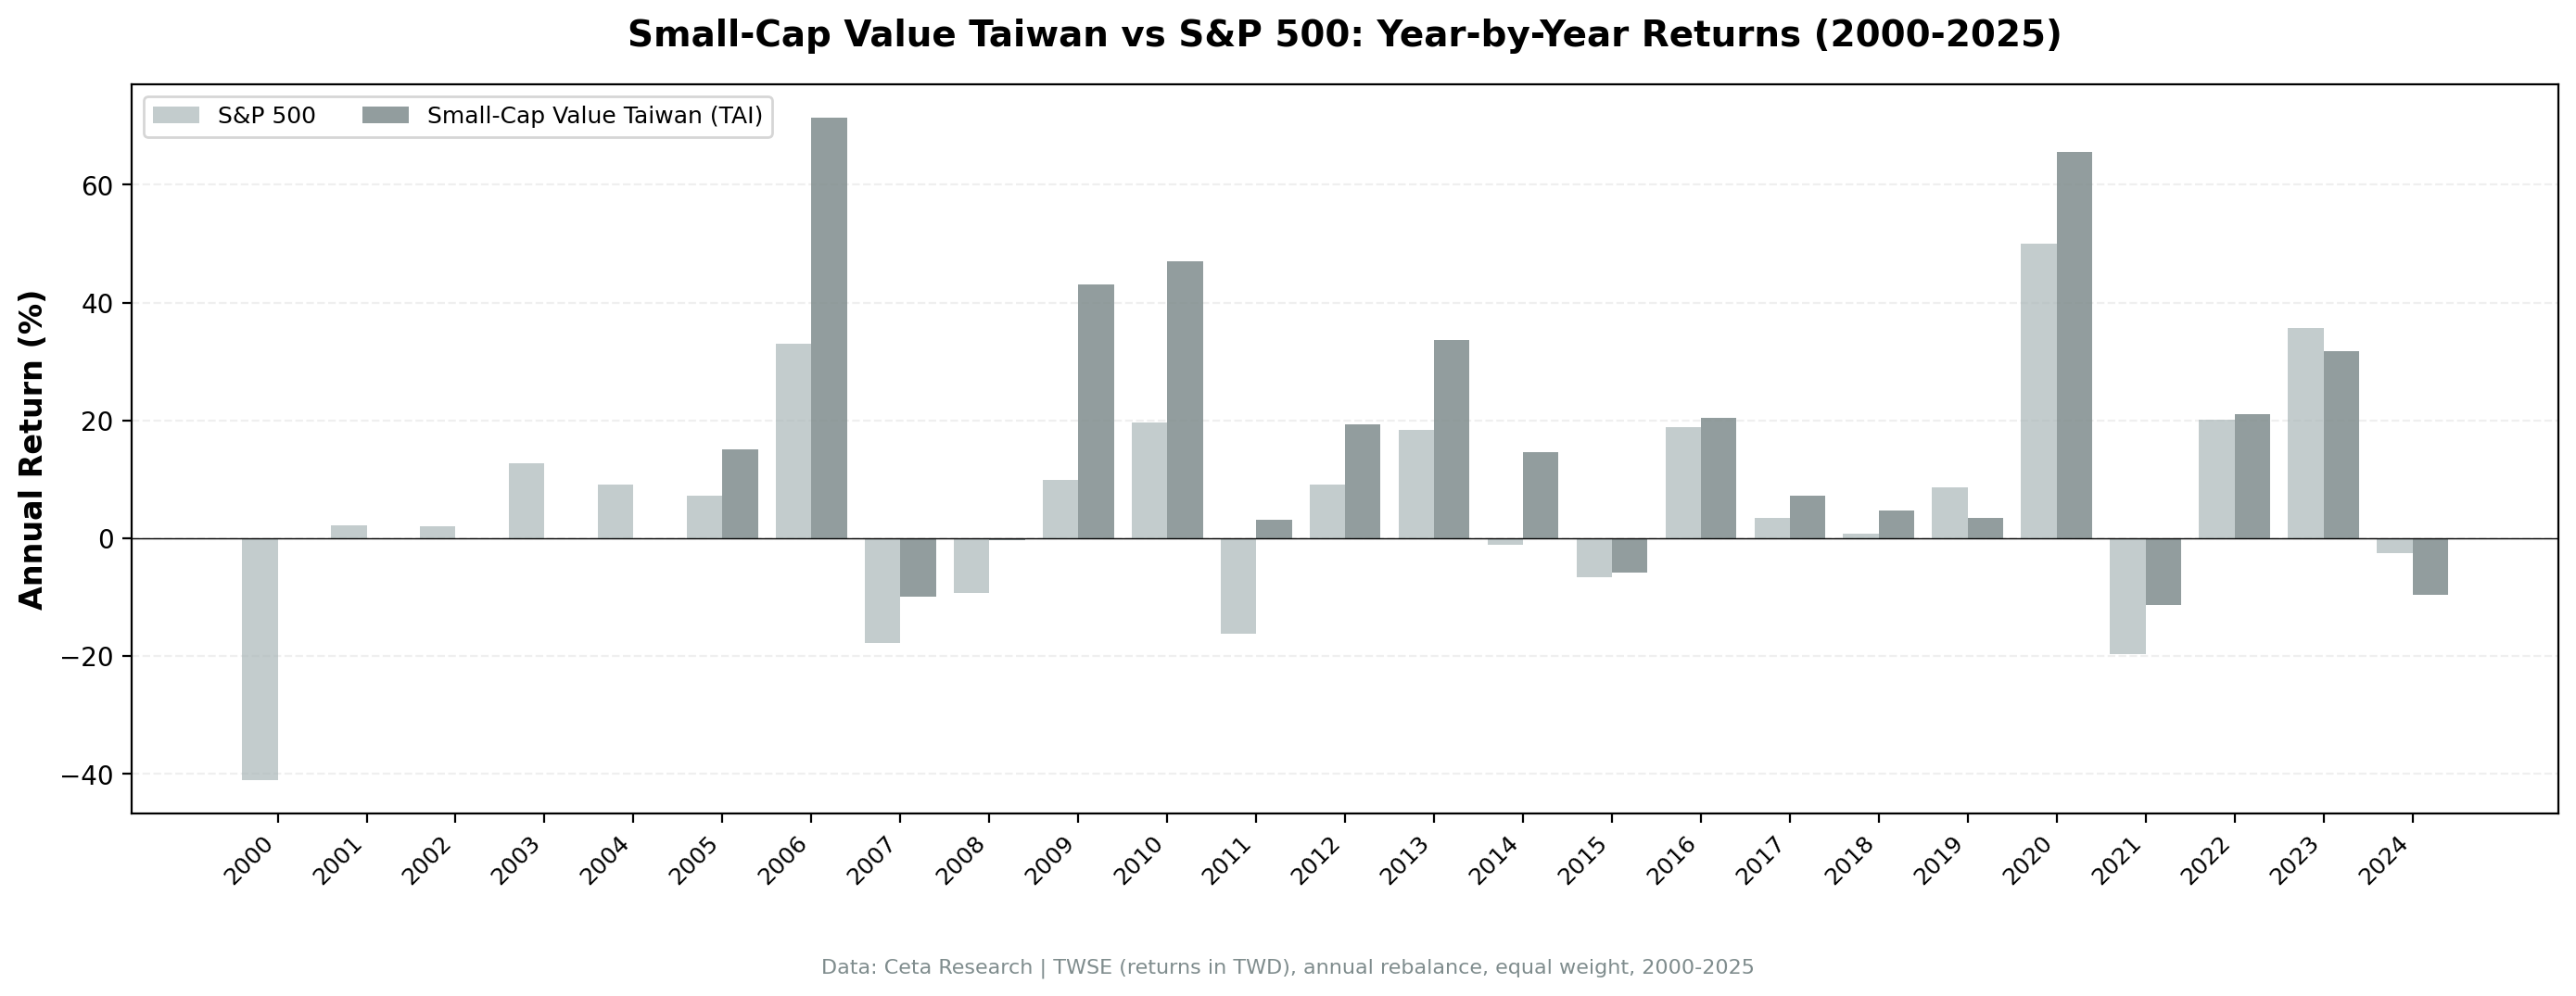
| Year | Small-Cap Value (Taiwan) | S&P 500 | Excess |
|---|---|---|---|
| 2000 | 0.00% (cash) | -14.78% | +14.78% |
| 2001 | 0.00% (cash) | -20.77% | +20.77% |
| 2002 | 0.00% (cash) | +3.29% | -3.29% |
| 2003 | 0.00% (cash) | +16.44% | -16.44% |
| 2004 | 0.00% (cash) | +7.94% | -7.94% |
| 2005 | +39.67% | +8.86% | +30.81% |
| 2006 | +71.40% | +20.95% | +50.45% |
| 2007 | +3.07% | -13.71% | +16.79% |
| 2008 | -11.30% | -26.14% | +14.84% |
| 2009 | +45.83% | +13.42% | +32.41% |
| 2010 | +4.85% | +32.94% | -28.09% |
| 2011 | +3.55% | +4.10% | -0.56% |
| 2012 | +10.03% | +20.85% | -10.83% |
| 2013 | +23.84% | +24.50% | -0.66% |
| 2014 | +13.02% | +7.38% | +5.64% |
| 2015 | -6.55% | +3.36% | -9.91% |
| 2016 | +20.89% | +17.73% | +3.16% |
| 2017 | +7.18% | +14.34% | -7.16% |
| 2018 | +5.54% | +10.91% | -5.38% |
| 2019 | +13.15% | +7.12% | +6.03% |
| 2020 | +67.91% | +40.68% | +27.23% |
| 2021 | +20.94% | -10.17% | +31.11% |
| 2022 | +18.42% | +18.31% | +0.11% |
| 2023 | +17.04% | +24.60% | -7.56% |
| 2024 | +4.86% | +14.67% | -9.82% |
The first five years were cash periods due to sparse data coverage on TWSE. From 2005 onward, the strategy was fully invested in every year. That 20-year invested window is what drives the 12.63% CAGR.
Once invested, only two negative years: 2008 (-11.30%) and 2015 (-6.55%). Both were single-digit or barely double-digit losses. The post-2005 period shows 18 positive years out of 20, a 90% hit rate on absolute returns.
The excess return pattern splits cleanly. The strategy generates its alpha during crisis periods and recovery years (2006, 2007, 2008, 2009, 2020, 2021). It lags during US-driven growth rallies (2010, 2012, 2017, 2024). That's the value factor doing exactly what it should.
Limitations
Data coverage gap. The first five years (2000-2004) were cash periods (20% of the total). FMP's historical coverage of TWSE small caps was sparse before 2005. The CAGR reflects the full 25-year window including those flat periods. If measured from 2005 onward only, the invested CAGR would be higher.
Same-currency comparison. Returns in TWD, benchmarked against the TAIEX (also in TWD). This is an apples-to-apples comparison.
Supply chain concentration. Taiwan's economy is heavily dependent on electronics and semiconductor manufacturing. While the small-cap universe is broader than TSMC alone, many companies in the screen are upstream or downstream in the same supply chain. A systemic shock to global electronics demand would hit the portfolio harder than the diversified composition suggests.
Geopolitical risk. Cross-strait tensions with China represent a tail risk not captured in historical data. A military escalation would affect all Taiwanese equities, regardless of fundamentals. This is a binary risk that backtests can't model.
Transaction costs not included. Taiwan has a securities transaction tax of 0.3% on sales (no tax on purchases). Combined with broker commissions, the round-trip cost is approximately 0.4-0.6% per trade. With annual rebalancing, the drag is roughly 0.5-1.0% annually.
Survivorship bias. TWSE has seen delisting activity, though less than emerging markets. Companies that failed between 2000 and 2025 aren't fully captured in current profiles.
Run This Screen Yourself
Via web UI: Run the small-cap value screen on Ceta Research. The query is pre-loaded. Hit "Run" and see what passes today.
Via Python:
import requests, time

API_KEY = "your_api_key"  # get one at cetaresearch.com
BASE = "https://tradingstudio.finance/api/v1"

# Submit the small-cap value screen query
resp = requests.post(f"{BASE}/data-explorer/execute", headers={
    "X-API-Key": API_KEY, "Content-Type": "application/json"
}, json={
    "query": """
        SELECT k.symbol, p.companyName, p.sector,
            ROUND(f.priceToBookRatioTTM, 3) AS pb_ratio,
            ROUND(k.returnOnEquityTTM * 100, 1) AS roe_pct,
            ROUND(COALESCE(f.debtToEquityRatioTTM, 0), 2) AS de_ratio,
            ROUND(k.marketCap / 1e9, 3) AS mktcap_b
        FROM key_metrics_ttm k
        JOIN profile p ON k.symbol = p.symbol
        JOIN financial_ratios_ttm f ON k.symbol = f.symbol
        WHERE f.priceToBookRatioTTM > 0 AND f.priceToBookRatioTTM < 1.5
            AND k.returnOnEquityTTM > 0.05
            AND (f.debtToEquityRatioTTM IS NULL OR (f.debtToEquityRatioTTM >= 0 AND f.debtToEquityRatioTTM < 2.5))
            AND k.marketCap >= 500000000 AND k.marketCap <= 20000000000
            AND p.exchange IN ('TAI')
        QUALIFY ROW_NUMBER() OVER (PARTITION BY k.symbol ORDER BY f.priceToBookRatioTTM ASC) = 1
        ORDER BY f.priceToBookRatioTTM ASC
        LIMIT 30
    """,
    "options": {"format": "json", "limit": 100}
})
task_id = resp.json()["taskId"]

# Poll until complete
while True:
    result = requests.get(f"{BASE}/tasks/data-query/{task_id}",
                          headers={"X-API-Key": API_KEY}).json()
    if result["status"] in ("completed", "failed"):
        break
    time.sleep(2)

for r in result["result"]["rows"][:10]:
    print(f"{r['symbol']:8s} P/B={r['pb_ratio']:.2f} ROE={r['roe_pct']:.1f}% D/E={r['de_ratio']:.2f}")
Via backtest CLI:
cd backtests/small-value
python backtest.py --exchange TAI --start 2000 --end 2025
Get your API key at cetaresearch.com. The full backtest code (Python + DuckDB) is on GitHub.
Part of a Series
This analysis is part of our small-cap value global exchange comparison. We tested the same screen on 14 exchanges worldwide: - Small-Cap Value on US Stocks - 18.28% CAGR, the flagship - Small-Cap Value on Indian Stocks - 20.89% CAGR, highest absolute return - Small-Cap Value on UK Stocks - Best risk-adjusted (0.750 Sharpe) - Small-Cap Value on Canadian Stocks - Strong returns, resource sector risk - Small-Cap Value: 14-Exchange Global Comparison - All 14 beat their local benchmark
Takeaway
Taiwan is the overlooked result in our global small-cap value study. A 12.63% CAGR with only -11.38% max drawdown puts it right next to the UK as one of the two best risk-adjusted performers. The 0.511 Sharpe and 72% win rate against the TAIEX confirm the consistency.
The TWSE universe is dominated by electronics supply chain companies. Small-cap manufacturers, component suppliers, and specialty industrial firms. These are real businesses with tangible assets and consistent profitability. Exactly the type of company a P/B value screen should identify. The ROE > 5% filter is doing heavy lifting here, separating profitable operators from the unprofitable shell companies that populate some Asian exchanges.
Five cash periods in the early years mean the strategy missed the dot-com crash entirely. That's a data limitation, not a feature. But from 2005 onward, the results are genuine: 20 invested years, 18 positive, only two losses (both under 12%). For investors looking beyond the usual US/Europe factor research, Taiwan's small-cap value premium is real and well-documented in our data.
References
- Fama, E. & French, K. (1992). "The Cross-Section of Expected Stock Returns." Journal of Finance, 47(2), 427-465.
- Fama, E. & French, K. (1993). "Common Risk Factors in the Returns on Stocks and Bonds." Journal of Financial Economics, 33(1), 3-56.
- Israel, R. & Moskowitz, T. (2013). "The Role of Shorting, Firm Size, and Time on Market Anomalies." Journal of Financial Economics, 108(2), 275-301.
- Lakonishok, J., Shleifer, A. & Vishny, R. (1994). "Contrarian Investment, Extrapolation, and Risk." Journal of Finance, 49(5), 1541-1578.
Data: Ceta Research, FMP financial data warehouse. Universe: TWSE small caps (NT$500M-NT$20B). Annual rebalance (July), equal weight top 30, 2000-2025. Returns in TWD.
Past performance does not guarantee future results. This is educational content, not investment advice.


