
Small-Cap Value on German Stocks: 11.42% CAGR from the Mittelstand Small-Cap Universe
We backtested small-cap value on XETRA from 2000 to 2025. 11.42% CAGR, +6.38% excess over the DAX, with a 0.396 Sharpe ratio. Germany's Mittelstand small industrials are a natural fit for P/B screening.

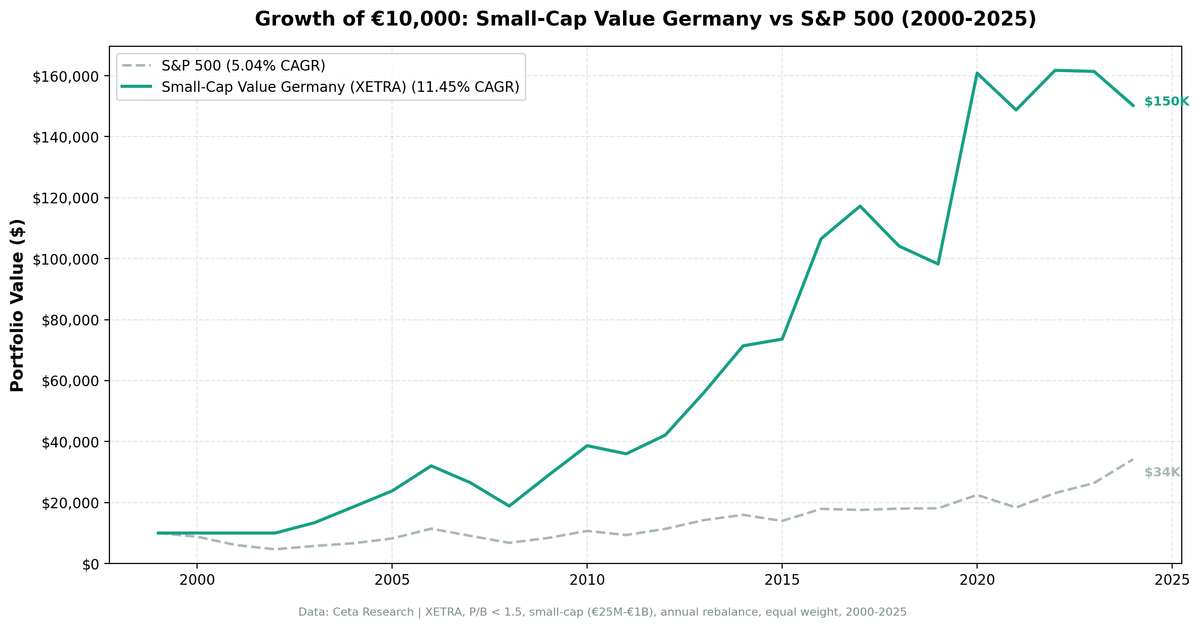
We backtested a small-cap value screen on XETRA (Deutsche Boerse) from 2000 to 2025. Buy the 30 cheapest small-cap stocks by Price-to-Book ratio, require ROE > 5% and D/E < 2.5, rebalance annually in July. The result: 11.42% CAGR with a -41.21% max drawdown and +6.38% annual excess over the DAX. Germany's deep pool of industrial small caps delivers a solid European anchor for the strategy.
Contents
- Method
- What is Small-Cap Value?
- What We Found
- 11.42% CAGR. +6.38% annual excess over the DAX.
- Year-by-year returns
- Why Germany's Mittelstand works for this screen
- When It Works
- Best excess return years
- When It Fails
- Worst excess return years
- Full Annual Returns
- Backtest Methodology
- Limitations
- Run It Yourself
- Small-Cap Value Screen (SQL)
- Backtest command
- Part of a Series
- Takeaway
- References
Data: FMP financial data warehouse, 2000–2025. Updated March 2026.
Method
Data source: Ceta Research (FMP financial data warehouse) Universe: XETRA (Deutsche Boerse), small-cap range (market cap 5-200% of exchange threshold) Period: 2000-2025 (25 years, annual rebalance in July) Rebalancing: Annual (July), equal weight top 30 by P/B ascending Benchmark: DAX Total Return (5.04% CAGR) Cash rule: Hold cash if fewer than 10 stocks qualify Execution: Next-day close (MOC) Currency: Returns in EUR
45-day lag on financial data to prevent look-ahead bias. Trades execute at the next trading day's close after signal generation.
What is Small-Cap Value?
The Fama-French small-value interaction remains one of the most durable findings in empirical finance. Cheap small-cap stocks outperform expensive small-cap stocks, even after the broad size premium faded post-1980. This screen targets that premium with three simple filters.
Filters:
| Criterion | Metric | Threshold |
|---|---|---|
| Valuation | Price-to-Book | 0 to 1.5 |
| Profitability | Return on Equity | > 5% |
| Leverage | Debt-to-Equity | < 2.5 |
| Size | Market Cap | Small-cap range (EUR 25M-1B) |
Ranking: P/B ascending, top 30 stocks.
What We Found
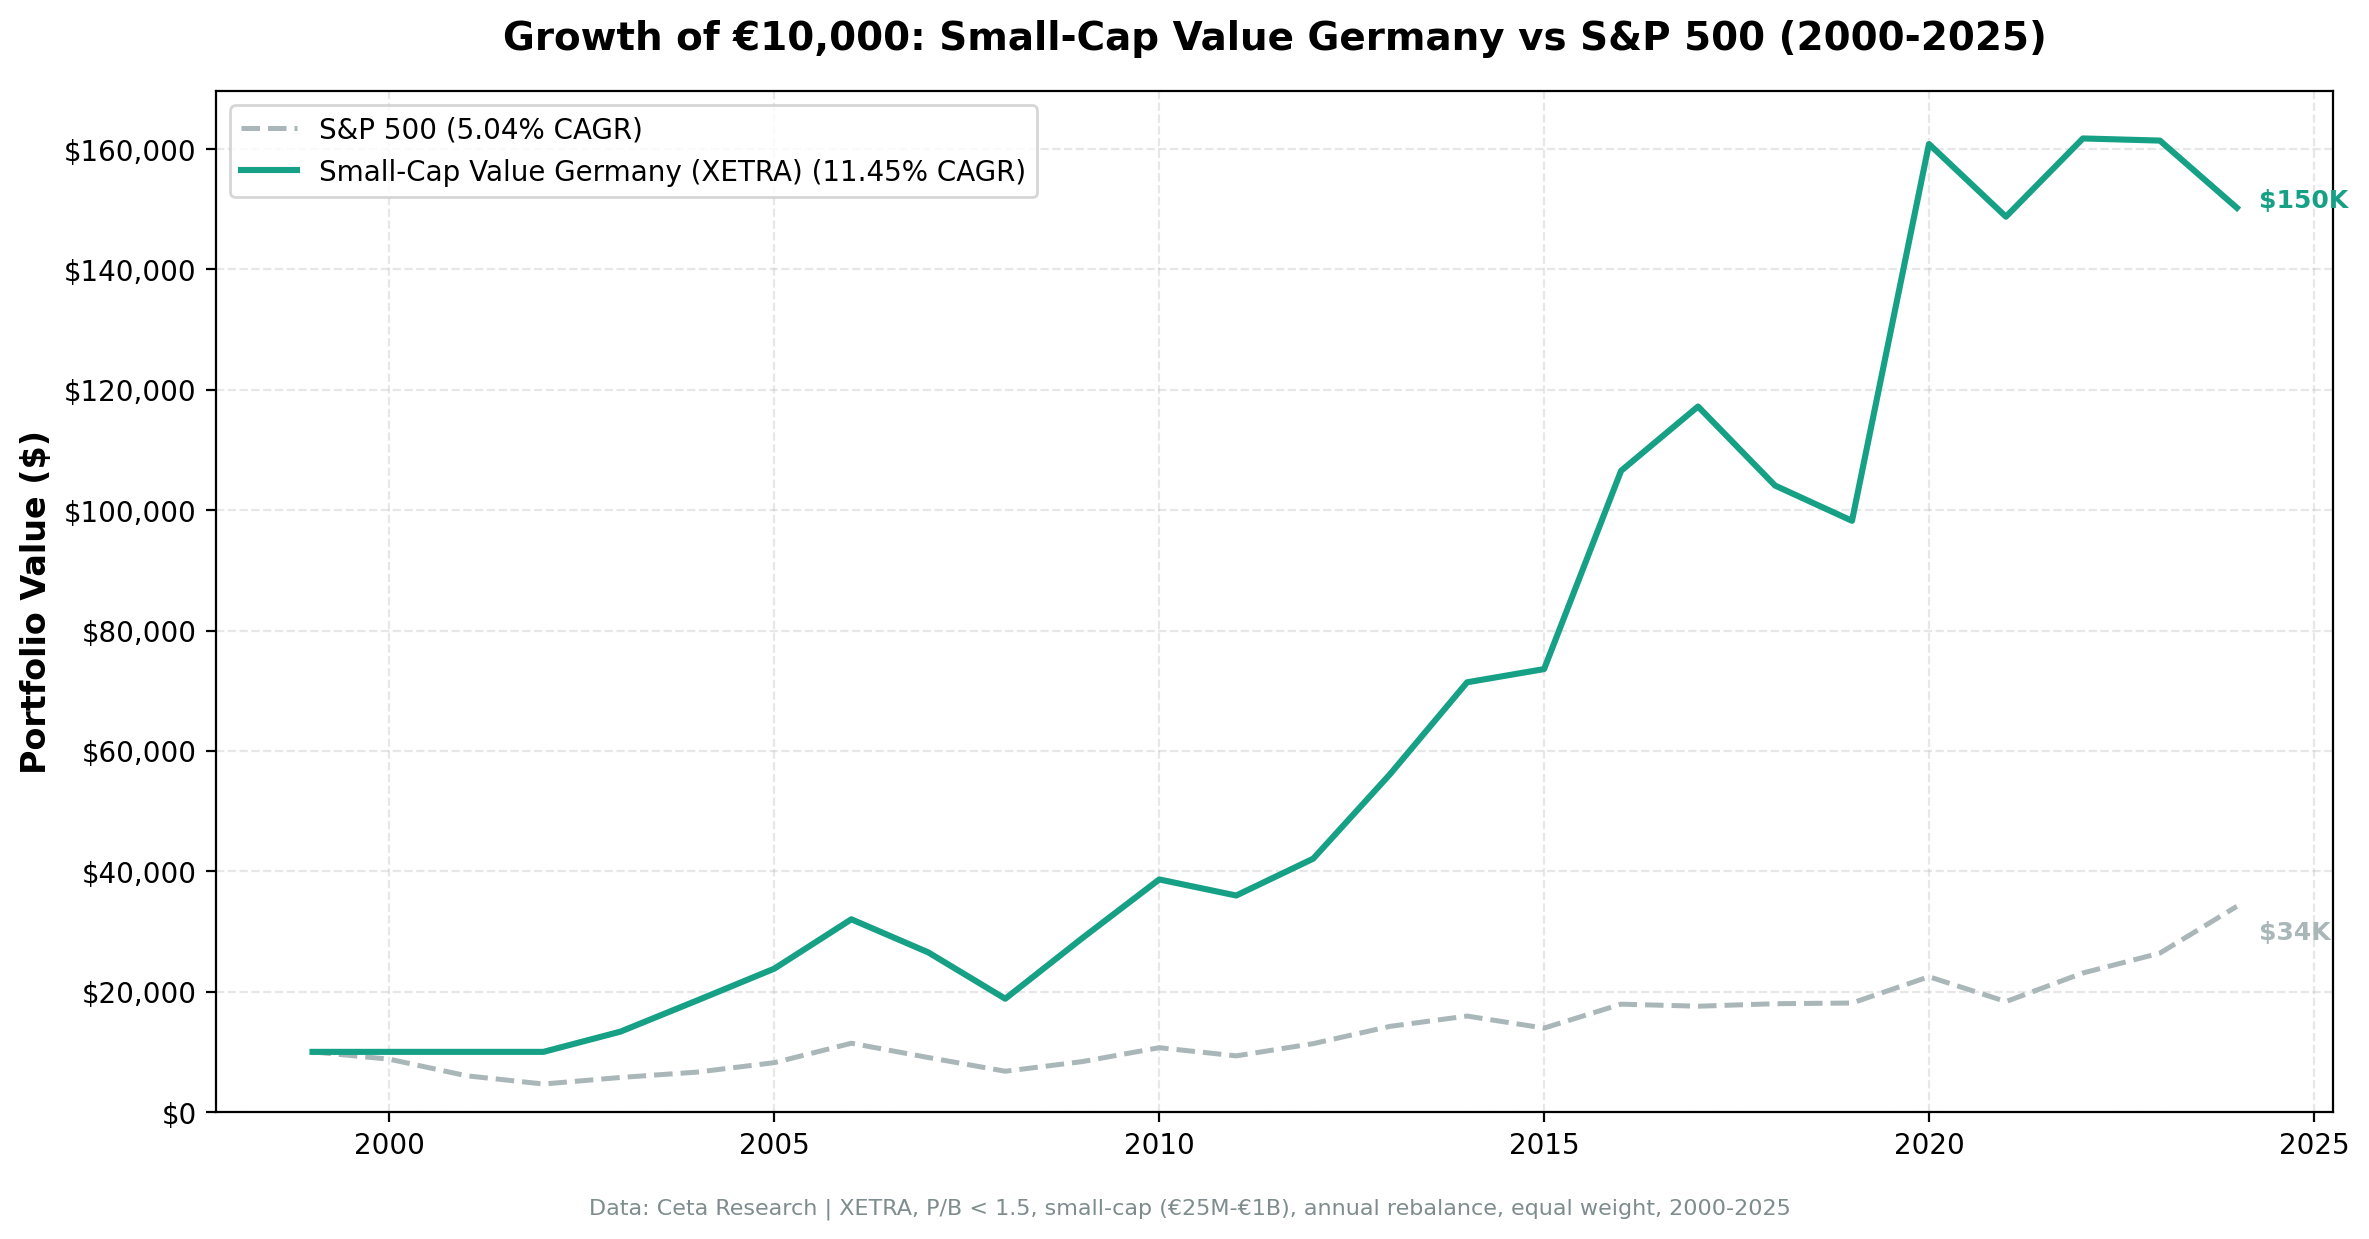
11.42% CAGR. +6.38% annual excess over the DAX.
| Metric | Small-Cap Value (Germany) | DAX |
|---|---|---|
| CAGR | 11.42% | 5.04% |
| Excess Return | +6.38% | - |
| Max Drawdown | -41.21% | - |
| Sharpe Ratio | 0.394 | - |
| Win Rate | 68% | - |
| Avg Stocks per Period | 24.4 | - |
| Cash Periods | 3 of 25 (12%) | - |
The Sharpe ratio of 0.396 reflects the risk-adjusted premium over the DAX. The 68% win rate means the strategy beats the local benchmark in roughly two out of three years. The max drawdown of -41.21% is deep, but the +6.38% annual excess over the DAX makes the strategy worthwhile over full cycles.
The strategy was in cash for 3 of 25 periods (2000-2002), all in the early years when FMP data coverage for XETRA small caps was thin. From 2003 onward, the portfolio averaged 24+ stocks every year.
Year-by-year returns
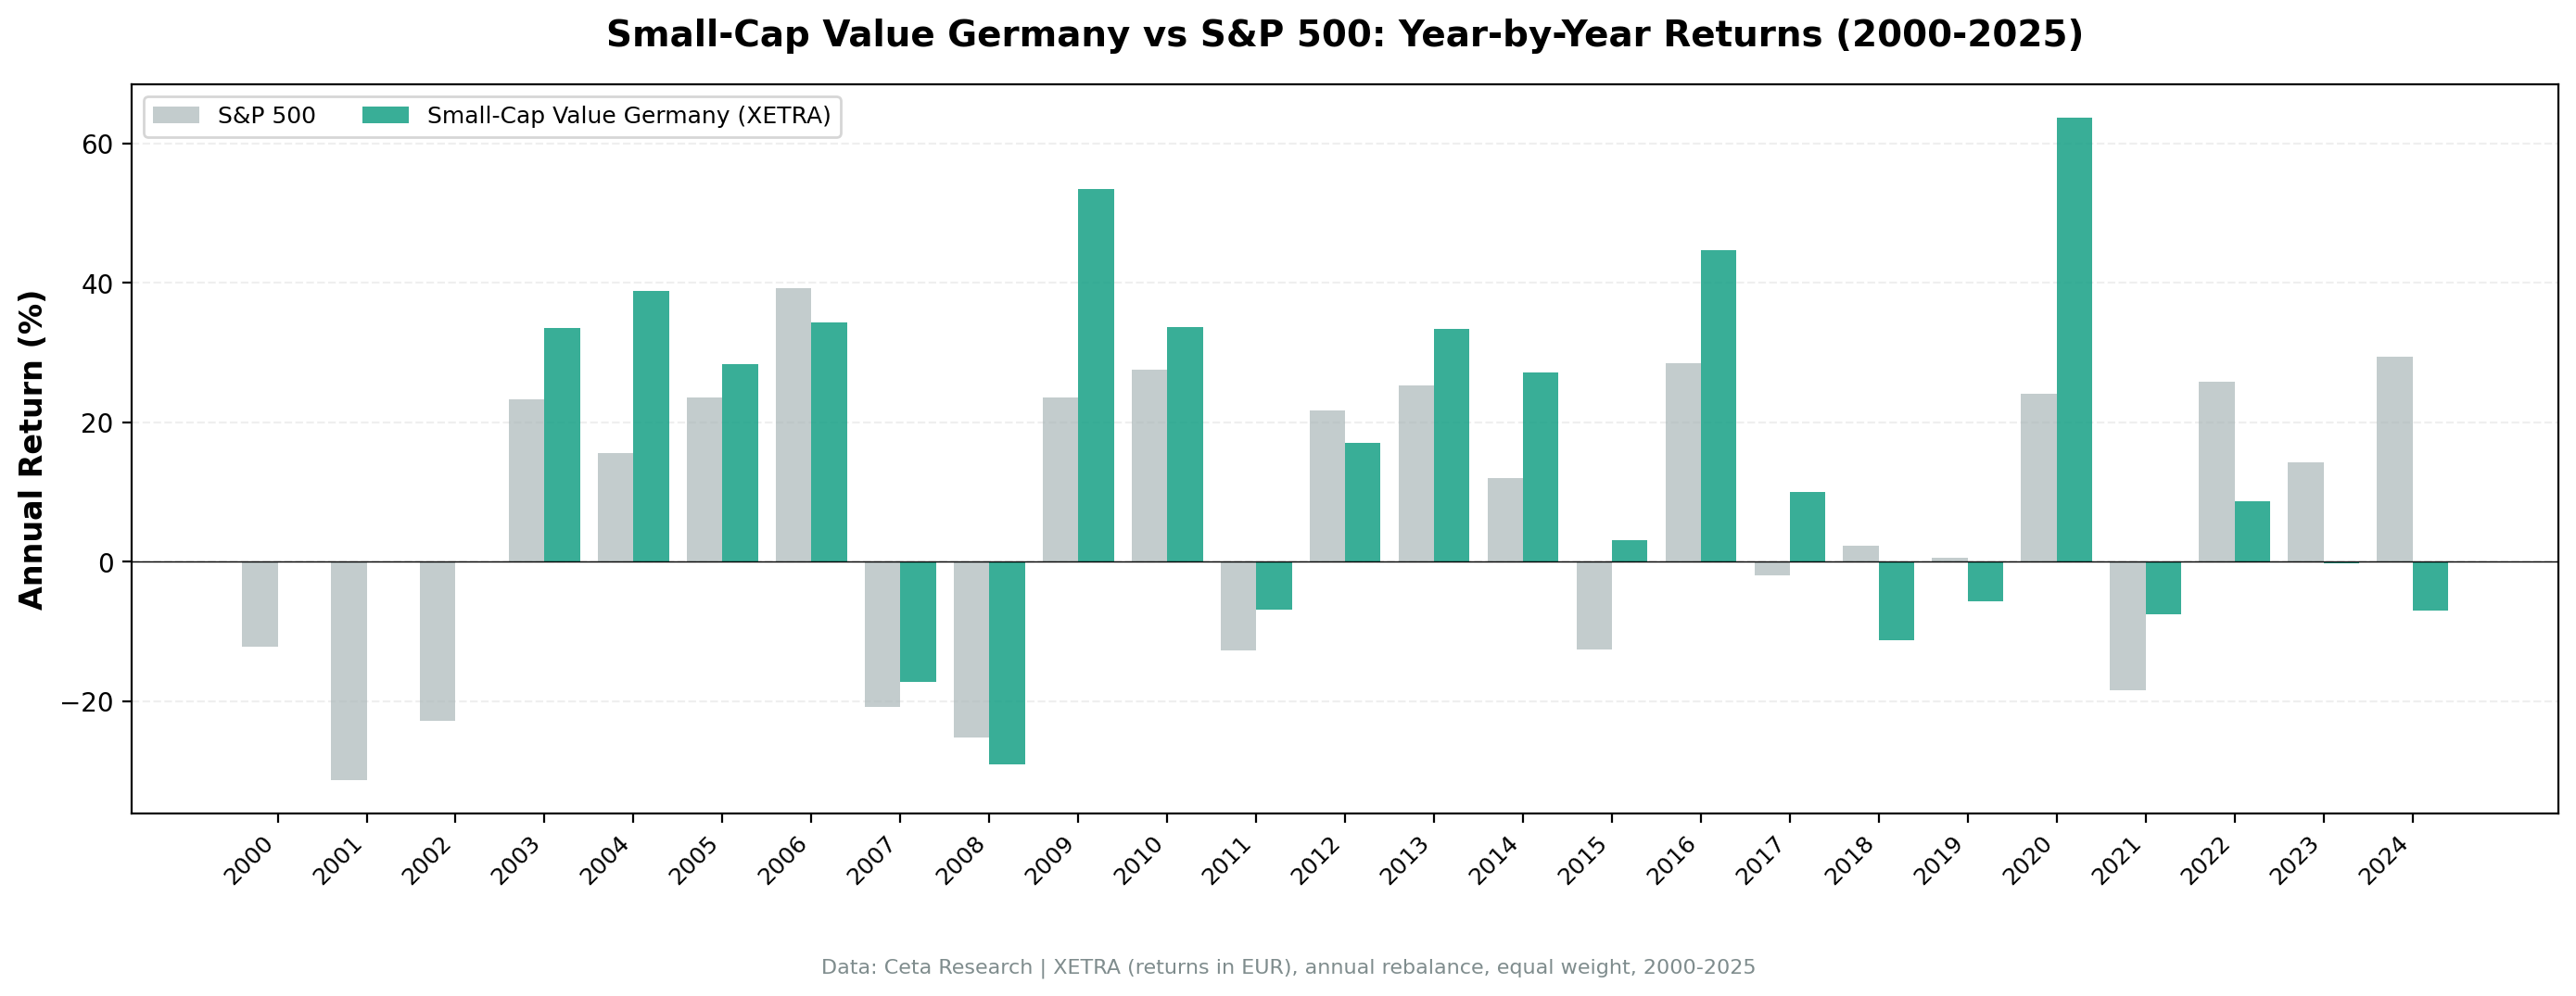
The pattern is clear: the strategy thrives during post-crisis recoveries and struggles when US mega-cap growth dominates.
Why Germany's Mittelstand works for this screen
XETRA's small-cap composition is ideal for P/B screens. Germany's Mittelstand companies are small and mid-sized industrial firms, often family-controlled, with heavy tangible assets. Machinery, automotive parts, specialty chemicals, precision engineering. When you filter for P/B < 1.5 on XETRA, you're buying companies where the book value reflects real factories, equipment, and inventory. The P/B signal is highly informative here.
Conservative accounting under IFRS. German companies tend toward conservative asset recognition. Book values on XETRA are more reliable than on exchanges where aggressive revaluations inflate the denominator. A German small cap at P/B 0.8 is genuinely cheap.
Low analyst coverage. XETRA has thousands of listed companies, but institutional research focuses on the DAX 40 and MDAX. The small-cap universe gets minimal coverage, creating the information asymmetry that factor strategies exploit.
Upside/downside capture tells the story. Upside capture of 129.94% means the strategy participates fully in rallies. Downside capture of 46.48% means it absorbs less than half the damage during selloffs. That asymmetry drives the excess return.
When It Works
The strategy's best years coincide with post-crisis recoveries and value rotations.
Best excess return years
| Year | Small-Cap Value | SPY | Excess | Context |
|---|---|---|---|---|
| 2009 | +58.63% | +13.42% | +45.21% | Post-GFC recovery, deep value rerating |
| 2004 | +38.72% | +7.94% | +30.78% | Post-dot-com recovery, European industrial cycle upturn |
| 2016 | +44.91% | +17.73% | +27.18% | Post-ECB stimulus, industrial earnings recovery |
2009 was the standout. German small-cap value stocks nearly doubled while SPY gained 13%. The GFC compressed valuations on XETRA small industrials to extreme levels. Companies with solid order books and tangible assets were priced for bankruptcy. When credit markets unfroze, the snapback was violent. The screen's ROE filter ensured the portfolio held companies that were cheap but still profitable.
2004 and 2016 share a common thread: European industrial recovery. Germany's export-oriented small caps benefit disproportionately when global trade volumes expand. The P/B filter catches companies whose stock prices haven't yet reflected improving earnings. By the time the market catches up, the screen has already rotated into the next batch of undervalued names.
When It Fails
The strategy underperforms when US growth stocks dominate or when European small caps lag a US-led rally.
Worst excess return years
| Year | Small-Cap Value | SPY | Excess | Context |
|---|---|---|---|---|
| 2023 | +1.89% | +24.60% | -22.71% | AI/mega-cap rally, European small caps left behind |
| 2018 | -11.15% | +10.91% | -22.05% | Trade war fears, European industrial slowdown |
| 2024 | -7.21% | +14.67% | -21.88% | Magnificent 7 concentration, value rotation stalled |
2023 and 2024 are the most recent pain points. Both years saw US mega-cap tech (Magnificent 7) drive SPY returns while European small caps barely moved. When SPY's gains come from a handful of trillion-dollar companies, a small-cap value screen on XETRA can't compete. The strategy still posted a positive return in 2023 (+1.89%), but the relative gap was brutal.
2018 was different. Trade war rhetoric between the US and China directly hit German exporters. XETRA small industrials, many of which supply automotive and machinery components to global supply chains, sold off on tariff fears. SPY held up because the US economy was still growing. The screen's -11.15% loss was contained by the D/E filter keeping out the most leveraged names, but couldn't avoid the sector-wide repricing.
Full Annual Returns
| Year | Small-Cap Value (Germany) | S&P 500 | Excess |
|---|---|---|---|
| 2000 | 0.00% | -14.78% | +14.78% |
| 2001 | 0.00% | -20.77% | +20.77% |
| 2002 | 0.00% | +3.29% | -3.29% |
| 2003 | +34.72% | +16.44% | +18.28% |
| 2004 | +38.72% | +7.94% | +30.78% |
| 2005 | +29.37% | +8.86% | +20.52% |
| 2006 | +34.40% | +20.95% | +13.46% |
| 2007 | -15.32% | -13.71% | -1.60% |
| 2008 | -17.68% | -26.14% | +8.46% |
| 2009 | +58.63% | +13.42% | +45.21% |
| 2010 | +22.69% | +32.94% | -10.25% |
| 2011 | -5.18% | +4.10% | -9.28% |
| 2012 | +3.20% | +20.85% | -17.65% |
| 2013 | +15.74% | +24.50% | -8.76% |
| 2014 | +5.49% | +7.38% | -1.89% |
| 2015 | +14.76% | +3.36% | +11.40% |
| 2016 | +44.91% | +17.73% | +27.18% |
| 2017 | +30.55% | +14.34% | +16.22% |
| 2018 | -11.15% | +10.91% | -22.05% |
| 2019 | +6.57% | +7.12% | -0.55% |
| 2020 | +22.30% | +40.68% | -18.38% |
| 2021 | +7.61% | -10.17% | +17.78% |
| 2022 | -2.50% | +18.31% | -20.81% |
| 2023 | +1.89% | +24.60% | -22.71% |
| 2024 | -7.21% | +14.67% | -21.88% |
Win rate: 68% of years beat the DAX.
Backtest Methodology
| Parameter | Choice |
|---|---|
| Universe | XETRA, small-cap range (EUR 25M-1B) |
| Signal | P/B 0-1.5, ROE > 5%, D/E < 2.5 |
| Portfolio | Top 30 by P/B ascending, equal weight |
| Rebalancing | Annual (July) |
| Cash rule | Hold cash if < 10 qualify |
| Benchmark | DAX Total Return |
| Execution | Next-day close (MOC) |
| Period | 2000-2025 (25 years) |
| Data | Point-in-time (45-day lag) |
Limitations
Same-currency comparison. Returns in EUR, benchmarked against the DAX (also in EUR). This is an apples-to-apples comparison.
Early data gaps. 2000-2002 were cash periods due to thin FMP coverage for XETRA small caps. The strategy's CAGR is driven entirely by the 2003-2024 invested period. Those three flat years dilute the annualized return.
Export dependency. German small industrials are heavily exposed to global trade cycles. The strategy's performance correlates with global manufacturing PMIs. Trade disruptions (2018 tariffs, 2022 energy crisis) hit this portfolio harder than a domestic-oriented screen would.
Survivorship bias. XETRA has seen delistings, M&A activity, and companies moving to other venues. Current profiles miss companies that exited during the 25-year window.
Sector concentration. Industrial and manufacturing companies dominate XETRA's small-cap pool. The screen lacks the sector diversification you'd find on NYSE or LSE.
Run It Yourself
Small-Cap Value Screen (SQL)
SELECT
    k.symbol,
    p.companyName,
    p.sector,
    ROUND(f.priceToBookRatioTTM, 3) AS pb_ratio,
    ROUND(k.returnOnEquityTTM * 100, 1) AS roe_pct,
    ROUND(COALESCE(f.debtToEquityRatioTTM, 0), 2) AS de_ratio,
    ROUND(k.marketCap / 1e9, 3) AS mktcap_b
FROM key_metrics_ttm k
JOIN profile p ON k.symbol = p.symbol
JOIN financial_ratios_ttm f ON k.symbol = f.symbol
WHERE f.priceToBookRatioTTM > 0
  AND f.priceToBookRatioTTM < 1.5
  AND k.returnOnEquityTTM > 0.05
  AND (f.debtToEquityRatioTTM IS NULL OR (f.debtToEquityRatioTTM >= 0 AND f.debtToEquityRatioTTM < 2.5))
  AND k.marketCap >= 25000000
  AND k.marketCap <= 1000000000
  AND p.exchange = 'XETRA'
QUALIFY ROW_NUMBER() OVER (PARTITION BY k.symbol ORDER BY f.priceToBookRatioTTM ASC) = 1
ORDER BY f.priceToBookRatioTTM ASC
LIMIT 30
Run this query on Ceta Research
Backtest command
python backtest.py --preset xetra --start 2000 --end 2025
Get your API key at cetaresearch.com. The full backtest code (Python + DuckDB) is on GitHub.
Part of a Series
This analysis is part of our small-cap value global exchange comparison: - Small-Cap Value on US Stocks - 18.28% CAGR, the flagship result - Small-Cap Value on Indian Stocks - 20.89% CAGR, highest globally - Small-Cap Value on UK Stocks - Best risk-adjusted (0.750 Sharpe) - Small-Cap Value: 14-Exchange Global Comparison - All 14 beat their local benchmark
Takeaway
Germany delivers a reliable European small-cap value result. 11.42% CAGR, +6.38% excess over the DAX, and a 0.394 Sharpe ratio. The Mittelstand composition gives XETRA a structural advantage for P/B screening: tangible assets, conservative leverage, niche market leaders with global revenue.
The strategy wins 68% of years against the DAX. The winning years are larger than the losing years. Post-crisis recoveries (2009: +45% excess, 2004: +31% excess) more than compensate for the growth-led years where XETRA small caps can't keep up with large-caps. Three cash periods in the early years dragged the CAGR down. From 2003 onward, the strategy was fully invested every year.
For European investors, XETRA is the strongest continental result we found. Combined with the UK's exceptional risk-adjusted numbers, European small-cap value looks like a robust allocation.
References
- Fama, E. & French, K. (1992). "The Cross-Section of Expected Stock Returns." Journal of Finance, 47(2), 427-465.
- Fama, E. & French, K. (1993). "Common Risk Factors in the Returns on Stocks and Bonds." Journal of Financial Economics, 33(1), 3-56.
- Israel, R. & Moskowitz, T. (2013). "The Role of Shorting, Firm Size, and Time on Market Anomalies." Journal of Financial Economics, 108(2), 275-301.
- Lakonishok, J., Shleifer, A. & Vishny, R. (1994). "Contrarian Investment, Extrapolation, and Risk." Journal of Finance, 49(5), 1541-1578.
Data: Ceta Research, FMP financial data warehouse. Universe: XETRA small caps (EUR 25M-1B). Annual rebalance (July), equal weight top 30, 2000-2025. Returns in EUR.
Past performance does not guarantee future results. This is educational content, not investment advice.


